Whitefish, MT Map & Demographics
Whitefish Map
Whitefish Overview
$58,504
PER CAPITA INCOME
$122,500
AVG FAMILY INCOME
$69,919
AVG HOUSEHOLD INCOME
30.1%
WAGE / INCOME GAP [ % ]
69.9¢/ $1
WAGE / INCOME GAP [ $ ]
0.53
INEQUALITY / GINI INDEX
8,098
TOTAL POPULATION
4,004
MALE POPULATION
4,094
FEMALE POPULATION
97.80
MALES / 100 FEMALES
102.25
FEMALES / 100 MALES
43.0
MEDIAN AGE
2.8
AVG FAMILY SIZE
2.1
AVG HOUSEHOLD SIZE
4,711
LABOR FORCE [ PEOPLE ]
68.4%
PERCENT IN LABOR FORCE
2.5%
UNEMPLOYMENT RATE
Whitefish Zip Codes
Whitefish Area Codes
Income in Whitefish
Income Overview in Whitefish
Per Capita Income in Whitefish is $58,504, while median incomes of families and households are $122,500 and $69,919 respectively.
| Characteristic | Number | Measure |
| Per Capita Income | 8,098 | $58,504 |
| Median Family Income | 2,014 | $122,500 |
| Mean Family Income | 2,014 | $165,642 |
| Median Household Income | 3,817 | $69,919 |
| Mean Household Income | 3,817 | $120,009 |
| Income Deficit | 2,014 | $0 |
| Wage / Income Gap (%) | 8,098 | 30.14% |
| Wage / Income Gap ($) | 8,098 | 69.86¢ per $1 |
| Gini / Inequality Index | 8,098 | 0.53 |
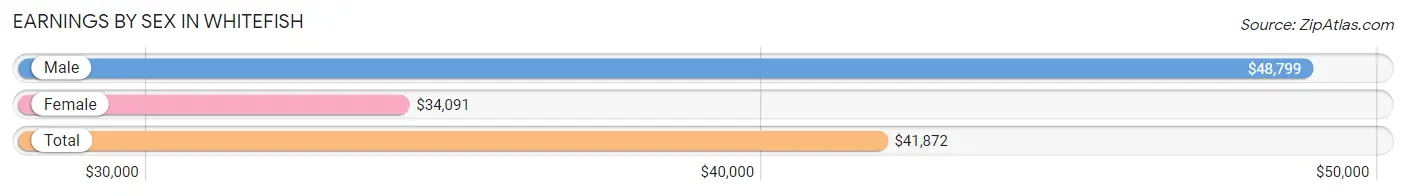
Earnings by Sex in Whitefish
Average Earnings in Whitefish are $41,872, $48,799 for men and $34,091 for women, a difference of 30.1%.
| Sex | Number | Average Earnings |
| Male | 2,425 (48.5%) | $48,799 |
| Female | 2,576 (51.5%) | $34,091 |
| Total | 5,001 (100.0%) | $41,872 |
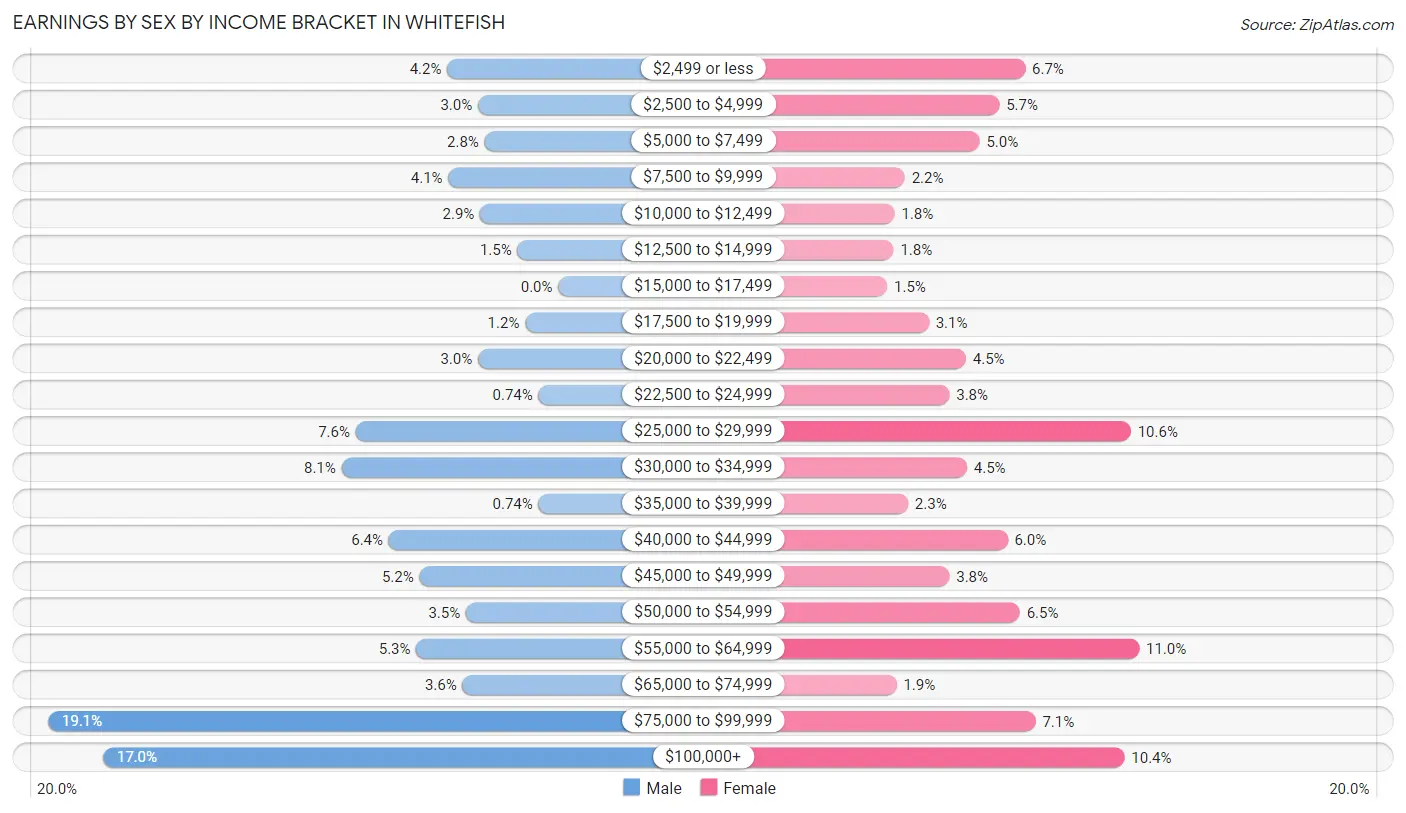
Earnings by Sex by Income Bracket in Whitefish
The most common earnings brackets in Whitefish are $75,000 to $99,999 for men (463 | 19.1%) and $55,000 to $64,999 for women (282 | 11.0%).
| Income | Male | Female |
| $2,499 or less | 101 (4.2%) | 172 (6.7%) |
| $2,500 to $4,999 | 73 (3.0%) | 147 (5.7%) |
| $5,000 to $7,499 | 67 (2.8%) | 128 (5.0%) |
| $7,500 to $9,999 | 100 (4.1%) | 56 (2.2%) |
| $10,000 to $12,499 | 71 (2.9%) | 46 (1.8%) |
| $12,500 to $14,999 | 37 (1.5%) | 45 (1.8%) |
| $15,000 to $17,499 | 0 (0.0%) | 39 (1.5%) |
| $17,500 to $19,999 | 30 (1.2%) | 79 (3.1%) |
| $20,000 to $22,499 | 73 (3.0%) | 115 (4.5%) |
| $22,500 to $24,999 | 18 (0.7%) | 99 (3.8%) |
| $25,000 to $29,999 | 184 (7.6%) | 274 (10.6%) |
| $30,000 to $34,999 | 197 (8.1%) | 116 (4.5%) |
| $35,000 to $39,999 | 18 (0.7%) | 59 (2.3%) |
| $40,000 to $44,999 | 154 (6.4%) | 155 (6.0%) |
| $45,000 to $49,999 | 126 (5.2%) | 99 (3.8%) |
| $50,000 to $54,999 | 84 (3.5%) | 167 (6.5%) |
| $55,000 to $64,999 | 129 (5.3%) | 282 (11.0%) |
| $65,000 to $74,999 | 87 (3.6%) | 48 (1.9%) |
| $75,000 to $99,999 | 463 (19.1%) | 182 (7.1%) |
| $100,000+ | 413 (17.0%) | 268 (10.4%) |
| Total | 2,425 (100.0%) | 2,576 (100.0%) |
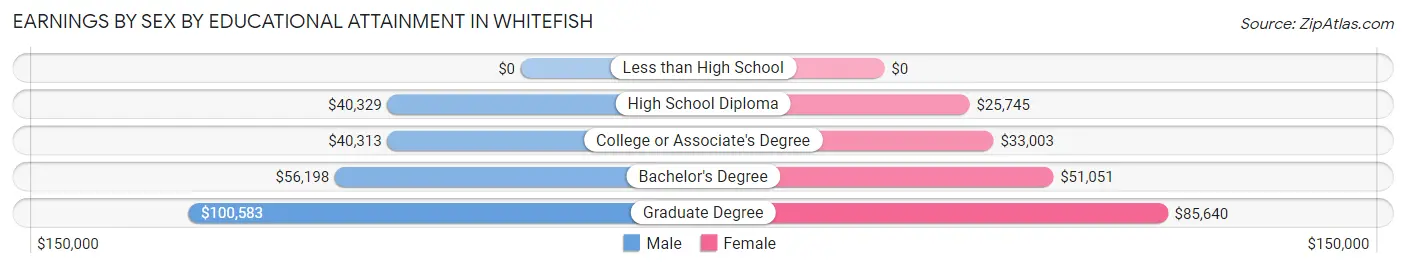
Earnings by Sex by Educational Attainment in Whitefish
Average earnings in Whitefish are $55,049 for men and $40,721 for women, a difference of 26.0%. Men with an educational attainment of graduate degree enjoy the highest average annual earnings of $100,583, while those with college or associate's degree education earn the least with $40,313. Women with an educational attainment of graduate degree earn the most with the average annual earnings of $85,640, while those with high school diploma education have the smallest earnings of $25,745.
| Educational Attainment | Male Income | Female Income |
| Less than High School | - | - |
| High School Diploma | $40,329 | $25,745 |
| College or Associate's Degree | $40,313 | $33,003 |
| Bachelor's Degree | $56,198 | $51,051 |
| Graduate Degree | $100,583 | $85,640 |
| Total | $55,049 | $40,721 |
Family Income in Whitefish
Family Income Brackets in Whitefish
According to the Whitefish family income data, there are 453 families falling into the $100,000 to $149,999 income range, which is the most common income bracket and makes up 22.5% of all families.
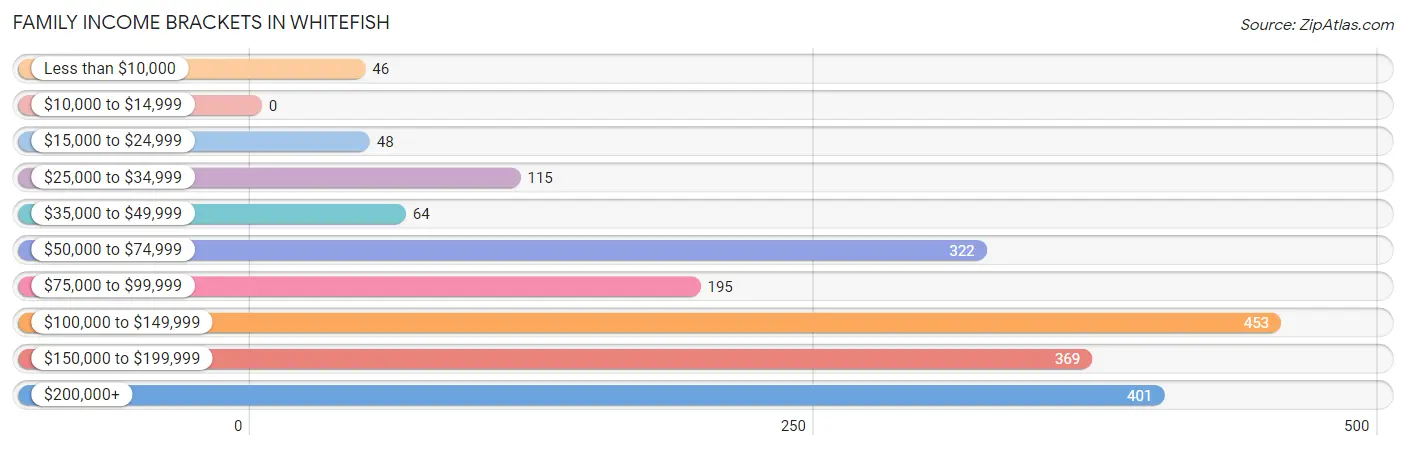
| Income Bracket | # Families | % Families |
| Less than $10,000 | 46 | 2.3% |
| $10,000 to $14,999 | 0 | 0.0% |
| $15,000 to $24,999 | 48 | 2.4% |
| $25,000 to $34,999 | 115 | 5.7% |
| $35,000 to $49,999 | 64 | 3.2% |
| $50,000 to $74,999 | 322 | 16.0% |
| $75,000 to $99,999 | 195 | 9.7% |
| $100,000 to $149,999 | 453 | 22.5% |
| $150,000 to $199,999 | 369 | 18.3% |
| $200,000+ | 401 | 19.9% |
Family Income by Famaliy Size in Whitefish
4-person families (431 | 21.4%) account for the highest median family income in Whitefish with $151,948 per family, while 2-person families (1,178 | 58.5%) have the highest median income of $53,788 per family member.
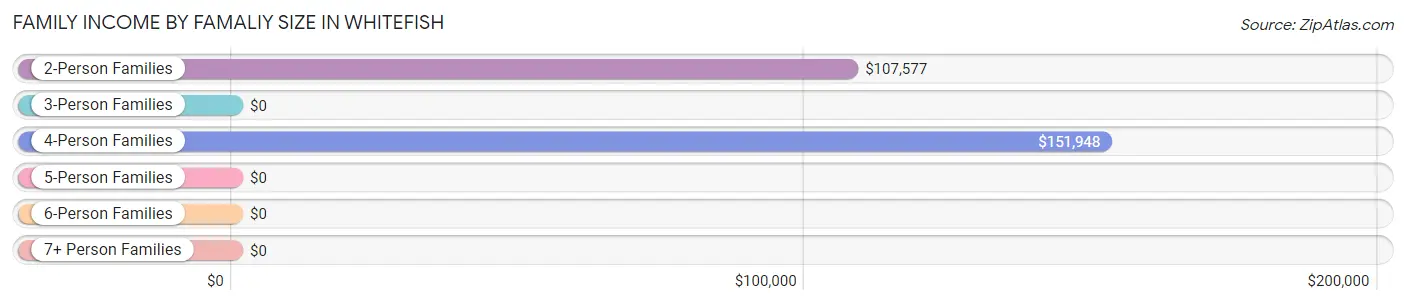
| Income Bracket | # Families | Median Income |
| 2-Person Families | 1,178 (58.5%) | $107,577 |
| 3-Person Families | 245 (12.2%) | $0 |
| 4-Person Families | 431 (21.4%) | $151,948 |
| 5-Person Families | 115 (5.7%) | $0 |
| 6-Person Families | 45 (2.2%) | $0 |
| 7+ Person Families | 0 (0.0%) | $0 |
| Total | 2,014 (100.0%) | $122,500 |
Family Income by Number of Earners in Whitefish
The median family income in Whitefish is $122,500, with families comprising 2 earners (870) having the highest median family income of $161,513, while families with no earners (207) have the lowest median family income of $59,875, accounting for 43.2% and 10.3% of families, respectively.
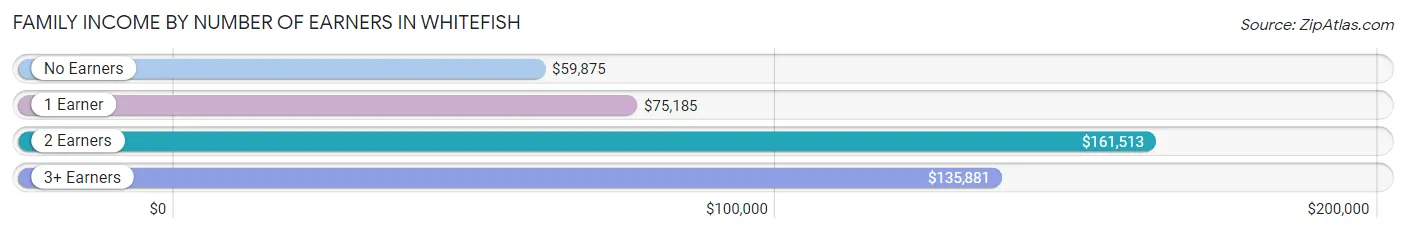
| Number of Earners | # Families | Median Income |
| No Earners | 207 (10.3%) | $59,875 |
| 1 Earner | 728 (36.1%) | $75,185 |
| 2 Earners | 870 (43.2%) | $161,513 |
| 3+ Earners | 209 (10.4%) | $135,881 |
| Total | 2,014 (100.0%) | $122,500 |
Household Income in Whitefish
Household Income Brackets in Whitefish
With 828 households falling in the category, the $50,000 to $74,999 income range is the most frequent in Whitefish, accounting for 21.7% of all households. In contrast, only 118 households (3.1%) fall into the $10,000 to $14,999 income bracket, making it the least populous group.
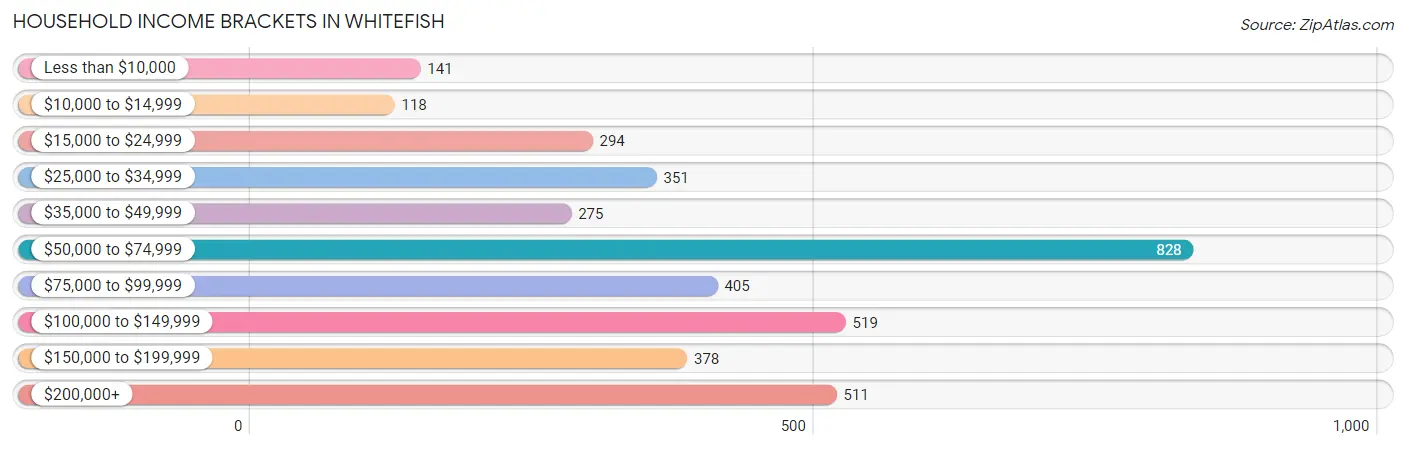
| Income Bracket | # Households | % Households |
| Less than $10,000 | 141 | 3.7% |
| $10,000 to $14,999 | 118 | 3.1% |
| $15,000 to $24,999 | 294 | 7.7% |
| $25,000 to $34,999 | 351 | 9.2% |
| $35,000 to $49,999 | 275 | 7.2% |
| $50,000 to $74,999 | 828 | 21.7% |
| $75,000 to $99,999 | 405 | 10.6% |
| $100,000 to $149,999 | 519 | 13.6% |
| $150,000 to $199,999 | 378 | 9.9% |
| $200,000+ | 511 | 13.4% |
Household Income by Householder Age in Whitefish
The median household income in Whitefish is $69,919, with the highest median household income of $97,539 found in the 45 to 64 years age bracket for the primary householder. A total of 1,223 households (32.0%) fall into this category. Meanwhile, the 15 to 24 years age bracket for the primary householder has the lowest median household income of $0, with 70 households (1.8%) in this group.
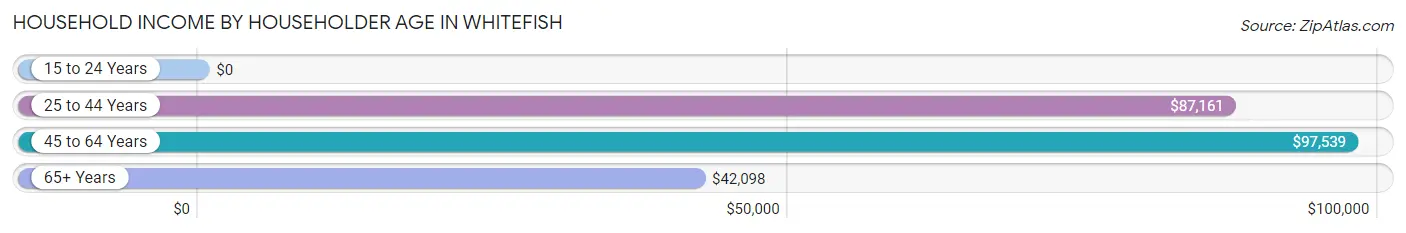
| Income Bracket | # Households | Median Income |
| 15 to 24 Years | 70 (1.8%) | $0 |
| 25 to 44 Years | 1,301 (34.1%) | $87,161 |
| 45 to 64 Years | 1,223 (32.0%) | $97,539 |
| 65+ Years | 1,223 (32.0%) | $42,098 |
| Total | 3,817 (100.0%) | $69,919 |
Poverty in Whitefish
Income Below Poverty by Sex and Age in Whitefish
With 4.6% poverty level for males and 8.8% for females among the residents of Whitefish, 6 to 11 year old males and 16 and 17 year old females are the most vulnerable to poverty, with 51 males (18.8%) and 19 females (19.6%) in their respective age groups living below the poverty level.
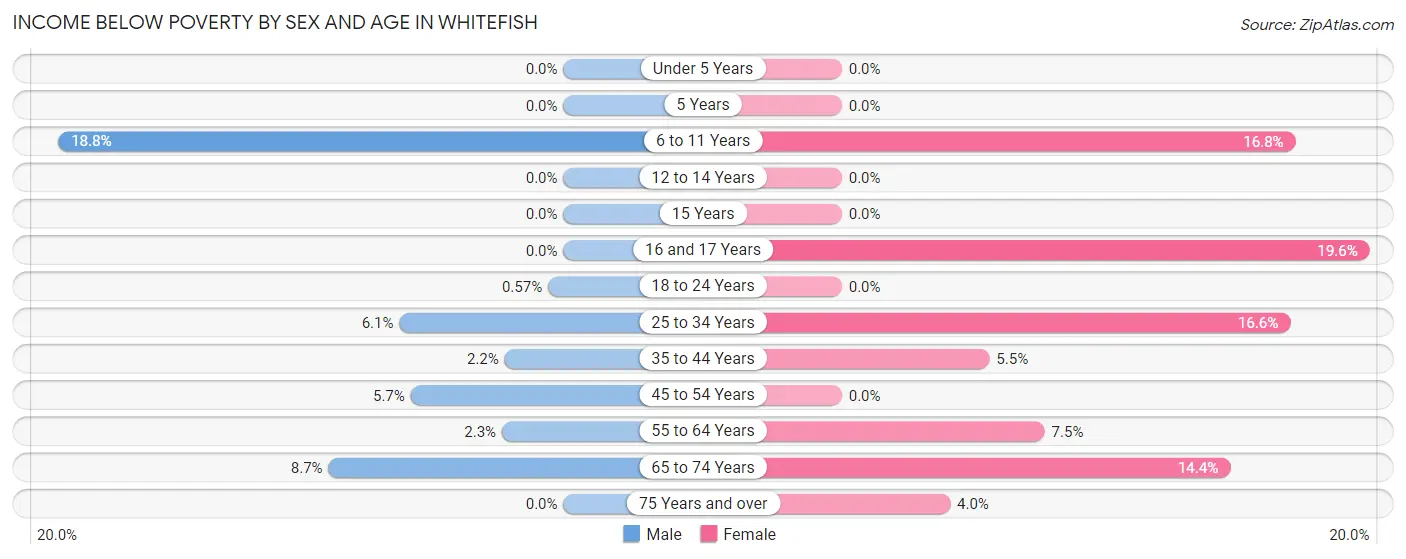
| Age Bracket | Male | Female |
| Under 5 Years | 0 (0.0%) | 0 (0.0%) |
| 5 Years | 0 (0.0%) | 0 (0.0%) |
| 6 to 11 Years | 51 (18.8%) | 50 (16.8%) |
| 12 to 14 Years | 0 (0.0%) | 0 (0.0%) |
| 15 Years | 0 (0.0%) | 0 (0.0%) |
| 16 and 17 Years | 0 (0.0%) | 19 (19.6%) |
| 18 to 24 Years | 1 (0.6%) | 0 (0.0%) |
| 25 to 34 Years | 42 (6.1%) | 108 (16.6%) |
| 35 to 44 Years | 12 (2.2%) | 36 (5.5%) |
| 45 to 54 Years | 28 (5.7%) | 0 (0.0%) |
| 55 to 64 Years | 10 (2.3%) | 45 (7.5%) |
| 65 to 74 Years | 38 (8.7%) | 82 (14.4%) |
| 75 Years and over | 0 (0.0%) | 14 (4.0%) |
| Total | 182 (4.6%) | 354 (8.8%) |
Income Above Poverty by Sex and Age in Whitefish
According to the poverty statistics in Whitefish, males aged under 5 years and females aged under 5 years are the age groups that are most secure financially, with 100.0% of males and 100.0% of females in these age groups living above the poverty line.
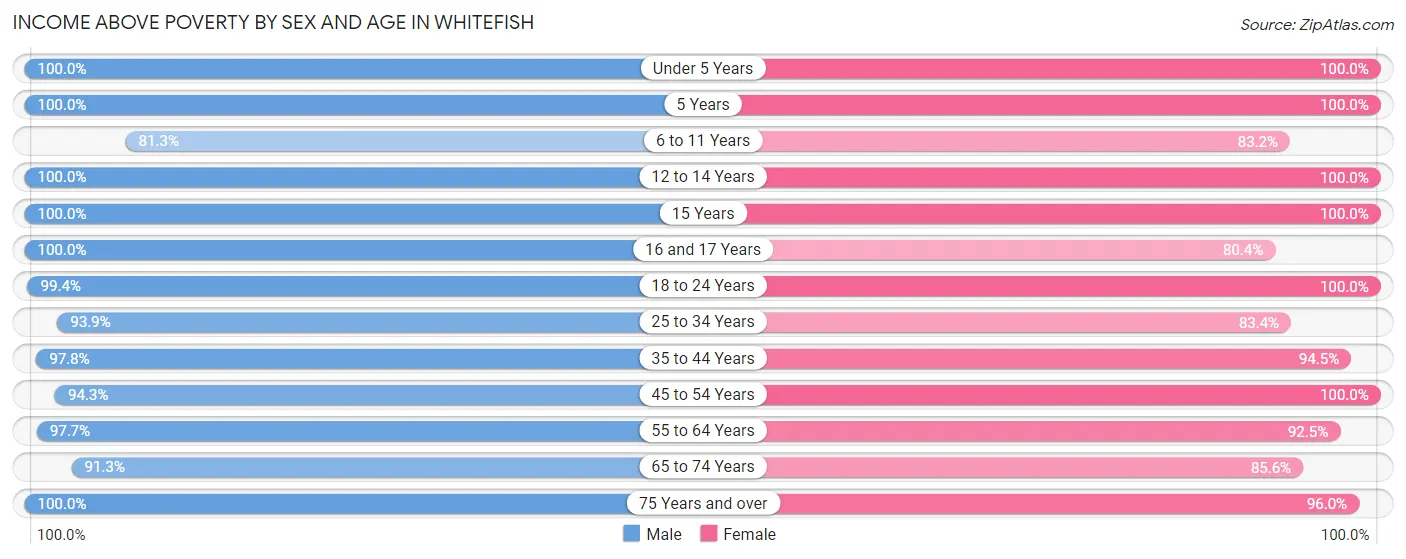
| Age Bracket | Male | Female |
| Under 5 Years | 236 (100.0%) | 69 (100.0%) |
| 5 Years | 32 (100.0%) | 19 (100.0%) |
| 6 to 11 Years | 221 (81.2%) | 247 (83.2%) |
| 12 to 14 Years | 87 (100.0%) | 50 (100.0%) |
| 15 Years | 95 (100.0%) | 42 (100.0%) |
| 16 and 17 Years | 70 (100.0%) | 78 (80.4%) |
| 18 to 24 Years | 173 (99.4%) | 158 (100.0%) |
| 25 to 34 Years | 648 (93.9%) | 541 (83.4%) |
| 35 to 44 Years | 539 (97.8%) | 621 (94.5%) |
| 45 to 54 Years | 466 (94.3%) | 454 (100.0%) |
| 55 to 64 Years | 428 (97.7%) | 553 (92.5%) |
| 65 to 74 Years | 398 (91.3%) | 487 (85.6%) |
| 75 Years and over | 345 (100.0%) | 334 (96.0%) |
| Total | 3,738 (95.4%) | 3,653 (91.2%) |
Income Below Poverty Among Married-Couple Families in Whitefish
The poverty statistics for married-couple families in Whitefish show that 1.8% or 30 of the total 1,675 families live below the poverty line. Families with no children have the highest poverty rate of 3.1%, comprising of 30 families. On the other hand, families with 1 or 2 children have the lowest poverty rate of 0.0%, which includes 0 families.
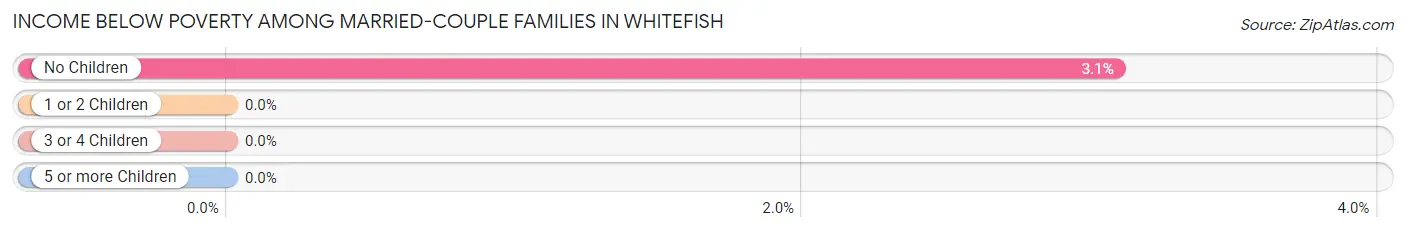
| Children | Above Poverty | Below Poverty |
| No Children | 941 (96.9%) | 30 (3.1%) |
| 1 or 2 Children | 623 (100.0%) | 0 (0.0%) |
| 3 or 4 Children | 81 (100.0%) | 0 (0.0%) |
| 5 or more Children | 0 (0.0%) | 0 (0.0%) |
| Total | 1,645 (98.2%) | 30 (1.8%) |
Income Below Poverty Among Single-Parent Households in Whitefish
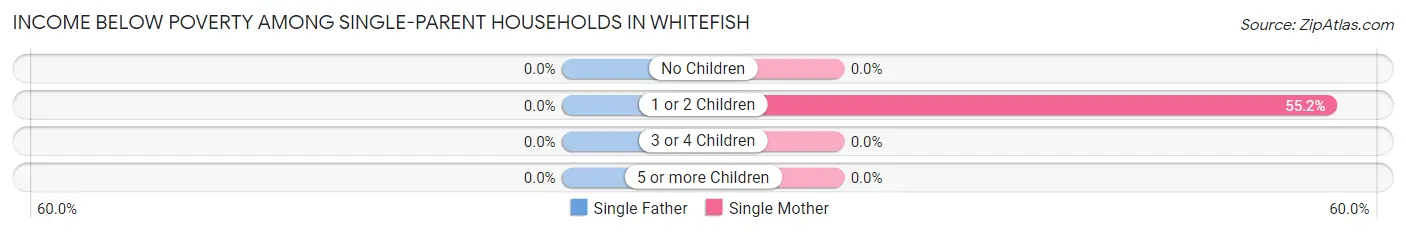
| Children | Single Father | Single Mother |
| No Children | 0 (0.0%) | 0 (0.0%) |
| 1 or 2 Children | 0 (0.0%) | 64 (55.2%) |
| 3 or 4 Children | 0 (0.0%) | 0 (0.0%) |
| 5 or more Children | 0 (0.0%) | 0 (0.0%) |
| Total | 0 (0.0%) | 64 (22.2%) |
Income Below Poverty Among Married-Couple vs Single-Parent Households in Whitefish
The poverty data for Whitefish shows that 30 of the married-couple family households (1.8%) and 64 of the single-parent households (18.9%) are living below the poverty level. Within the married-couple family households, those with no children have the highest poverty rate, with 30 households (3.1%) falling below the poverty line. Among the single-parent households, those with 1 or 2 children have the highest poverty rate, with 64 household (49.2%) living below poverty.
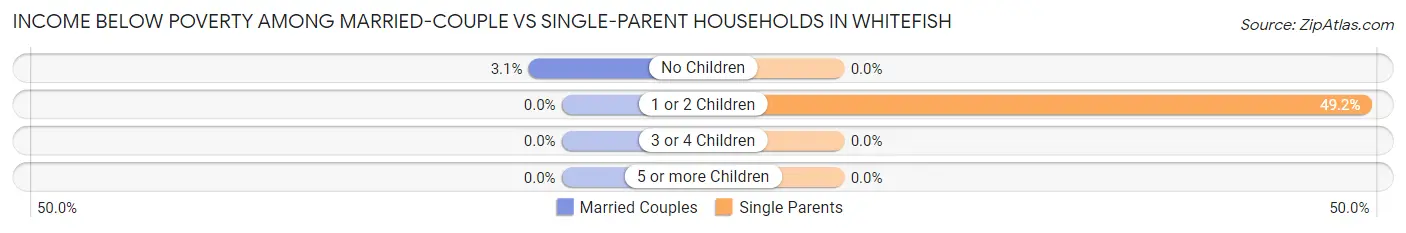
| Children | Married-Couple Families | Single-Parent Households |
| No Children | 30 (3.1%) | 0 (0.0%) |
| 1 or 2 Children | 0 (0.0%) | 64 (49.2%) |
| 3 or 4 Children | 0 (0.0%) | 0 (0.0%) |
| 5 or more Children | 0 (0.0%) | 0 (0.0%) |
| Total | 30 (1.8%) | 64 (18.9%) |
Race in Whitefish
The most populous races in Whitefish are White / Caucasian (7,708 | 95.2%), Two or more Races (316 | 3.9%), and Hispanic or Latino (135 | 1.7%).
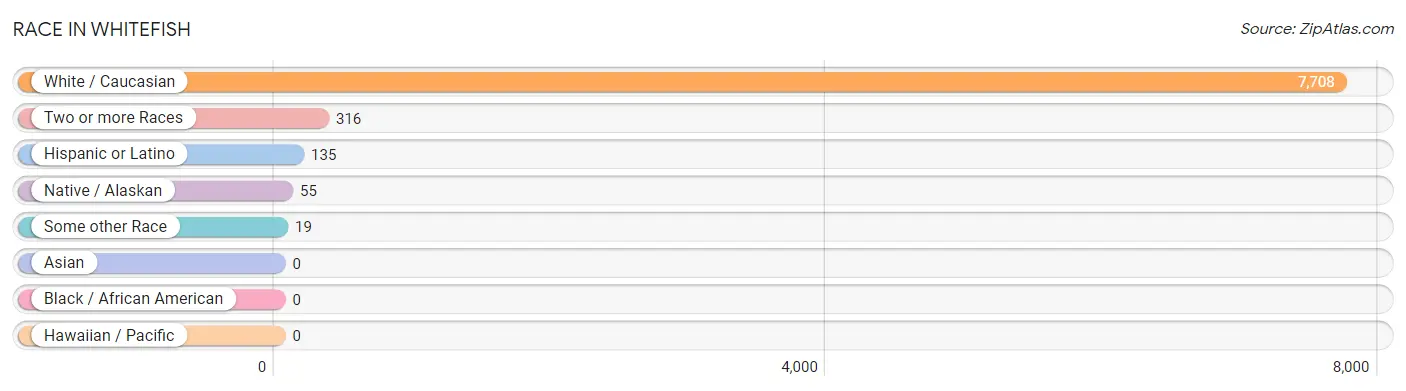
| Race | # Population | % Population |
| Asian | 0 | 0.0% |
| Black / African American | 0 | 0.0% |
| Hawaiian / Pacific | 0 | 0.0% |
| Hispanic or Latino | 135 | 1.7% |
| Native / Alaskan | 55 | 0.7% |
| White / Caucasian | 7,708 | 95.2% |
| Two or more Races | 316 | 3.9% |
| Some other Race | 19 | 0.2% |
| Total | 8,098 | 100.0% |
Ancestry in Whitefish
The most populous ancestries reported in Whitefish are German (2,053 | 25.4%), English (1,756 | 21.7%), Irish (872 | 10.8%), Norwegian (538 | 6.6%), and French (388 | 4.8%), together accounting for 69.2% of all Whitefish residents.
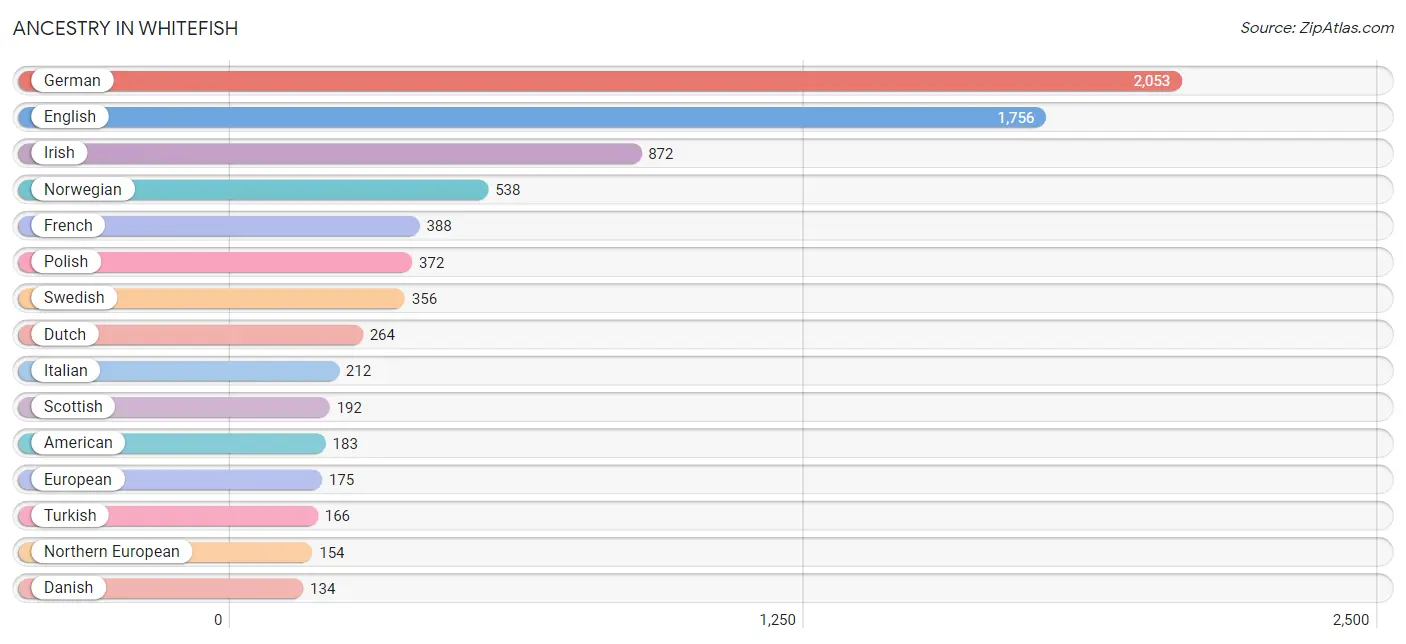
| Ancestry | # Population | % Population |
| American | 183 | 2.3% |
| Armenian | 45 | 0.6% |
| Austrian | 9 | 0.1% |
| Belgian | 84 | 1.0% |
| Blackfeet | 39 | 0.5% |
| British | 47 | 0.6% |
| Canadian | 12 | 0.2% |
| Chickasaw | 41 | 0.5% |
| Chippewa | 16 | 0.2% |
| Colombian | 73 | 0.9% |
| Czechoslovakian | 16 | 0.2% |
| Danish | 134 | 1.7% |
| Dutch | 264 | 3.3% |
| Eastern European | 4 | 0.1% |
| English | 1,756 | 21.7% |
| European | 175 | 2.2% |
| Finnish | 60 | 0.7% |
| French | 388 | 4.8% |
| French Canadian | 15 | 0.2% |
| German | 2,053 | 25.4% |
| German Russian | 7 | 0.1% |
| Hungarian | 83 | 1.0% |
| Irish | 872 | 10.8% |
| Italian | 212 | 2.6% |
| Lithuanian | 60 | 0.7% |
| Mexican | 26 | 0.3% |
| Native Hawaiian | 86 | 1.1% |
| Northern European | 154 | 1.9% |
| Norwegian | 538 | 6.6% |
| Polish | 372 | 4.6% |
| Portuguese | 30 | 0.4% |
| Puerto Rican | 9 | 0.1% |
| Russian | 108 | 1.3% |
| Scandinavian | 110 | 1.4% |
| Scotch-Irish | 59 | 0.7% |
| Scottish | 192 | 2.4% |
| Slovak | 9 | 0.1% |
| South American | 73 | 0.9% |
| Spaniard | 27 | 0.3% |
| Swedish | 356 | 4.4% |
| Swiss | 38 | 0.5% |
| Turkish | 166 | 2.1% |
| Welsh | 58 | 0.7% | View All 43 Rows |
Immigrants in Whitefish
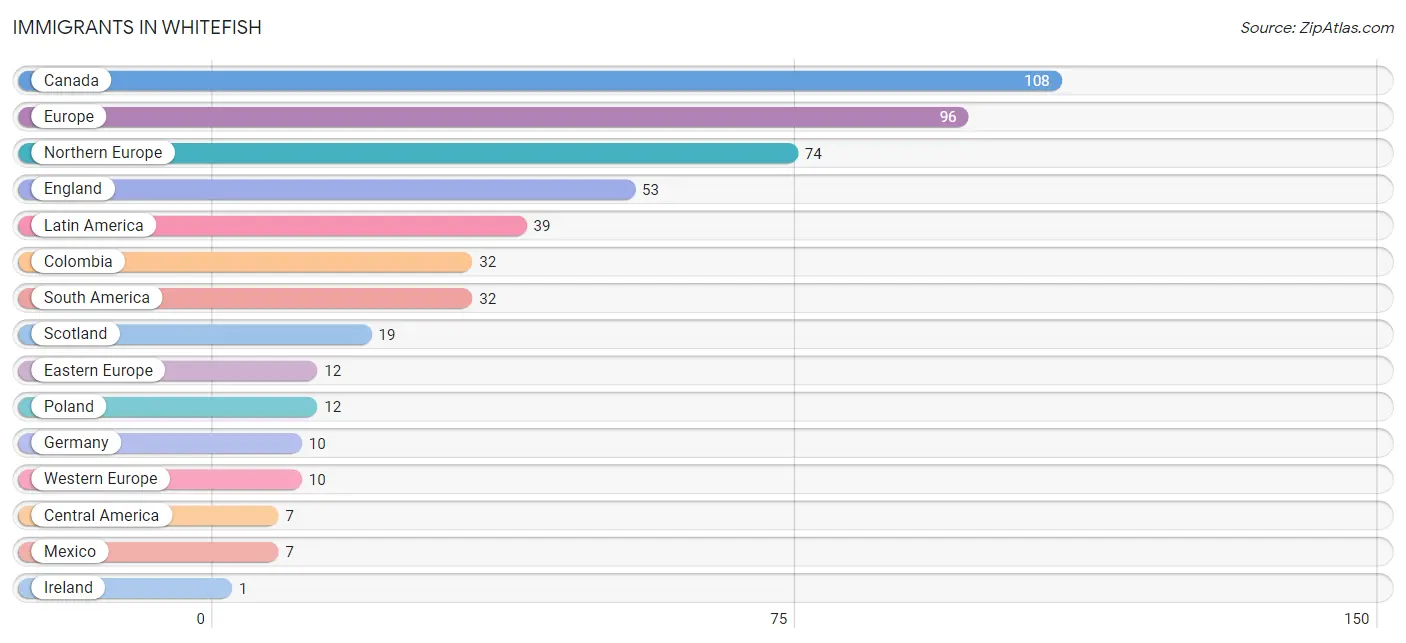
The most numerous immigrant groups reported in Whitefish came from Canada (108 | 1.3%), Europe (96 | 1.2%), Northern Europe (74 | 0.9%), England (53 | 0.6%), and Latin America (39 | 0.5%), together accounting for 4.6% of all Whitefish residents.
| Immigration Origin | # Population | % Population |
| Canada | 108 | 1.3% |
| Central America | 7 | 0.1% |
| Colombia | 32 | 0.4% |
| Eastern Europe | 12 | 0.2% |
| England | 53 | 0.6% |
| Europe | 96 | 1.2% |
| Germany | 10 | 0.1% |
| Ireland | 1 | 0.0% |
| Latin America | 39 | 0.5% |
| Mexico | 7 | 0.1% |
| Northern Europe | 74 | 0.9% |
| Poland | 12 | 0.2% |
| Scotland | 19 | 0.2% |
| South America | 32 | 0.4% |
| Western Europe | 10 | 0.1% | View All 15 Rows |
Sex and Age in Whitefish
Sex and Age in Whitefish
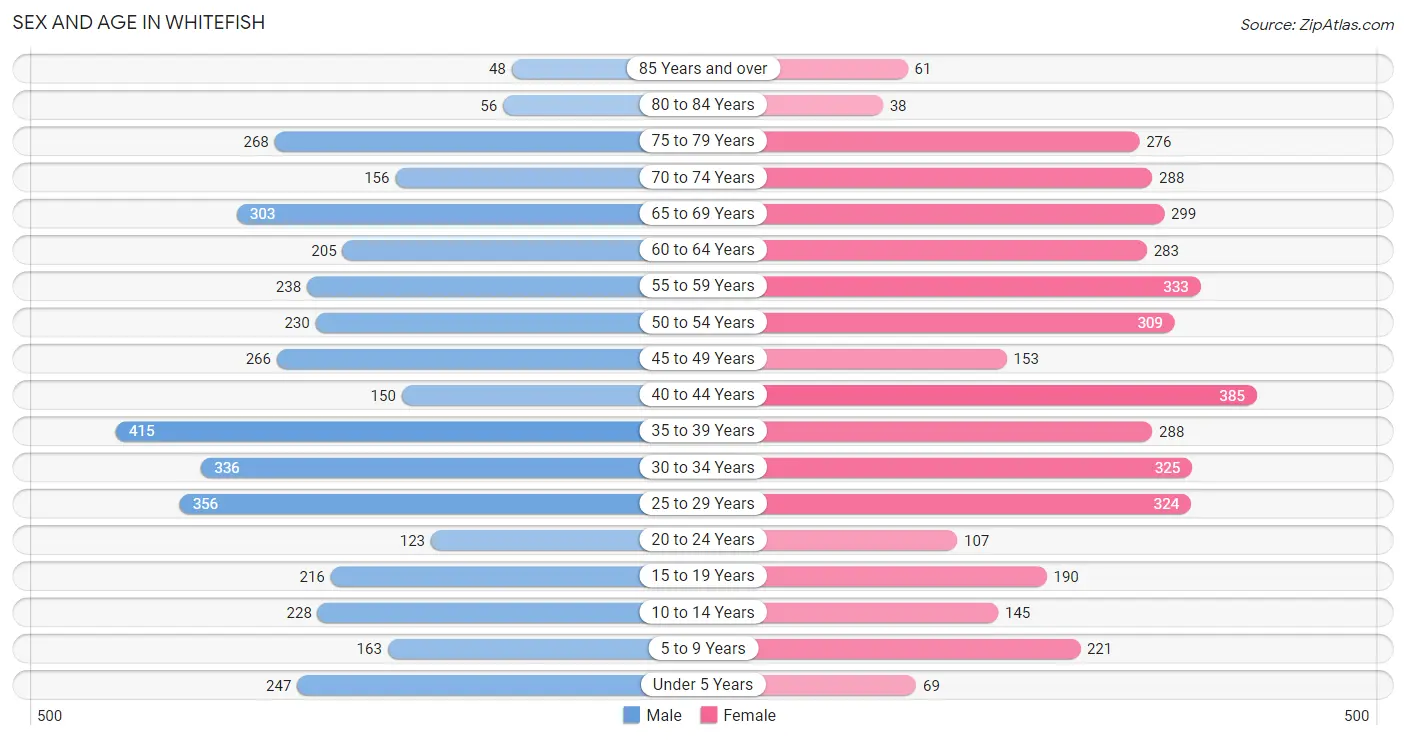
The most populous age groups in Whitefish are 35 to 39 Years (415 | 10.4%) for men and 40 to 44 Years (385 | 9.4%) for women.
| Age Bracket | Male | Female |
| Under 5 Years | 247 (6.2%) | 69 (1.7%) |
| 5 to 9 Years | 163 (4.1%) | 221 (5.4%) |
| 10 to 14 Years | 228 (5.7%) | 145 (3.5%) |
| 15 to 19 Years | 216 (5.4%) | 190 (4.6%) |
| 20 to 24 Years | 123 (3.1%) | 107 (2.6%) |
| 25 to 29 Years | 356 (8.9%) | 324 (7.9%) |
| 30 to 34 Years | 336 (8.4%) | 325 (7.9%) |
| 35 to 39 Years | 415 (10.4%) | 288 (7.0%) |
| 40 to 44 Years | 150 (3.7%) | 385 (9.4%) |
| 45 to 49 Years | 266 (6.6%) | 153 (3.7%) |
| 50 to 54 Years | 230 (5.7%) | 309 (7.5%) |
| 55 to 59 Years | 238 (5.9%) | 333 (8.1%) |
| 60 to 64 Years | 205 (5.1%) | 283 (6.9%) |
| 65 to 69 Years | 303 (7.6%) | 299 (7.3%) |
| 70 to 74 Years | 156 (3.9%) | 288 (7.0%) |
| 75 to 79 Years | 268 (6.7%) | 276 (6.7%) |
| 80 to 84 Years | 56 (1.4%) | 38 (0.9%) |
| 85 Years and over | 48 (1.2%) | 61 (1.5%) |
| Total | 4,004 (100.0%) | 4,094 (100.0%) |
Families and Households in Whitefish
Median Family Size in Whitefish
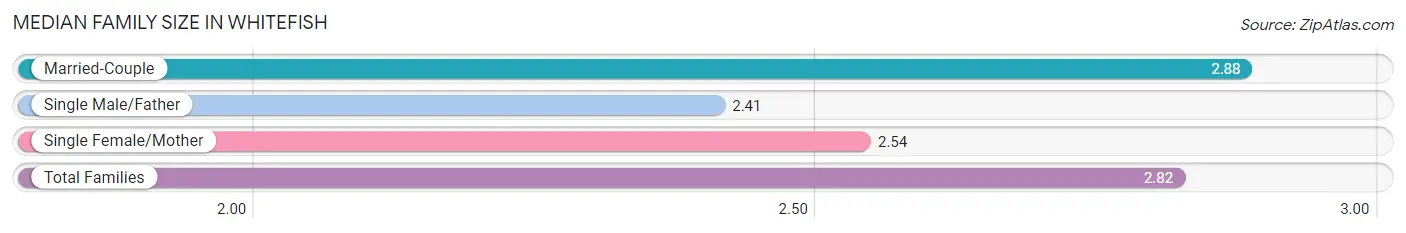
The median family size in Whitefish is 2.82 persons per family, with married-couple families (1,675 | 83.2%) accounting for the largest median family size of 2.88 persons per family. On the other hand, single male/father families (51 | 2.5%) represent the smallest median family size with 2.41 persons per family.
| Family Type | # Families | Family Size |
| Married-Couple | 1,675 (83.2%) | 2.88 |
| Single Male/Father | 51 (2.5%) | 2.41 |
| Single Female/Mother | 288 (14.3%) | 2.54 |
| Total Families | 2,014 (100.0%) | 2.82 |
Median Household Size in Whitefish
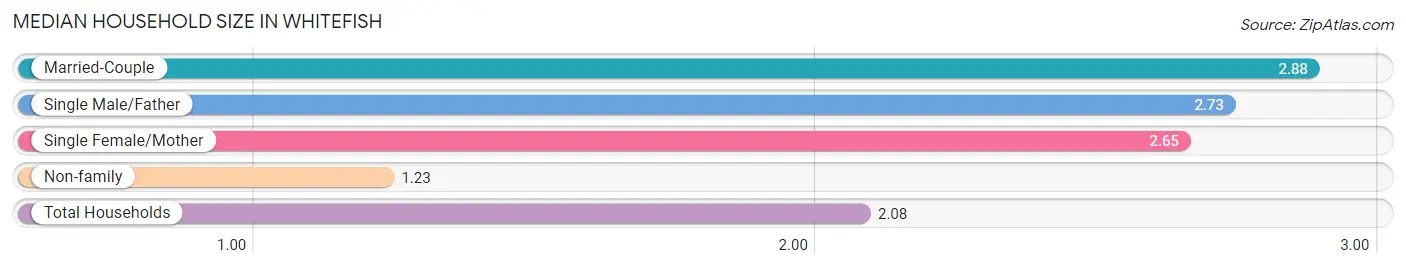
The median household size in Whitefish is 2.08 persons per household, with married-couple households (1,675 | 43.9%) accounting for the largest median household size of 2.88 persons per household. non-family households (1,803 | 47.2%) represent the smallest median household size with 1.23 persons per household.
| Household Type | # Households | Household Size |
| Married-Couple | 1,675 (43.9%) | 2.88 |
| Single Male/Father | 51 (1.3%) | 2.73 |
| Single Female/Mother | 288 (7.5%) | 2.65 |
| Non-family | 1,803 (47.2%) | 1.23 |
| Total Households | 3,817 (100.0%) | 2.08 |
Household Size by Marriage Status in Whitefish
Out of a total of 3,817 households in Whitefish, 2,014 (52.8%) are family households, while 1,803 (47.2%) are nonfamily households. The most numerous type of family households are 2-person households, comprising 1,137, and the most common type of nonfamily households are 1-person households, comprising 1,505.
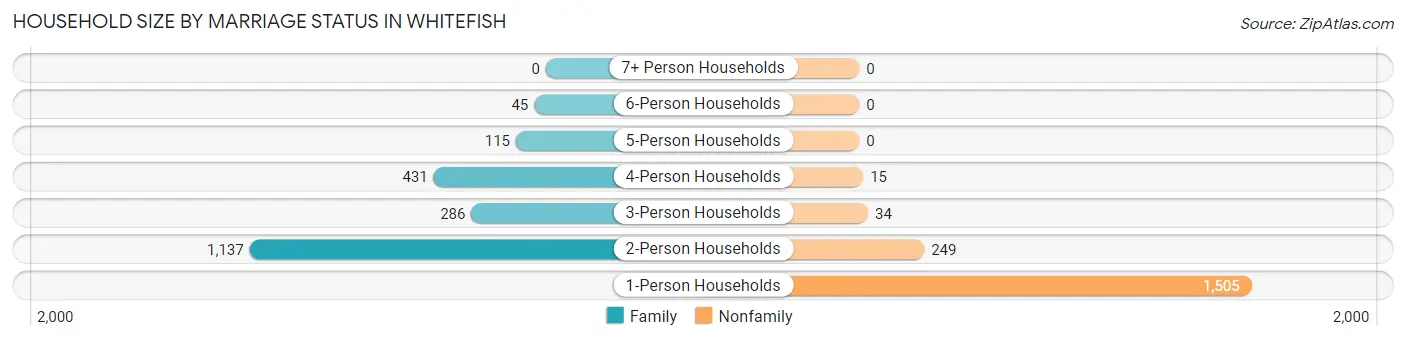
| Household Size | Family Households | Nonfamily Households |
| 1-Person Households | - | 1,505 (39.4%) |
| 2-Person Households | 1,137 (29.8%) | 249 (6.5%) |
| 3-Person Households | 286 (7.5%) | 34 (0.9%) |
| 4-Person Households | 431 (11.3%) | 15 (0.4%) |
| 5-Person Households | 115 (3.0%) | 0 (0.0%) |
| 6-Person Households | 45 (1.2%) | 0 (0.0%) |
| 7+ Person Households | 0 (0.0%) | 0 (0.0%) |
| Total | 2,014 (52.8%) | 1,803 (47.2%) |
Female Fertility in Whitefish
Fertility by Age in Whitefish
Average fertility rate in Whitefish is 70.0 births per 1,000 women. Women in the age bracket of 20 to 34 years have the highest fertility rate with 136.0 births per 1,000 women. Women in the age bracket of 20 to 34 years acount for 81.8% of all women with births.
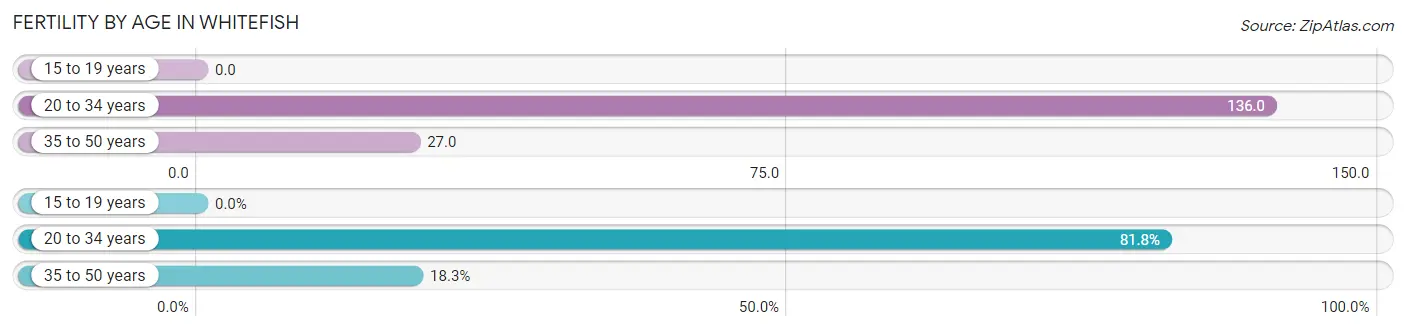
| Age Bracket | Women with Births | Births / 1,000 Women |
| 15 to 19 years | 0 (0.0%) | 0.0 |
| 20 to 34 years | 103 (81.8%) | 136.0 |
| 35 to 50 years | 23 (18.2%) | 27.0 |
| Total | 126 (100.0%) | 70.0 |
Fertility by Age by Marriage Status in Whitefish
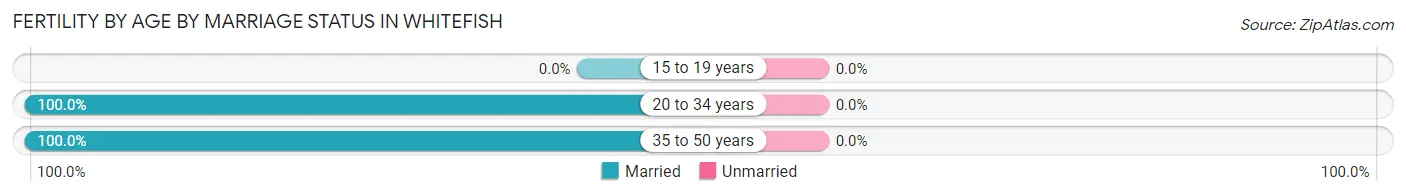
| Age Bracket | Married | Unmarried |
| 15 to 19 years | 0 (0.0%) | 0 (0.0%) |
| 20 to 34 years | 103 (100.0%) | 0 (0.0%) |
| 35 to 50 years | 23 (100.0%) | 0 (0.0%) |
| Total | 126 (100.0%) | 0 (0.0%) |
Fertility by Education in Whitefish
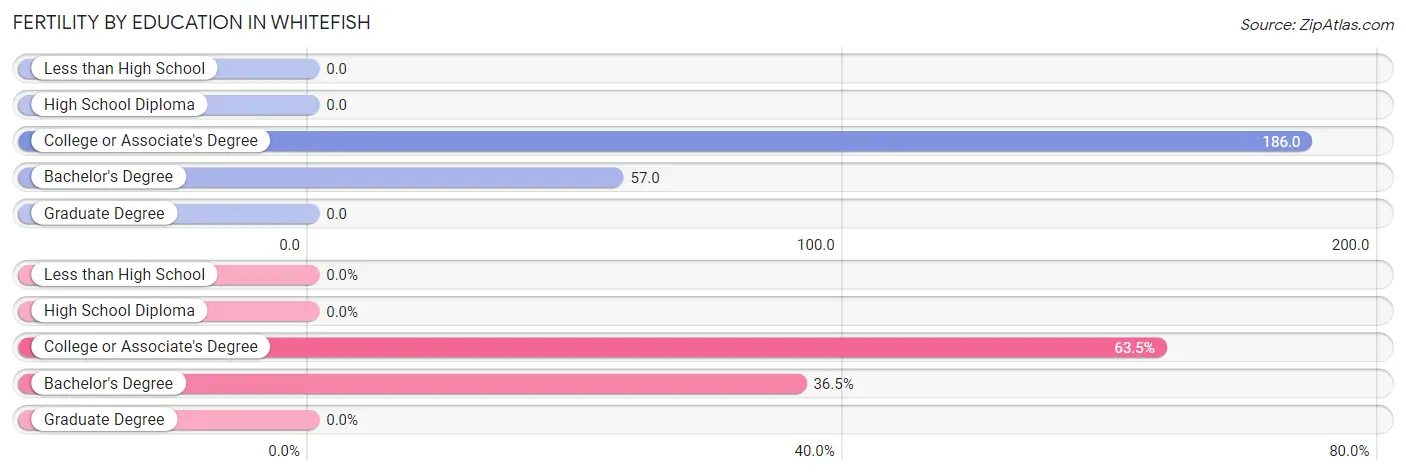
| Educational Attainment | Women with Births | Births / 1,000 Women |
| Less than High School | 0 (0.0%) | 0.0 |
| High School Diploma | 0 (0.0%) | 0.0 |
| College or Associate's Degree | 80 (63.5%) | 186.0 |
| Bachelor's Degree | 46 (36.5%) | 57.0 |
| Graduate Degree | 0 (0.0%) | 0.0 |
| Total | 126 (100.0%) | 70.0 |
Fertility by Education by Marriage Status in Whitefish
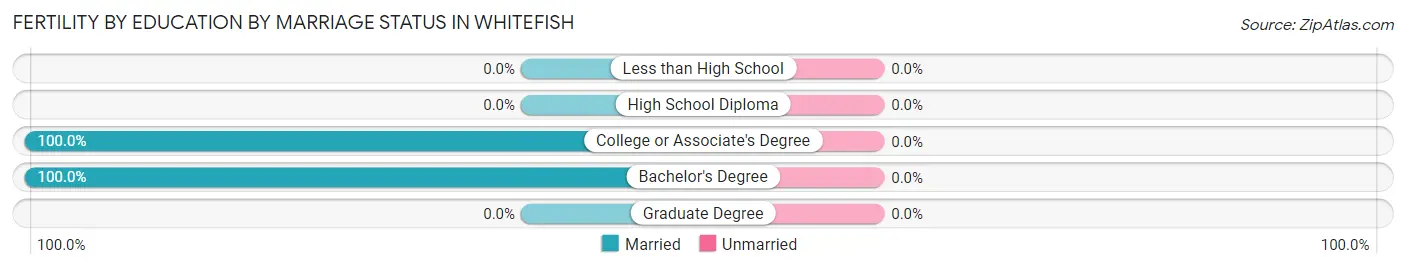
| Educational Attainment | Married | Unmarried |
| Less than High School | 0 (0.0%) | 0 (0.0%) |
| High School Diploma | 0 (0.0%) | 0 (0.0%) |
| College or Associate's Degree | 80 (100.0%) | 0 (0.0%) |
| Bachelor's Degree | 46 (100.0%) | 0 (0.0%) |
| Graduate Degree | 0 (0.0%) | 0 (0.0%) |
| Total | 126 (100.0%) | 0 (0.0%) |
Employment Characteristics in Whitefish
Employment by Class of Employer in Whitefish
Among the 4,536 employed individuals in Whitefish, private company employees (3,129 | 69.0%), self-employed (not incorporated) (424 | 9.3%), and not-for-profit organizations (351 | 7.7%) make up the most common classes of employment.
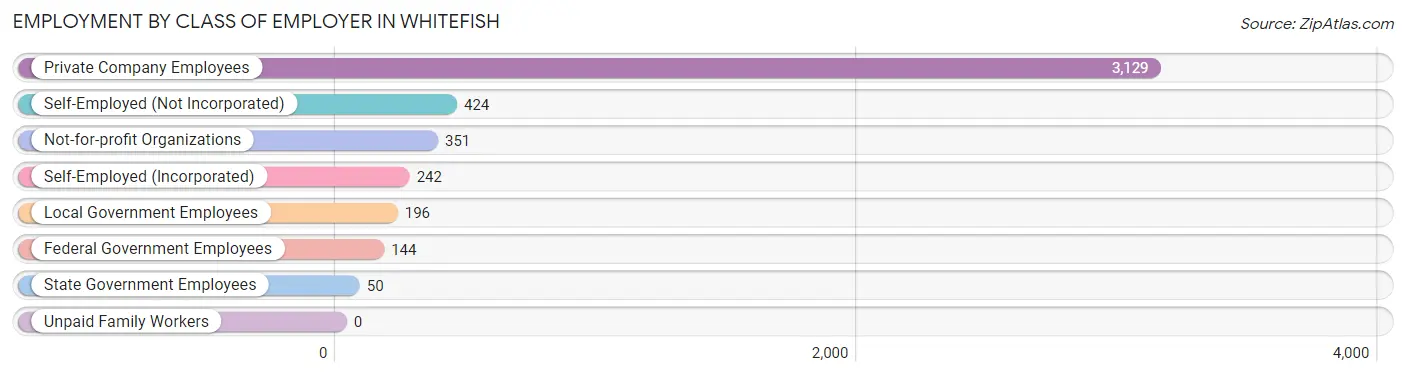
| Employer Class | # Employees | % Employees |
| Private Company Employees | 3,129 | 69.0% |
| Self-Employed (Incorporated) | 242 | 5.3% |
| Self-Employed (Not Incorporated) | 424 | 9.3% |
| Not-for-profit Organizations | 351 | 7.7% |
| Local Government Employees | 196 | 4.3% |
| State Government Employees | 50 | 1.1% |
| Federal Government Employees | 144 | 3.2% |
| Unpaid Family Workers | 0 | 0.0% |
| Total | 4,536 | 100.0% |
Employment Status by Age in Whitefish
According to the labor force statistics for Whitefish, out of the total population over 16 years of age (6,888), 68.4% or 4,711 individuals are in the labor force, with 2.5% or 118 of them unemployed. The age group with the highest labor force participation rate is 30 to 34 years, with 97.6% or 645 individuals in the labor force. Within the labor force, the 55 to 59 years age range has the highest percentage of unemployed individuals, with 14.5% or 64 of them being unemployed.
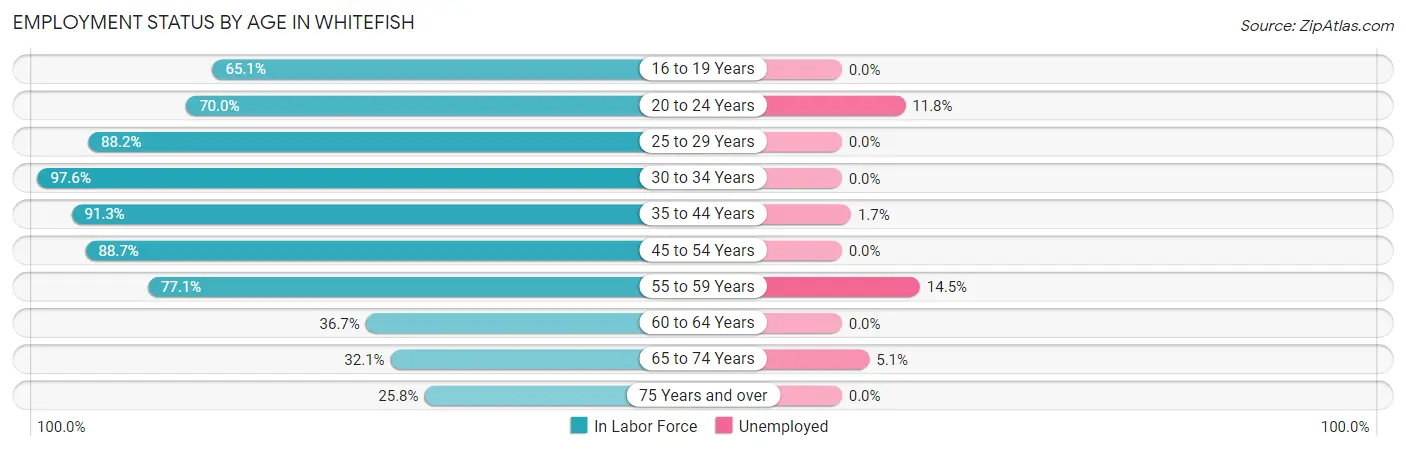
| Age Bracket | In Labor Force | Unemployed |
| 16 to 19 Years | 175 (65.1%) | 0 (0.0%) |
| 20 to 24 Years | 161 (70.0%) | 19 (11.8%) |
| 25 to 29 Years | 600 (88.2%) | 0 (0.0%) |
| 30 to 34 Years | 645 (97.6%) | 0 (0.0%) |
| 35 to 44 Years | 1,130 (91.3%) | 19 (1.7%) |
| 45 to 54 Years | 850 (88.7%) | 0 (0.0%) |
| 55 to 59 Years | 440 (77.1%) | 64 (14.5%) |
| 60 to 64 Years | 179 (36.7%) | 0 (0.0%) |
| 65 to 74 Years | 336 (32.1%) | 17 (5.1%) |
| 75 Years and over | 193 (25.8%) | 0 (0.0%) |
| Total | 4,711 (68.4%) | 118 (2.5%) |
Employment Status by Educational Attainment in Whitefish
According to labor force statistics for Whitefish, 83.6% of individuals (3,842) out of the total population between 25 and 64 years of age (4,596) are in the labor force, with 2.2% or 85 of them being unemployed. The group with the highest labor force participation rate are those with the educational attainment of bachelor's degree or higher, with 85.1% or 2,476 individuals in the labor force. Within the labor force, individuals with high school diploma education have the highest percentage of unemployment, with 3.7% or 19 of them being unemployed.
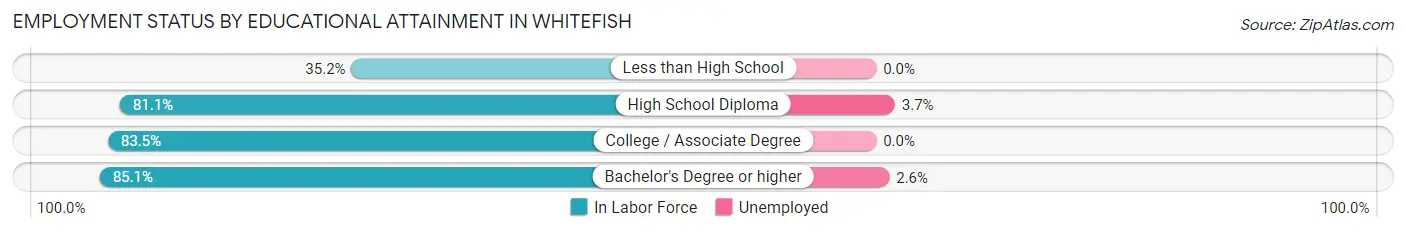
| Educational Attainment | In Labor Force | Unemployed |
| Less than High School | 19 (35.2%) | 0 (0.0%) |
| High School Diploma | 511 (81.1%) | 23 (3.7%) |
| College / Associate Degree | 838 (83.5%) | 0 (0.0%) |
| Bachelor's Degree or higher | 2,476 (85.1%) | 76 (2.6%) |
| Total | 3,842 (83.6%) | 101 (2.2%) |
Employment Occupations by Sex in Whitefish
Management, Business, Science and Arts Occupations
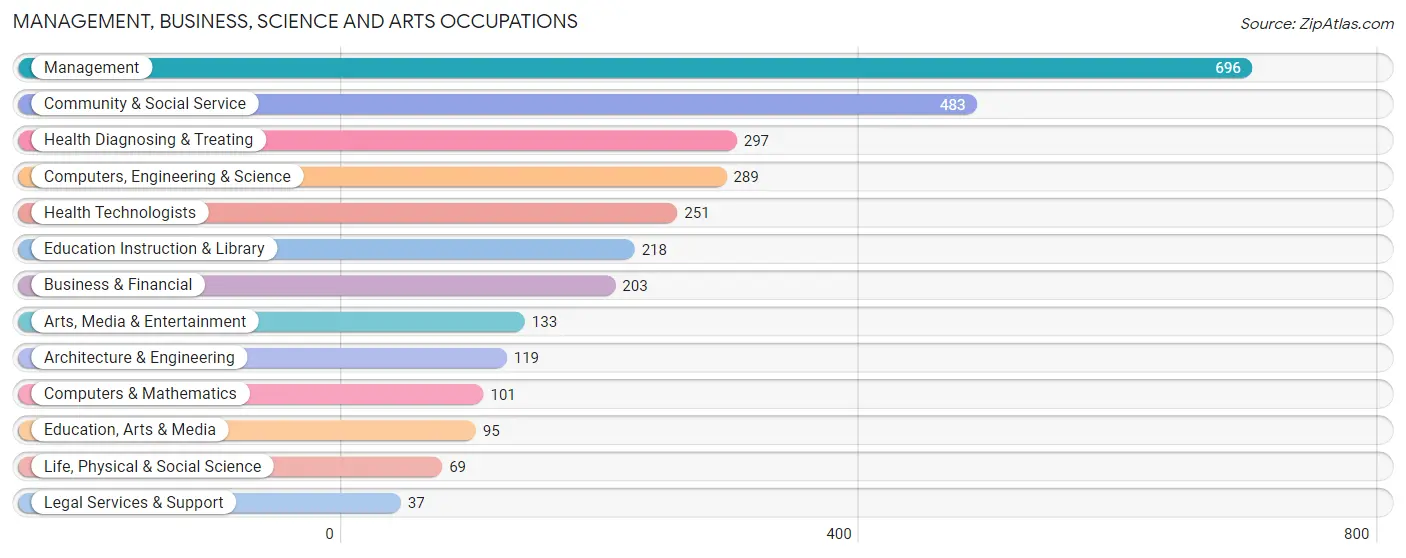
The most common Management, Business, Science and Arts occupations in Whitefish are Management (696 | 15.2%), Community & Social Service (483 | 10.5%), Health Diagnosing & Treating (297 | 6.5%), Computers, Engineering & Science (289 | 6.3%), and Health Technologists (251 | 5.5%).
Management, Business, Science and Arts Occupations by Sex
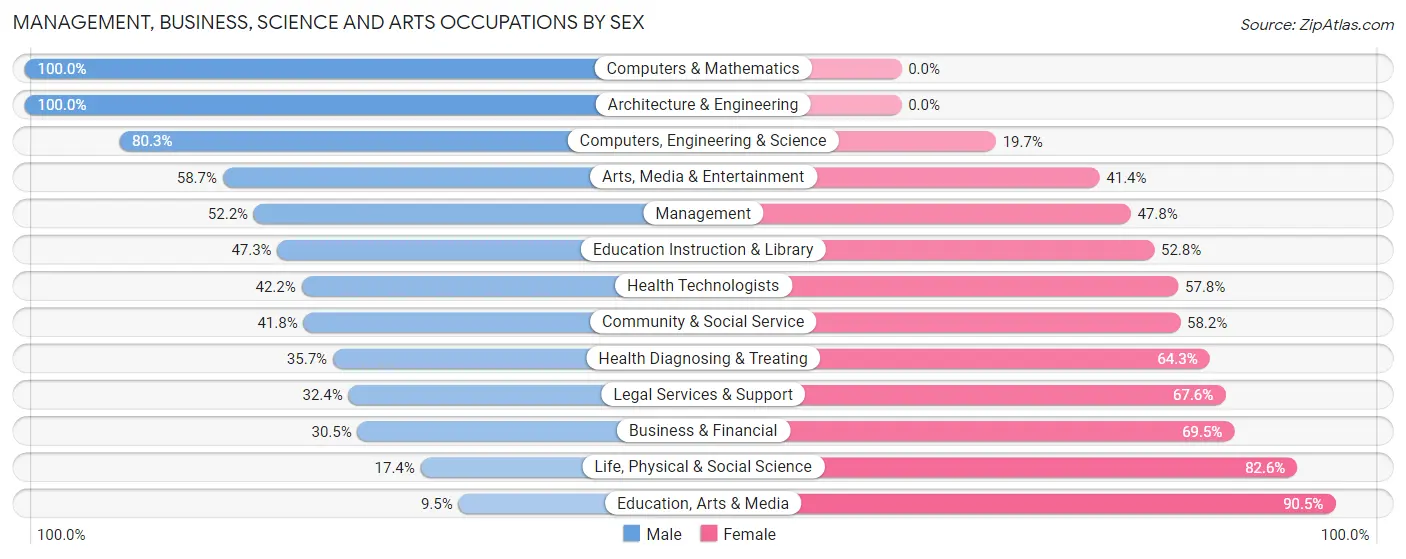
Within the Management, Business, Science and Arts occupations in Whitefish, the most male-oriented occupations are Computers & Mathematics (100.0%), Architecture & Engineering (100.0%), and Computers, Engineering & Science (80.3%), while the most female-oriented occupations are Education, Arts & Media (90.5%), Life, Physical & Social Science (82.6%), and Business & Financial (69.5%).
| Occupation | Male | Female |
| Management | 363 (52.2%) | 333 (47.8%) |
| Business & Financial | 62 (30.5%) | 141 (69.5%) |
| Computers, Engineering & Science | 232 (80.3%) | 57 (19.7%) |
| Computers & Mathematics | 101 (100.0%) | 0 (0.0%) |
| Architecture & Engineering | 119 (100.0%) | 0 (0.0%) |
| Life, Physical & Social Science | 12 (17.4%) | 57 (82.6%) |
| Community & Social Service | 202 (41.8%) | 281 (58.2%) |
| Education, Arts & Media | 9 (9.5%) | 86 (90.5%) |
| Legal Services & Support | 12 (32.4%) | 25 (67.6%) |
| Education Instruction & Library | 103 (47.2%) | 115 (52.7%) |
| Arts, Media & Entertainment | 78 (58.7%) | 55 (41.3%) |
| Health Diagnosing & Treating | 106 (35.7%) | 191 (64.3%) |
| Health Technologists | 106 (42.2%) | 145 (57.8%) |
| Total (Category) | 965 (49.0%) | 1,003 (51.0%) |
| Total (Overall) | 2,247 (48.9%) | 2,343 (51.0%) |
Services Occupations
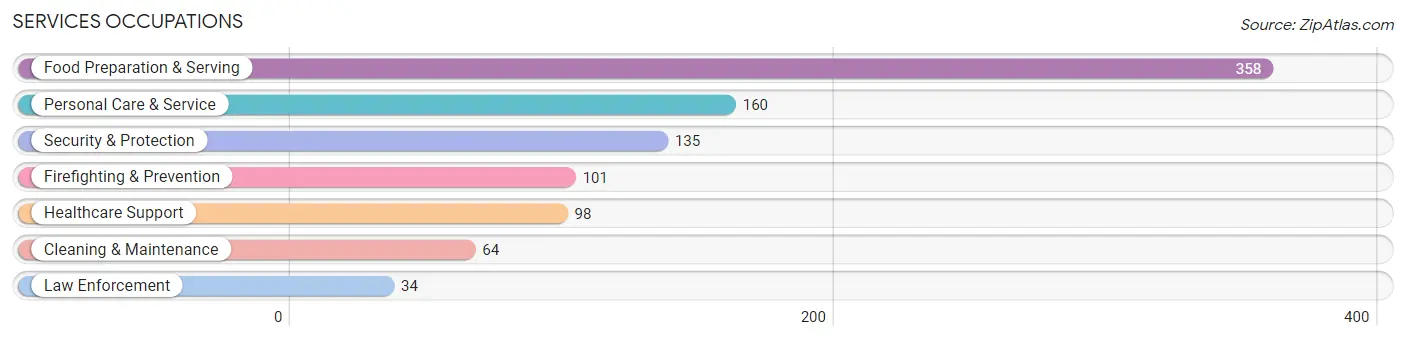
The most common Services occupations in Whitefish are Food Preparation & Serving (358 | 7.8%), Personal Care & Service (160 | 3.5%), Security & Protection (135 | 2.9%), Firefighting & Prevention (101 | 2.2%), and Healthcare Support (98 | 2.1%).
Services Occupations by Sex
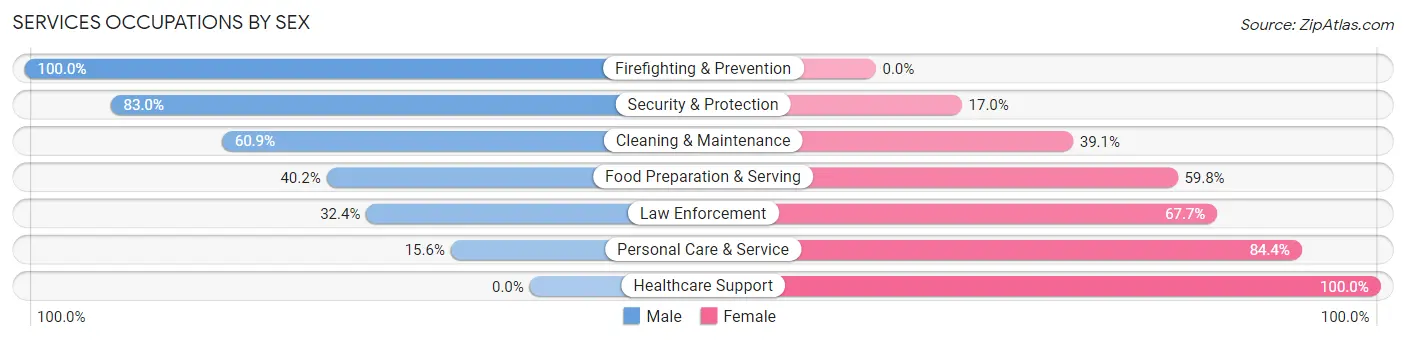
Within the Services occupations in Whitefish, the most male-oriented occupations are Firefighting & Prevention (100.0%), Security & Protection (83.0%), and Cleaning & Maintenance (60.9%), while the most female-oriented occupations are Healthcare Support (100.0%), Personal Care & Service (84.4%), and Law Enforcement (67.6%).
| Occupation | Male | Female |
| Healthcare Support | 0 (0.0%) | 98 (100.0%) |
| Security & Protection | 112 (83.0%) | 23 (17.0%) |
| Firefighting & Prevention | 101 (100.0%) | 0 (0.0%) |
| Law Enforcement | 11 (32.4%) | 23 (67.6%) |
| Food Preparation & Serving | 144 (40.2%) | 214 (59.8%) |
| Cleaning & Maintenance | 39 (60.9%) | 25 (39.1%) |
| Personal Care & Service | 25 (15.6%) | 135 (84.4%) |
| Total (Category) | 320 (39.3%) | 495 (60.7%) |
| Total (Overall) | 2,247 (48.9%) | 2,343 (51.0%) |
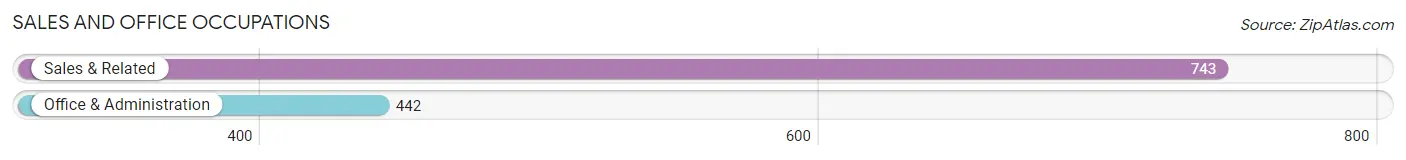
Sales and Office Occupations
The most common Sales and Office occupations in Whitefish are Sales & Related (743 | 16.2%), and Office & Administration (442 | 9.6%).
Sales and Office Occupations by Sex
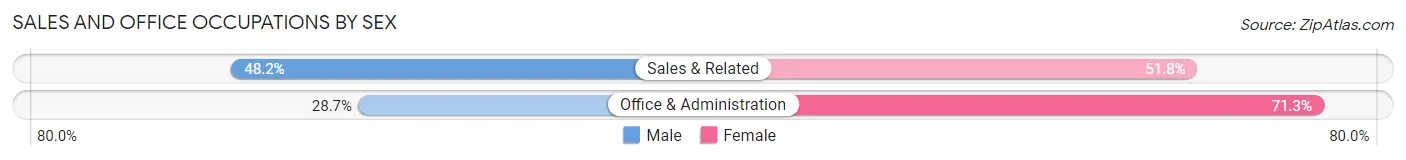
| Occupation | Male | Female |
| Sales & Related | 358 (48.2%) | 385 (51.8%) |
| Office & Administration | 127 (28.7%) | 315 (71.3%) |
| Total (Category) | 485 (40.9%) | 700 (59.1%) |
| Total (Overall) | 2,247 (48.9%) | 2,343 (51.0%) |
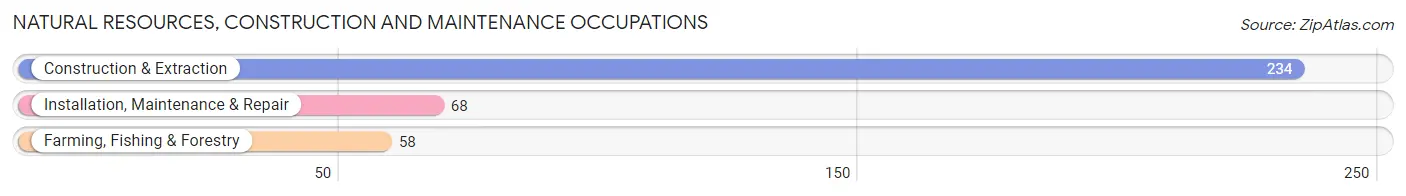
Natural Resources, Construction and Maintenance Occupations
The most common Natural Resources, Construction and Maintenance occupations in Whitefish are Construction & Extraction (234 | 5.1%), Installation, Maintenance & Repair (68 | 1.5%), and Farming, Fishing & Forestry (58 | 1.3%).
Natural Resources, Construction and Maintenance Occupations by Sex
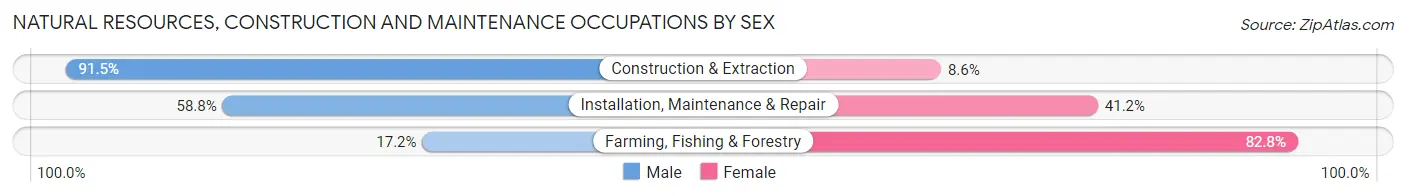
| Occupation | Male | Female |
| Farming, Fishing & Forestry | 10 (17.2%) | 48 (82.8%) |
| Construction & Extraction | 214 (91.4%) | 20 (8.6%) |
| Installation, Maintenance & Repair | 40 (58.8%) | 28 (41.2%) |
| Total (Category) | 264 (73.3%) | 96 (26.7%) |
| Total (Overall) | 2,247 (48.9%) | 2,343 (51.0%) |
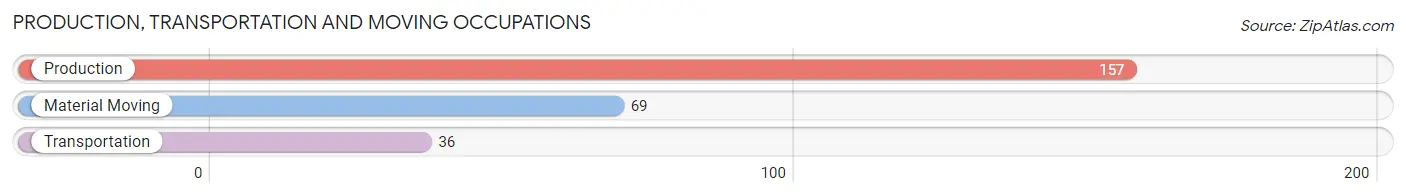
Production, Transportation and Moving Occupations
The most common Production, Transportation and Moving occupations in Whitefish are Production (157 | 3.4%), Material Moving (69 | 1.5%), and Transportation (36 | 0.8%).
Production, Transportation and Moving Occupations by Sex
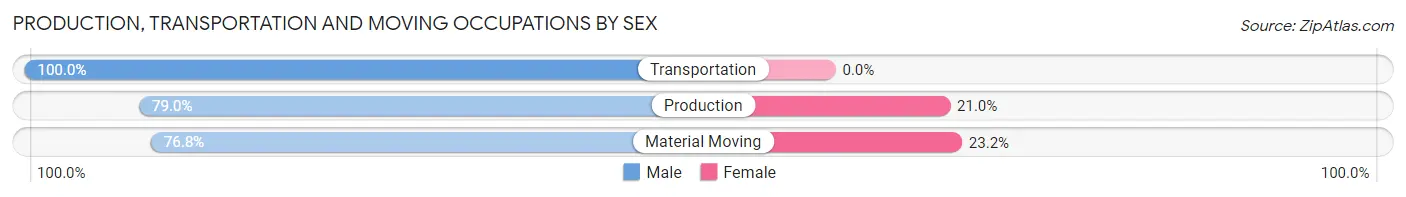
| Occupation | Male | Female |
| Production | 124 (79.0%) | 33 (21.0%) |
| Transportation | 36 (100.0%) | 0 (0.0%) |
| Material Moving | 53 (76.8%) | 16 (23.2%) |
| Total (Category) | 213 (81.3%) | 49 (18.7%) |
| Total (Overall) | 2,247 (48.9%) | 2,343 (51.0%) |
Employment Industries by Sex in Whitefish
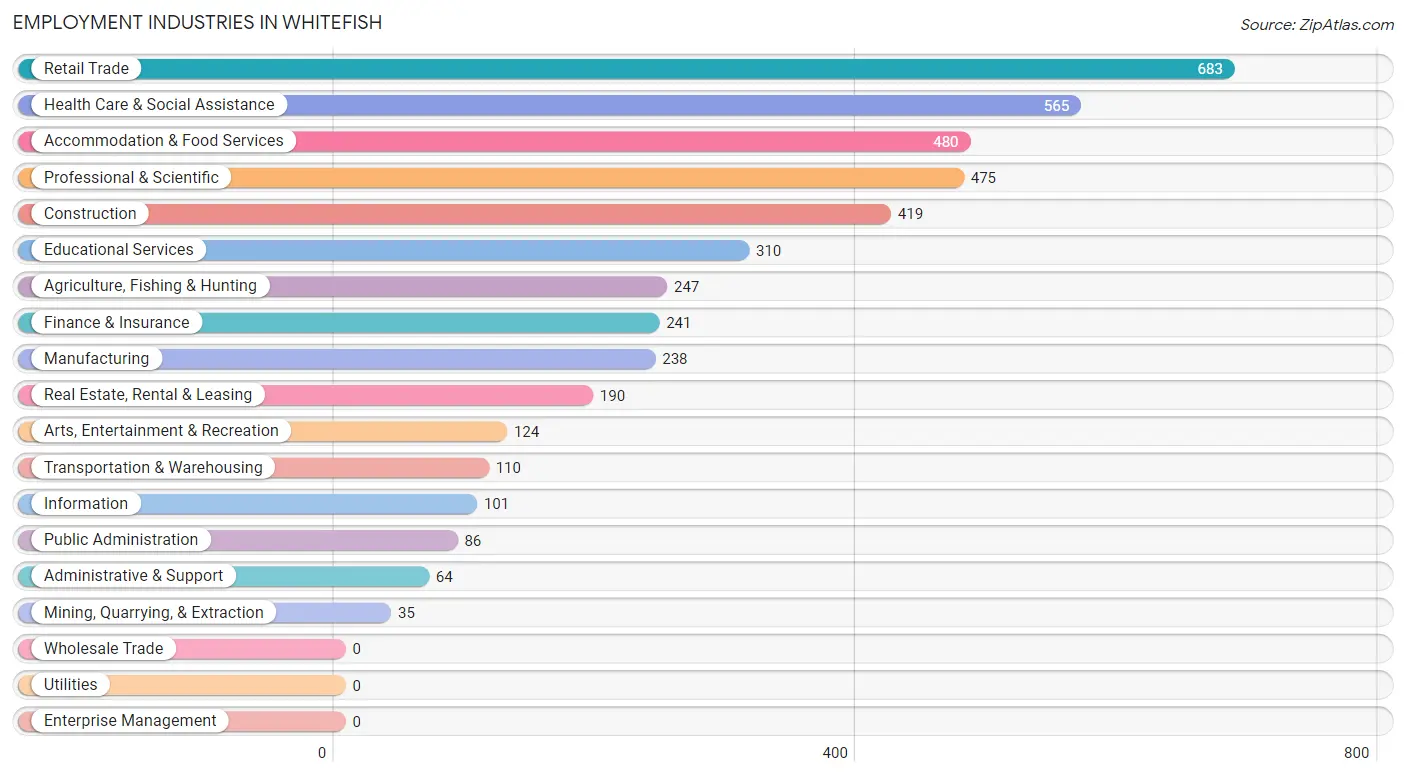
Employment Industries in Whitefish
The major employment industries in Whitefish include Retail Trade (683 | 14.9%), Health Care & Social Assistance (565 | 12.3%), Accommodation & Food Services (480 | 10.5%), Professional & Scientific (475 | 10.3%), and Construction (419 | 9.1%).
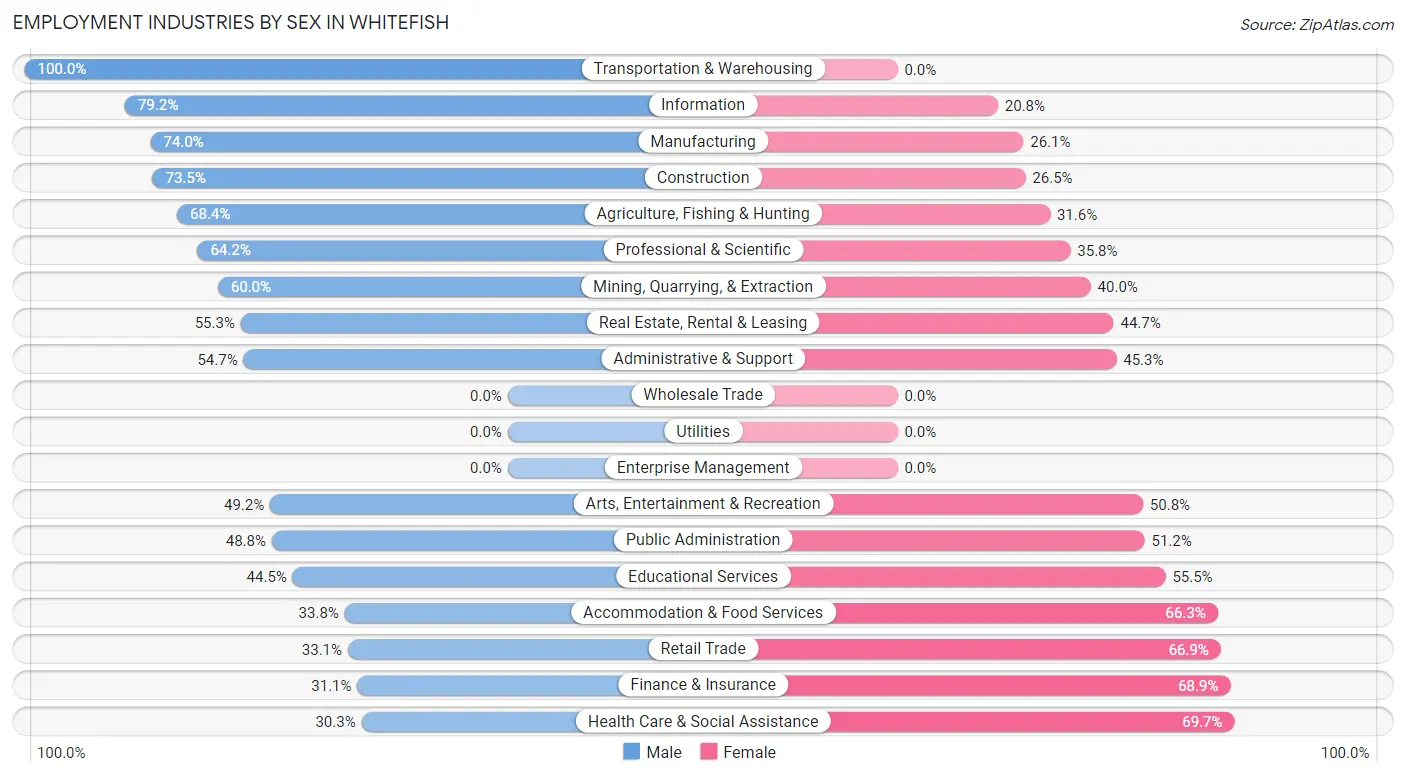
Employment Industries by Sex in Whitefish
The Whitefish industries that see more men than women are Transportation & Warehousing (100.0%), Information (79.2%), and Manufacturing (74.0%), whereas the industries that tend to have a higher number of women are Health Care & Social Assistance (69.7%), Finance & Insurance (68.9%), and Retail Trade (66.9%).
| Industry | Male | Female |
| Agriculture, Fishing & Hunting | 169 (68.4%) | 78 (31.6%) |
| Mining, Quarrying, & Extraction | 21 (60.0%) | 14 (40.0%) |
| Construction | 308 (73.5%) | 111 (26.5%) |
| Manufacturing | 176 (74.0%) | 62 (26.1%) |
| Wholesale Trade | 0 (0.0%) | 0 (0.0%) |
| Retail Trade | 226 (33.1%) | 457 (66.9%) |
| Transportation & Warehousing | 110 (100.0%) | 0 (0.0%) |
| Utilities | 0 (0.0%) | 0 (0.0%) |
| Information | 80 (79.2%) | 21 (20.8%) |
| Finance & Insurance | 75 (31.1%) | 166 (68.9%) |
| Real Estate, Rental & Leasing | 105 (55.3%) | 85 (44.7%) |
| Professional & Scientific | 305 (64.2%) | 170 (35.8%) |
| Enterprise Management | 0 (0.0%) | 0 (0.0%) |
| Administrative & Support | 35 (54.7%) | 29 (45.3%) |
| Educational Services | 138 (44.5%) | 172 (55.5%) |
| Health Care & Social Assistance | 171 (30.3%) | 394 (69.7%) |
| Arts, Entertainment & Recreation | 61 (49.2%) | 63 (50.8%) |
| Accommodation & Food Services | 162 (33.8%) | 318 (66.2%) |
| Public Administration | 42 (48.8%) | 44 (51.2%) |
| Total | 2,247 (48.9%) | 2,343 (51.0%) |
Education in Whitefish
School Enrollment in Whitefish
The most common levels of schooling among the 1,448 students in Whitefish are high school (377 | 26.0%), elementary school (308 | 21.3%), and middle school (303 | 20.9%).
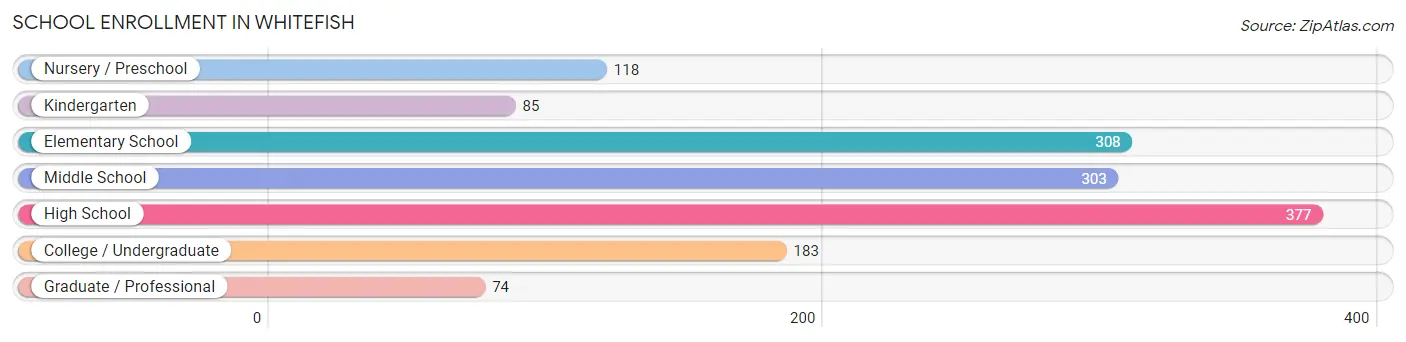
| School Level | # Students | % Students |
| Nursery / Preschool | 118 | 8.2% |
| Kindergarten | 85 | 5.9% |
| Elementary School | 308 | 21.3% |
| Middle School | 303 | 20.9% |
| High School | 377 | 26.0% |
| College / Undergraduate | 183 | 12.6% |
| Graduate / Professional | 74 | 5.1% |
| Total | 1,448 | 100.0% |
School Enrollment by Age by Funding Source in Whitefish
Out of a total of 1,448 students who are enrolled in schools in Whitefish, 236 (16.3%) attend a private institution, while the remaining 1,212 (83.7%) are enrolled in public schools. The age group of 3 to 4 year olds has the highest likelihood of being enrolled in private schools, with 77 (78.6% in the age bracket) enrolled. Conversely, the age group of 18 to 19 year olds has the lowest likelihood of being enrolled in a private school, with 87 (100.0% in the age bracket) attending a public institution.
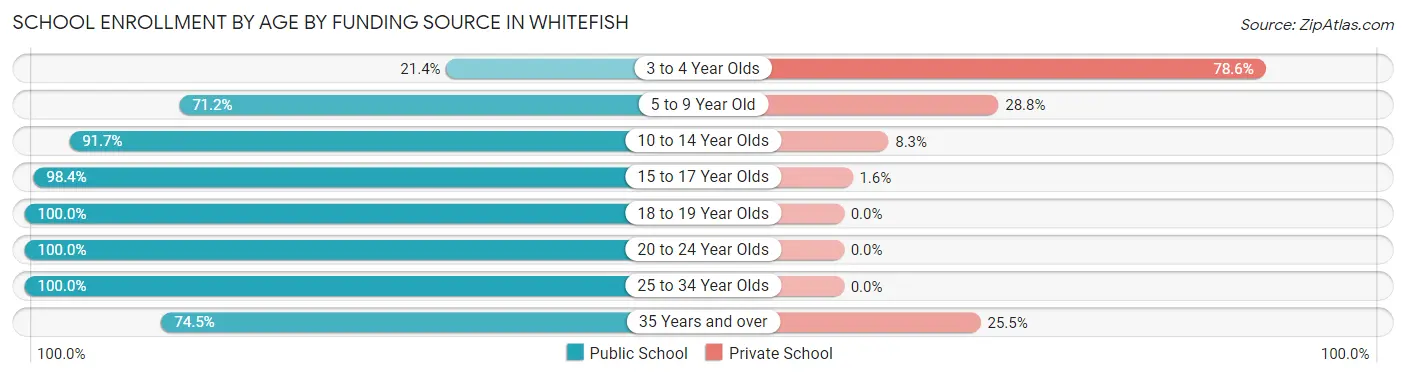
| Age Bracket | Public School | Private School |
| 3 to 4 Year Olds | 21 (21.4%) | 77 (78.6%) |
| 5 to 9 Year Old | 272 (71.2%) | 110 (28.8%) |
| 10 to 14 Year Olds | 342 (91.7%) | 31 (8.3%) |
| 15 to 17 Year Olds | 299 (98.4%) | 5 (1.6%) |
| 18 to 19 Year Olds | 87 (100.0%) | 0 (0.0%) |
| 20 to 24 Year Olds | 151 (100.0%) | 0 (0.0%) |
| 25 to 34 Year Olds | 2 (100.0%) | 0 (0.0%) |
| 35 Years and over | 38 (74.5%) | 13 (25.5%) |
| Total | 1,212 (83.7%) | 236 (16.3%) |
Educational Attainment by Field of Study in Whitefish
Business (725 | 19.1%), science & technology (407 | 10.7%), social sciences (362 | 9.5%), education (352 | 9.3%), and bio, nature & agricultural (343 | 9.0%) are the most common fields of study among 3,797 individuals in Whitefish who have obtained a bachelor's degree or higher.
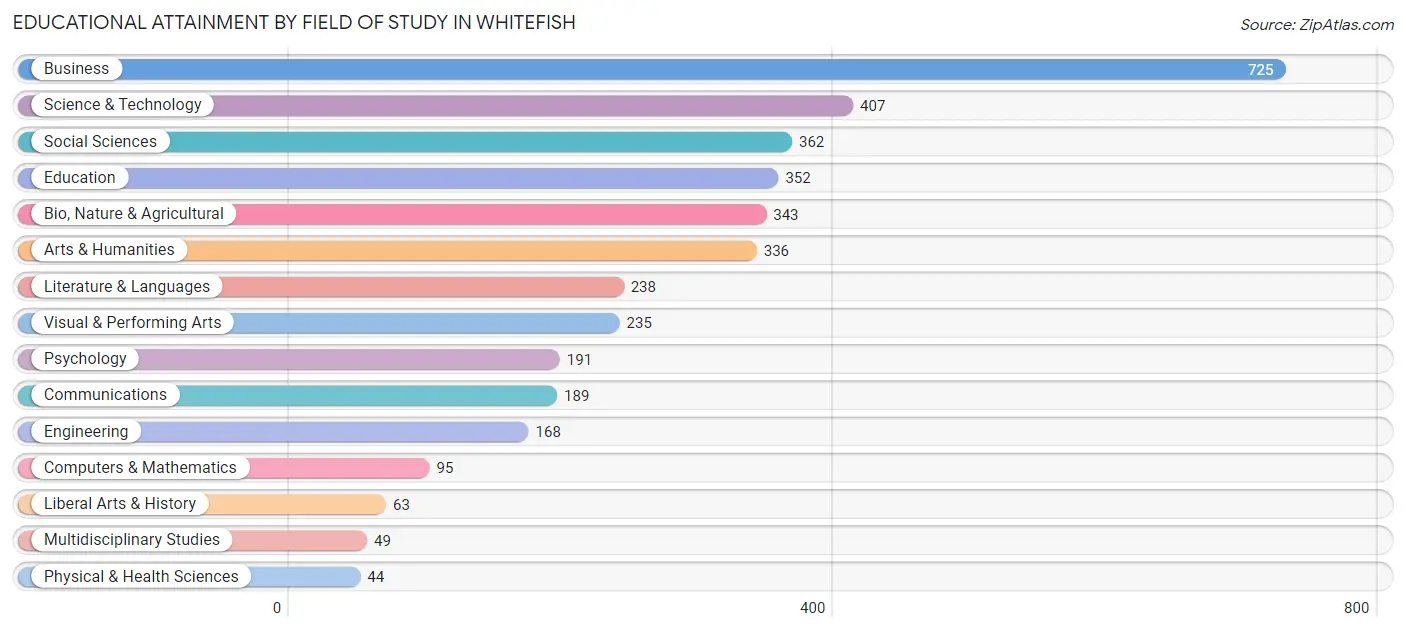
| Field of Study | # Graduates | % Graduates |
| Computers & Mathematics | 95 | 2.5% |
| Bio, Nature & Agricultural | 343 | 9.0% |
| Physical & Health Sciences | 44 | 1.2% |
| Psychology | 191 | 5.0% |
| Social Sciences | 362 | 9.5% |
| Engineering | 168 | 4.4% |
| Multidisciplinary Studies | 49 | 1.3% |
| Science & Technology | 407 | 10.7% |
| Business | 725 | 19.1% |
| Education | 352 | 9.3% |
| Literature & Languages | 238 | 6.3% |
| Liberal Arts & History | 63 | 1.7% |
| Visual & Performing Arts | 235 | 6.2% |
| Communications | 189 | 5.0% |
| Arts & Humanities | 336 | 8.8% |
| Total | 3,797 | 100.0% |
Transportation & Commute in Whitefish
Vehicle Availability by Sex in Whitefish
The most prevalent vehicle ownership categories in Whitefish are males with 2 vehicles (1,004, accounting for 45.1%) and females with 2 vehicles (1,001, making up 43.5%).
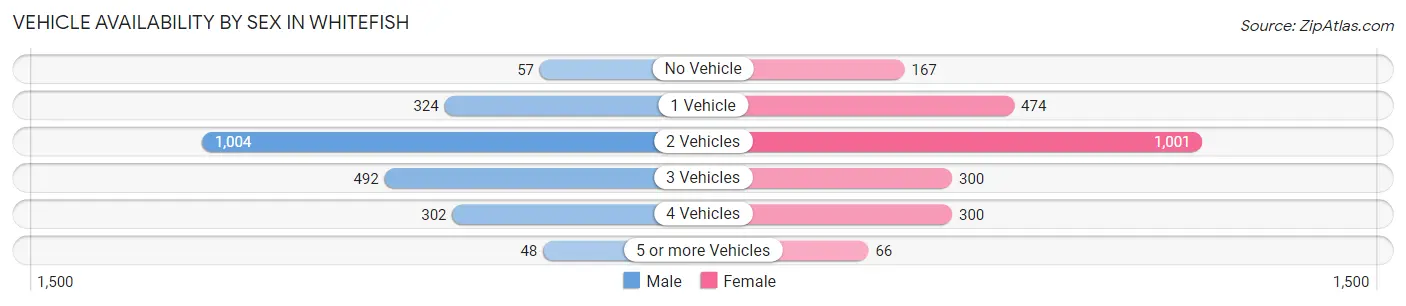
| Vehicles Available | Male | Female |
| No Vehicle | 57 (2.6%) | 167 (7.2%) |
| 1 Vehicle | 324 (14.5%) | 474 (20.5%) |
| 2 Vehicles | 1,004 (45.1%) | 1,001 (43.4%) |
| 3 Vehicles | 492 (22.1%) | 300 (13.0%) |
| 4 Vehicles | 302 (13.6%) | 300 (13.0%) |
| 5 or more Vehicles | 48 (2.2%) | 66 (2.9%) |
| Total | 2,227 (100.0%) | 2,308 (100.0%) |
Commute Time in Whitefish
The most frequently occuring commute durations in Whitefish are 5 to 9 minutes (1,198 commuters, 33.5%), 10 to 14 minutes (599 commuters, 16.8%), and 20 to 24 minutes (502 commuters, 14.0%).
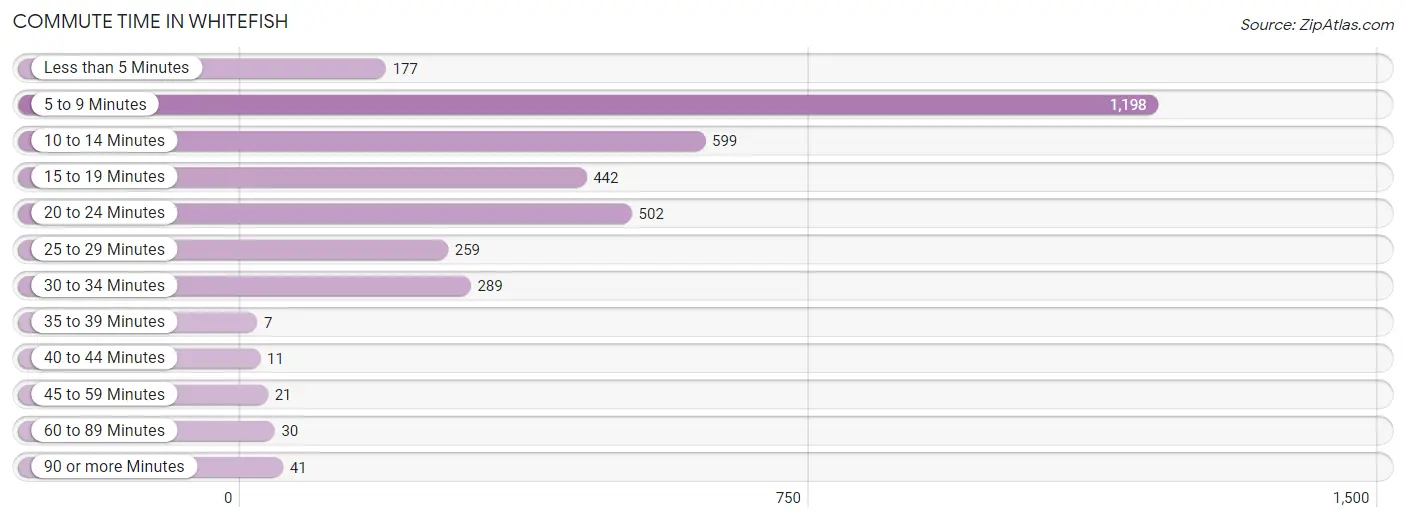
| Commute Time | # Commuters | % Commuters |
| Less than 5 Minutes | 177 | 5.0% |
| 5 to 9 Minutes | 1,198 | 33.5% |
| 10 to 14 Minutes | 599 | 16.8% |
| 15 to 19 Minutes | 442 | 12.4% |
| 20 to 24 Minutes | 502 | 14.0% |
| 25 to 29 Minutes | 259 | 7.2% |
| 30 to 34 Minutes | 289 | 8.1% |
| 35 to 39 Minutes | 7 | 0.2% |
| 40 to 44 Minutes | 11 | 0.3% |
| 45 to 59 Minutes | 21 | 0.6% |
| 60 to 89 Minutes | 30 | 0.8% |
| 90 or more Minutes | 41 | 1.1% |
Commute Time by Sex in Whitefish
The most common commute times in Whitefish are 5 to 9 minutes (494 commuters, 28.5%) for males and 5 to 9 minutes (704 commuters, 38.3%) for females.
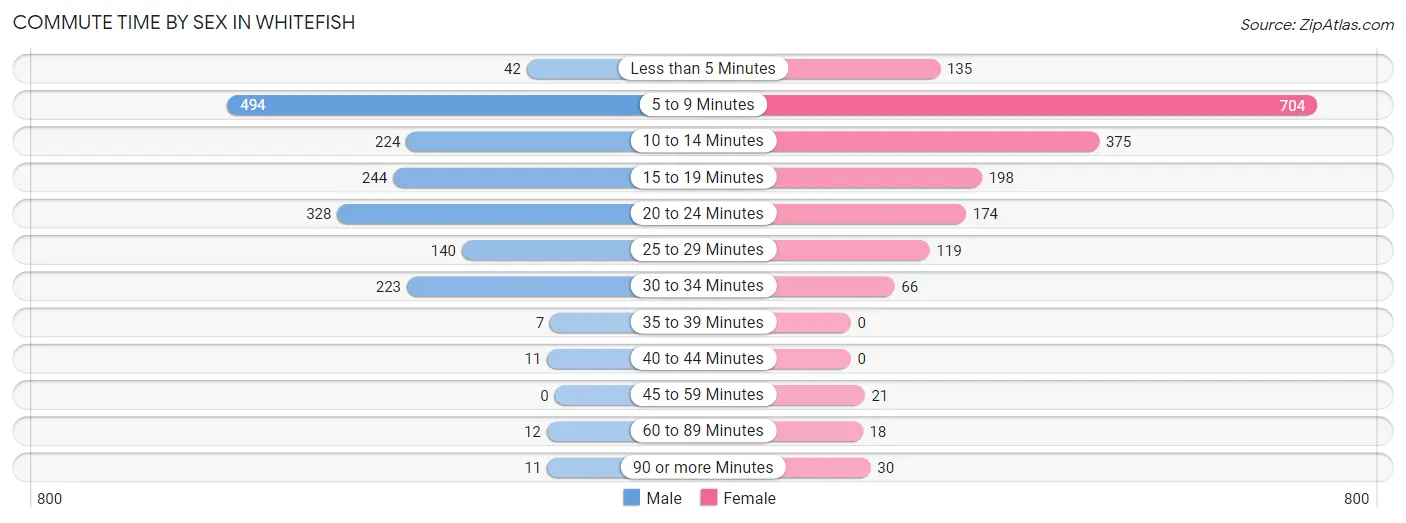
| Commute Time | Male | Female |
| Less than 5 Minutes | 42 (2.4%) | 135 (7.3%) |
| 5 to 9 Minutes | 494 (28.5%) | 704 (38.3%) |
| 10 to 14 Minutes | 224 (12.9%) | 375 (20.4%) |
| 15 to 19 Minutes | 244 (14.1%) | 198 (10.8%) |
| 20 to 24 Minutes | 328 (18.9%) | 174 (9.5%) |
| 25 to 29 Minutes | 140 (8.1%) | 119 (6.5%) |
| 30 to 34 Minutes | 223 (12.9%) | 66 (3.6%) |
| 35 to 39 Minutes | 7 (0.4%) | 0 (0.0%) |
| 40 to 44 Minutes | 11 (0.6%) | 0 (0.0%) |
| 45 to 59 Minutes | 0 (0.0%) | 21 (1.1%) |
| 60 to 89 Minutes | 12 (0.7%) | 18 (1.0%) |
| 90 or more Minutes | 11 (0.6%) | 30 (1.6%) |
Time of Departure to Work by Sex in Whitefish
The most frequent times of departure to work in Whitefish are 7:30 AM to 7:59 AM (327, 18.8%) for males and 9:00 AM to 9:59 AM (409, 22.2%) for females.
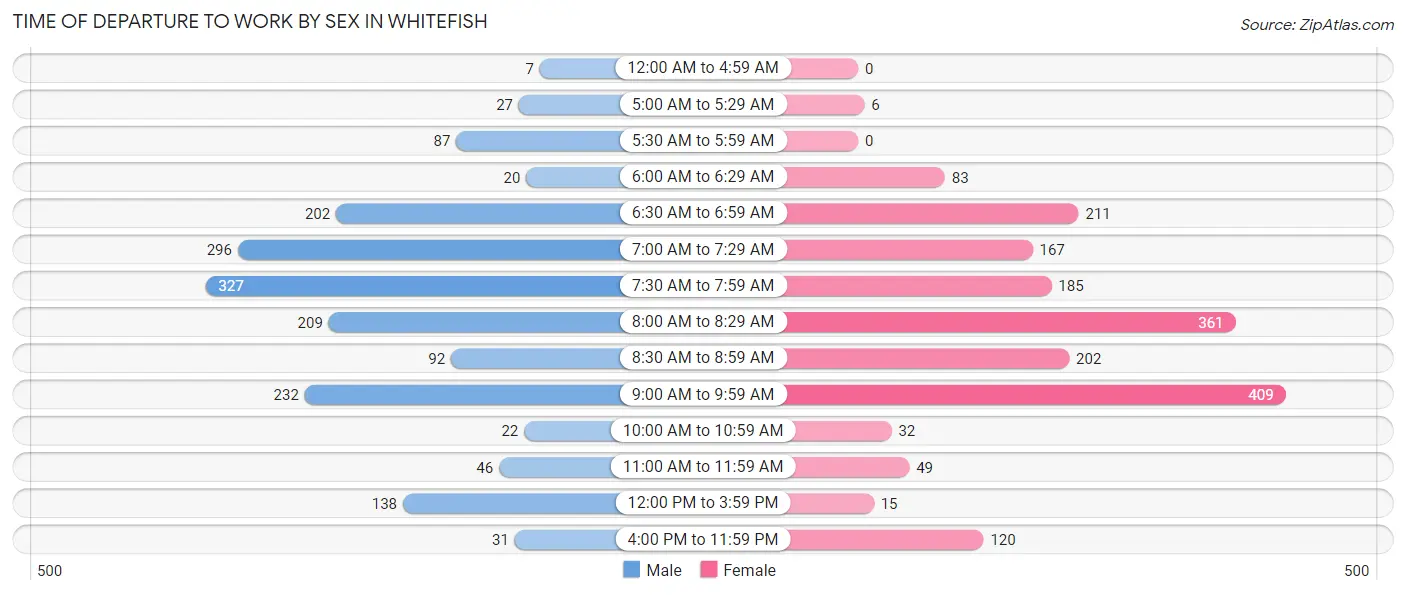
| Time of Departure | Male | Female |
| 12:00 AM to 4:59 AM | 7 (0.4%) | 0 (0.0%) |
| 5:00 AM to 5:29 AM | 27 (1.6%) | 6 (0.3%) |
| 5:30 AM to 5:59 AM | 87 (5.0%) | 0 (0.0%) |
| 6:00 AM to 6:29 AM | 20 (1.1%) | 83 (4.5%) |
| 6:30 AM to 6:59 AM | 202 (11.6%) | 211 (11.5%) |
| 7:00 AM to 7:29 AM | 296 (17.1%) | 167 (9.1%) |
| 7:30 AM to 7:59 AM | 327 (18.8%) | 185 (10.1%) |
| 8:00 AM to 8:29 AM | 209 (12.0%) | 361 (19.6%) |
| 8:30 AM to 8:59 AM | 92 (5.3%) | 202 (11.0%) |
| 9:00 AM to 9:59 AM | 232 (13.4%) | 409 (22.2%) |
| 10:00 AM to 10:59 AM | 22 (1.3%) | 32 (1.7%) |
| 11:00 AM to 11:59 AM | 46 (2.6%) | 49 (2.7%) |
| 12:00 PM to 3:59 PM | 138 (8.0%) | 15 (0.8%) |
| 4:00 PM to 11:59 PM | 31 (1.8%) | 120 (6.5%) |
| Total | 1,736 (100.0%) | 1,840 (100.0%) |
Housing Occupancy in Whitefish
Occupancy by Ownership in Whitefish
Of the total 3,817 dwellings in Whitefish, owner-occupied units account for 2,392 (62.7%), while renter-occupied units make up 1,425 (37.3%).
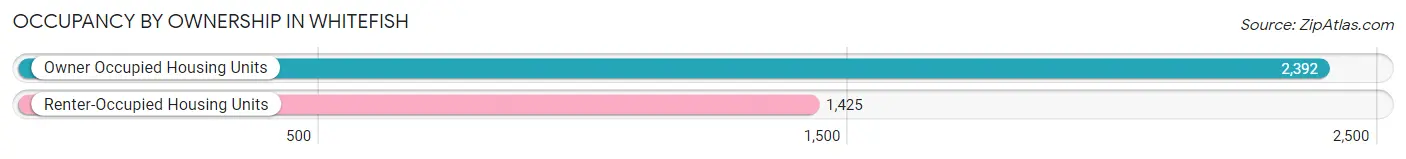
| Occupancy | # Housing Units | % Housing Units |
| Owner Occupied Housing Units | 2,392 | 62.7% |
| Renter-Occupied Housing Units | 1,425 | 37.3% |
| Total Occupied Housing Units | 3,817 | 100.0% |
Occupancy by Household Size in Whitefish
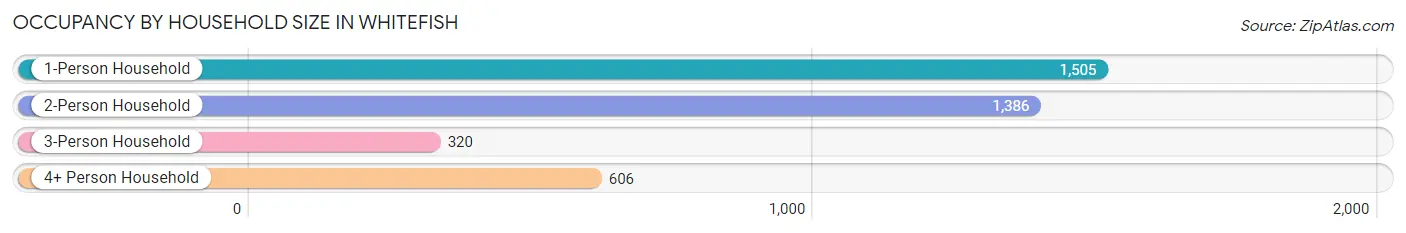
| Household Size | # Housing Units | % Housing Units |
| 1-Person Household | 1,505 | 39.4% |
| 2-Person Household | 1,386 | 36.3% |
| 3-Person Household | 320 | 8.4% |
| 4+ Person Household | 606 | 15.9% |
| Total Housing Units | 3,817 | 100.0% |
Occupancy by Ownership by Household Size in Whitefish
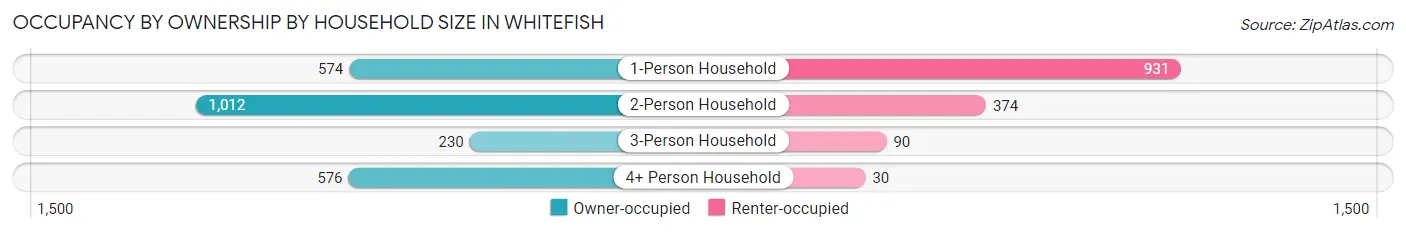
| Household Size | Owner-occupied | Renter-occupied |
| 1-Person Household | 574 (38.1%) | 931 (61.9%) |
| 2-Person Household | 1,012 (73.0%) | 374 (27.0%) |
| 3-Person Household | 230 (71.9%) | 90 (28.1%) |
| 4+ Person Household | 576 (95.1%) | 30 (5.0%) |
| Total Housing Units | 2,392 (62.7%) | 1,425 (37.3%) |
Occupancy by Educational Attainment in Whitefish
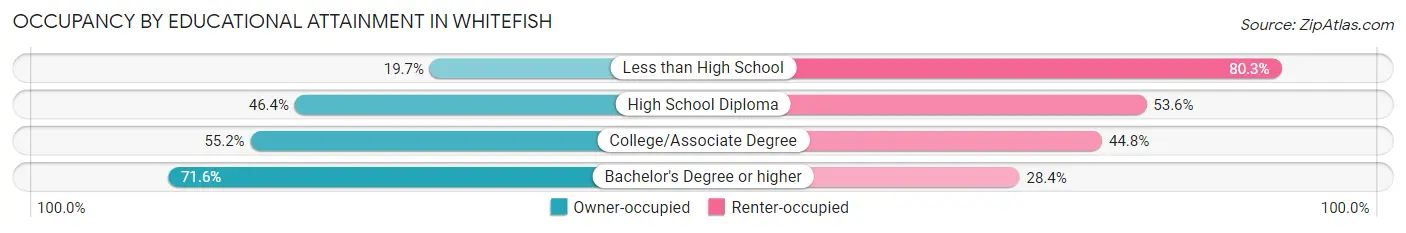
| Household Size | Owner-occupied | Renter-occupied |
| Less than High School | 12 (19.7%) | 49 (80.3%) |
| High School Diploma | 280 (46.4%) | 323 (53.6%) |
| College/Associate Degree | 529 (55.2%) | 429 (44.8%) |
| Bachelor's Degree or higher | 1,571 (71.6%) | 624 (28.4%) |
Occupancy by Age of Householder in Whitefish
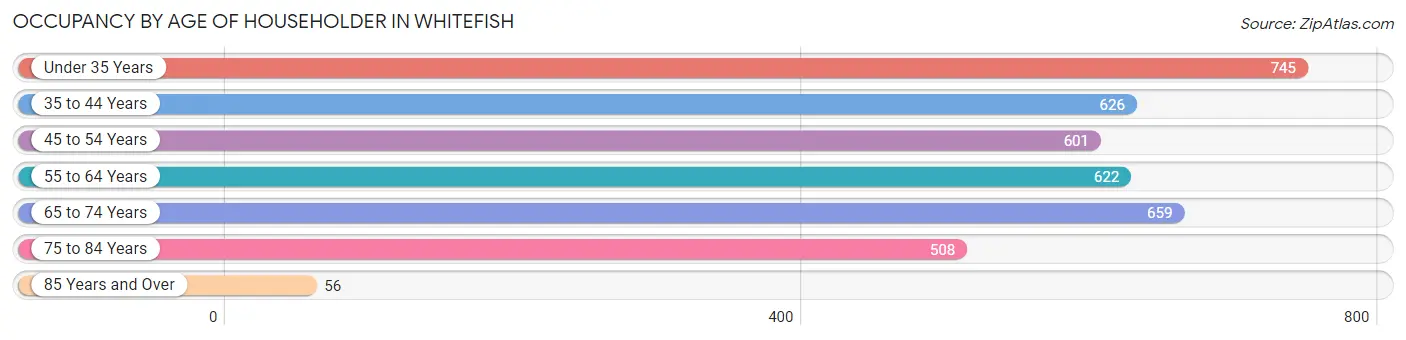
| Age Bracket | # Households | % Households |
| Under 35 Years | 745 | 19.5% |
| 35 to 44 Years | 626 | 16.4% |
| 45 to 54 Years | 601 | 15.8% |
| 55 to 64 Years | 622 | 16.3% |
| 65 to 74 Years | 659 | 17.3% |
| 75 to 84 Years | 508 | 13.3% |
| 85 Years and Over | 56 | 1.5% |
| Total | 3,817 | 100.0% |
Housing Finances in Whitefish
Median Income by Occupancy in Whitefish
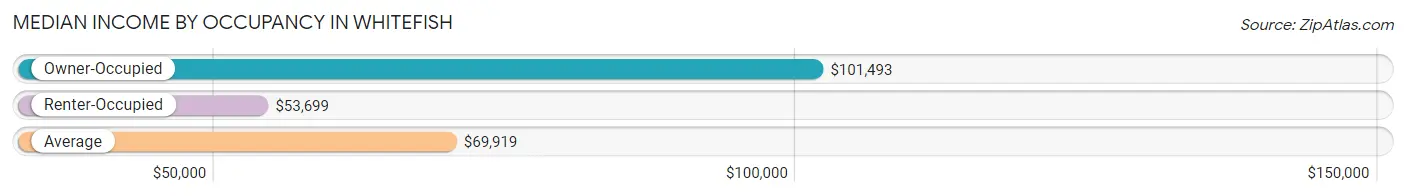
| Occupancy Type | # Households | Median Income |
| Owner-Occupied | 2,392 (62.7%) | $101,493 |
| Renter-Occupied | 1,425 (37.3%) | $53,699 |
| Average | 3,817 (100.0%) | $69,919 |
Occupancy by Householder Income Bracket in Whitefish
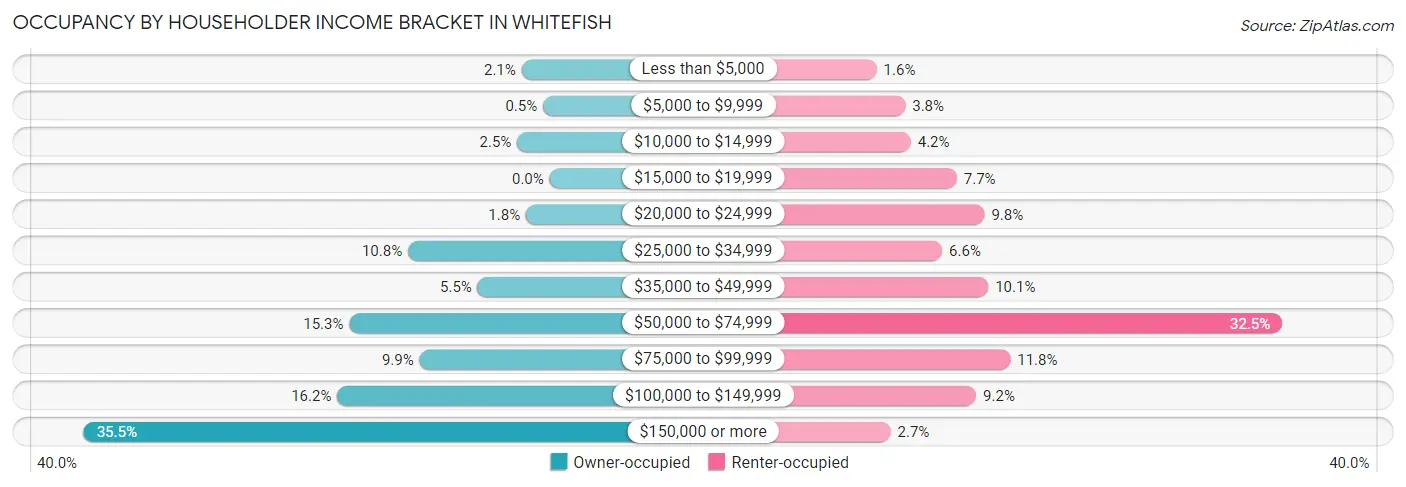
| Income Bracket | Owner-occupied | Renter-occupied |
| Less than $5,000 | 51 (2.1%) | 23 (1.6%) |
| $5,000 to $9,999 | 12 (0.5%) | 54 (3.8%) |
| $10,000 to $14,999 | 59 (2.5%) | 60 (4.2%) |
| $15,000 to $19,999 | 0 (0.0%) | 110 (7.7%) |
| $20,000 to $24,999 | 43 (1.8%) | 140 (9.8%) |
| $25,000 to $34,999 | 258 (10.8%) | 94 (6.6%) |
| $35,000 to $49,999 | 131 (5.5%) | 144 (10.1%) |
| $50,000 to $74,999 | 365 (15.3%) | 463 (32.5%) |
| $75,000 to $99,999 | 237 (9.9%) | 168 (11.8%) |
| $100,000 to $149,999 | 387 (16.2%) | 131 (9.2%) |
| $150,000 or more | 849 (35.5%) | 38 (2.7%) |
| Total | 2,392 (100.0%) | 1,425 (100.0%) |
Monthly Housing Cost Tiers in Whitefish
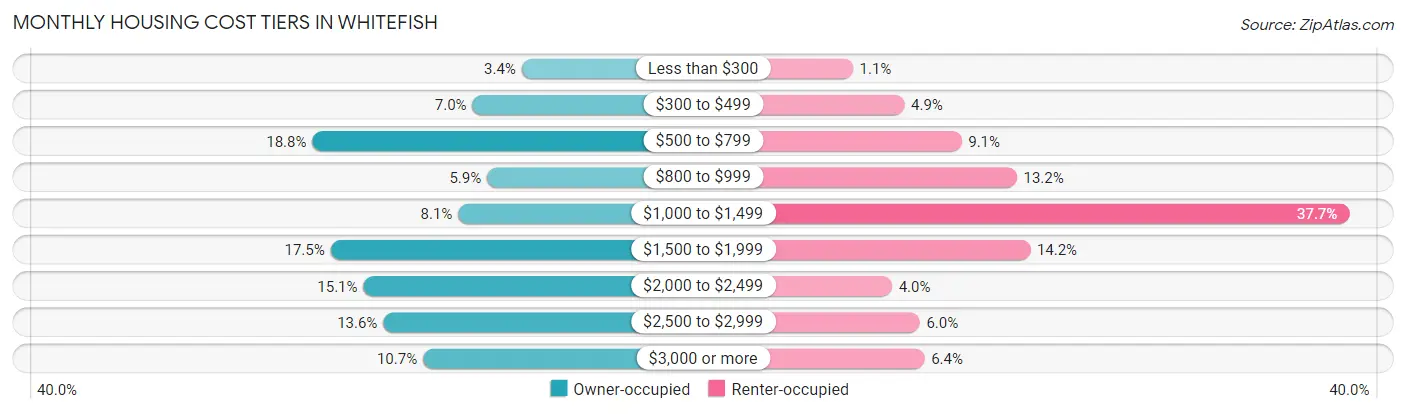
| Monthly Cost | Owner-occupied | Renter-occupied |
| Less than $300 | 81 (3.4%) | 16 (1.1%) |
| $300 to $499 | 168 (7.0%) | 70 (4.9%) |
| $500 to $799 | 450 (18.8%) | 130 (9.1%) |
| $800 to $999 | 142 (5.9%) | 188 (13.2%) |
| $1,000 to $1,499 | 193 (8.1%) | 537 (37.7%) |
| $1,500 to $1,999 | 418 (17.5%) | 202 (14.2%) |
| $2,000 to $2,499 | 360 (15.0%) | 57 (4.0%) |
| $2,500 to $2,999 | 325 (13.6%) | 86 (6.0%) |
| $3,000 or more | 255 (10.7%) | 91 (6.4%) |
| Total | 2,392 (100.0%) | 1,425 (100.0%) |
Physical Housing Characteristics in Whitefish
Housing Structures in Whitefish
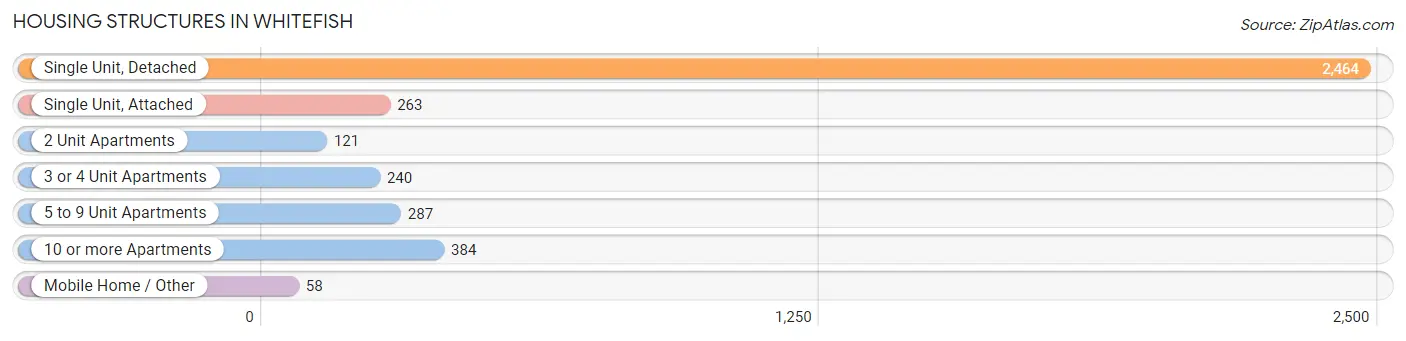
| Structure Type | # Housing Units | % Housing Units |
| Single Unit, Detached | 2,464 | 64.5% |
| Single Unit, Attached | 263 | 6.9% |
| 2 Unit Apartments | 121 | 3.2% |
| 3 or 4 Unit Apartments | 240 | 6.3% |
| 5 to 9 Unit Apartments | 287 | 7.5% |
| 10 or more Apartments | 384 | 10.1% |
| Mobile Home / Other | 58 | 1.5% |
| Total | 3,817 | 100.0% |
Housing Structures by Occupancy in Whitefish
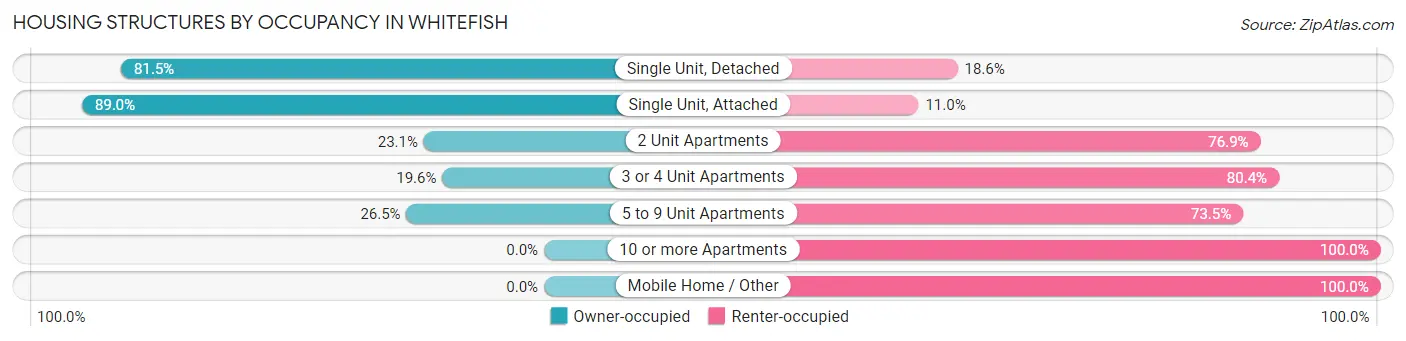
| Structure Type | Owner-occupied | Renter-occupied |
| Single Unit, Detached | 2,007 (81.5%) | 457 (18.5%) |
| Single Unit, Attached | 234 (89.0%) | 29 (11.0%) |
| 2 Unit Apartments | 28 (23.1%) | 93 (76.9%) |
| 3 or 4 Unit Apartments | 47 (19.6%) | 193 (80.4%) |
| 5 to 9 Unit Apartments | 76 (26.5%) | 211 (73.5%) |
| 10 or more Apartments | 0 (0.0%) | 384 (100.0%) |
| Mobile Home / Other | 0 (0.0%) | 58 (100.0%) |
| Total | 2,392 (62.7%) | 1,425 (37.3%) |
Housing Structures by Number of Rooms in Whitefish
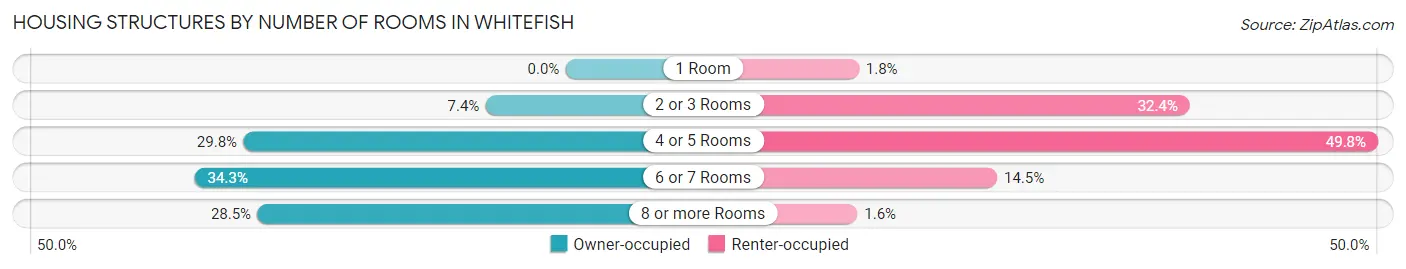
| Number of Rooms | Owner-occupied | Renter-occupied |
| 1 Room | 0 (0.0%) | 25 (1.8%) |
| 2 or 3 Rooms | 177 (7.4%) | 461 (32.4%) |
| 4 or 5 Rooms | 713 (29.8%) | 709 (49.7%) |
| 6 or 7 Rooms | 820 (34.3%) | 207 (14.5%) |
| 8 or more Rooms | 682 (28.5%) | 23 (1.6%) |
| Total | 2,392 (100.0%) | 1,425 (100.0%) |
Housing Structure by Heating Type in Whitefish
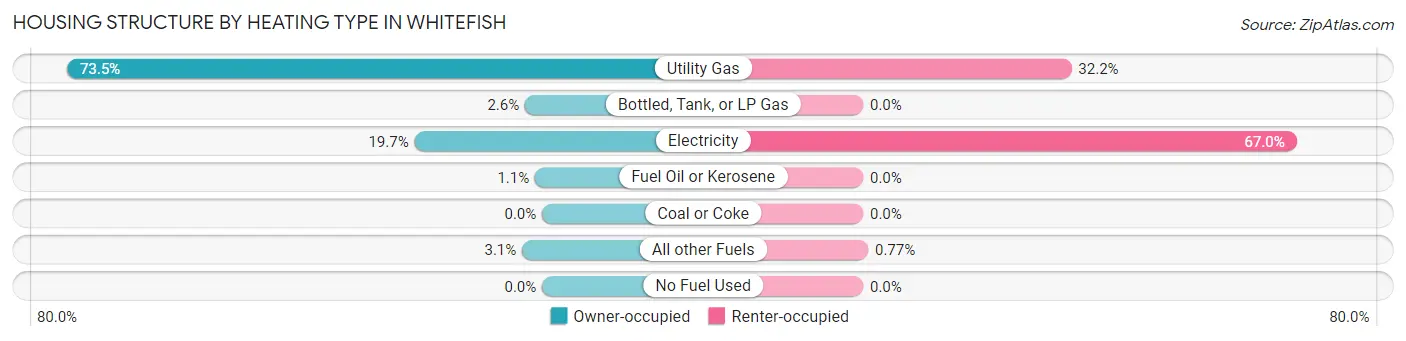
| Heating Type | Owner-occupied | Renter-occupied |
| Utility Gas | 1,757 (73.5%) | 459 (32.2%) |
| Bottled, Tank, or LP Gas | 63 (2.6%) | 0 (0.0%) |
| Electricity | 472 (19.7%) | 955 (67.0%) |
| Fuel Oil or Kerosene | 26 (1.1%) | 0 (0.0%) |
| Coal or Coke | 0 (0.0%) | 0 (0.0%) |
| All other Fuels | 74 (3.1%) | 11 (0.8%) |
| No Fuel Used | 0 (0.0%) | 0 (0.0%) |
| Total | 2,392 (100.0%) | 1,425 (100.0%) |
Household Vehicle Usage in Whitefish
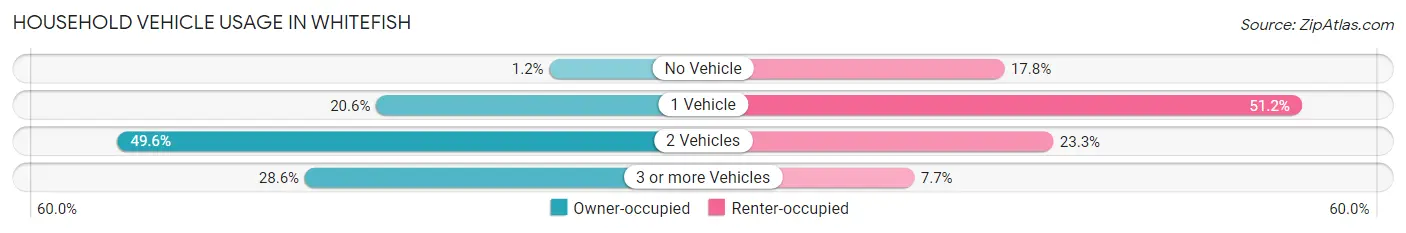
| Vehicles per Household | Owner-occupied | Renter-occupied |
| No Vehicle | 29 (1.2%) | 254 (17.8%) |
| 1 Vehicle | 493 (20.6%) | 729 (51.2%) |
| 2 Vehicles | 1,186 (49.6%) | 332 (23.3%) |
| 3 or more Vehicles | 684 (28.6%) | 110 (7.7%) |
| Total | 2,392 (100.0%) | 1,425 (100.0%) |
Real Estate & Mortgages in Whitefish
Real Estate and Mortgage Overview in Whitefish
| Characteristic | Without Mortgage | With Mortgage |
| Housing Units | 1,014 | 1,378 |
| Median Property Value | $606,900 | $611,300 |
| Median Household Income | $59,295 | $658 |
| Monthly Housing Costs | $599 | $255 |
| Real Estate Taxes | $3,862 | $9 |
Property Value by Mortgage Status in Whitefish
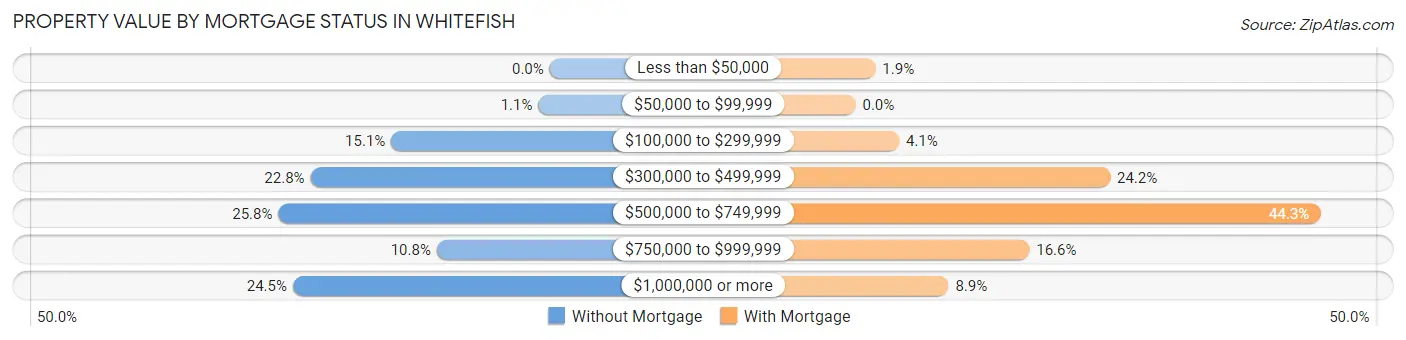
| Property Value | Without Mortgage | With Mortgage |
| Less than $50,000 | 0 (0.0%) | 26 (1.9%) |
| $50,000 to $99,999 | 11 (1.1%) | 0 (0.0%) |
| $100,000 to $299,999 | 153 (15.1%) | 57 (4.1%) |
| $300,000 to $499,999 | 231 (22.8%) | 334 (24.2%) |
| $500,000 to $749,999 | 262 (25.8%) | 611 (44.3%) |
| $750,000 to $999,999 | 109 (10.7%) | 228 (16.6%) |
| $1,000,000 or more | 248 (24.5%) | 122 (8.8%) |
| Total | 1,014 (100.0%) | 1,378 (100.0%) |
Household Income by Mortgage Status in Whitefish
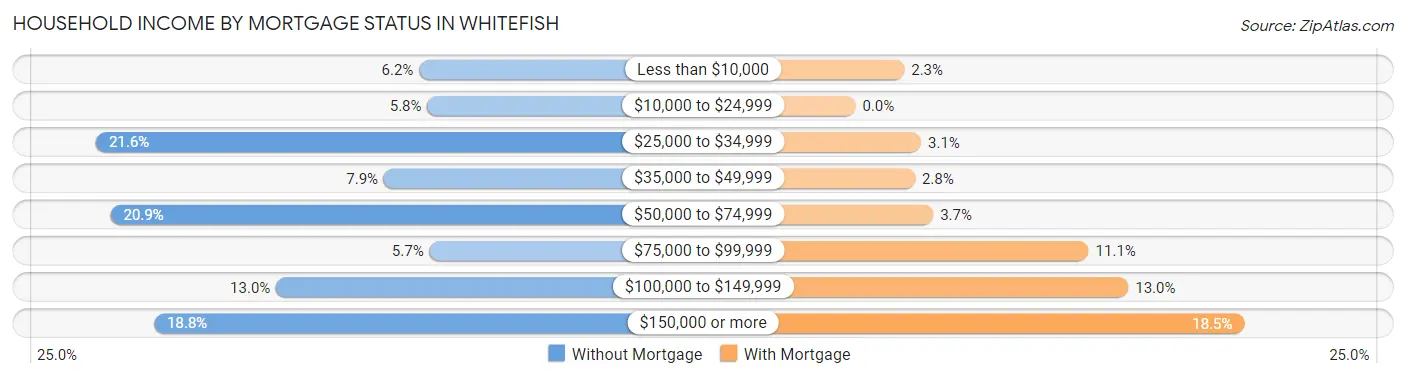
| Household Income | Without Mortgage | With Mortgage |
| Less than $10,000 | 63 (6.2%) | 32 (2.3%) |
| $10,000 to $24,999 | 59 (5.8%) | 0 (0.0%) |
| $25,000 to $34,999 | 219 (21.6%) | 43 (3.1%) |
| $35,000 to $49,999 | 80 (7.9%) | 39 (2.8%) |
| $50,000 to $74,999 | 212 (20.9%) | 51 (3.7%) |
| $75,000 to $99,999 | 58 (5.7%) | 153 (11.1%) |
| $100,000 to $149,999 | 132 (13.0%) | 179 (13.0%) |
| $150,000 or more | 191 (18.8%) | 255 (18.5%) |
| Total | 1,014 (100.0%) | 1,378 (100.0%) |
Property Value to Household Income Ratio in Whitefish
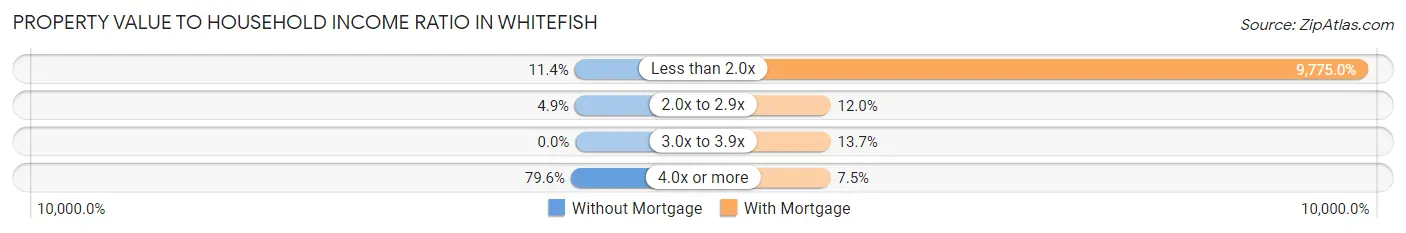
| Value-to-Income Ratio | Without Mortgage | With Mortgage |
| Less than 2.0x | 116 (11.4%) | 134,700 (9,775.0%) |
| 2.0x to 2.9x | 50 (4.9%) | 165 (12.0%) |
| 3.0x to 3.9x | 0 (0.0%) | 189 (13.7%) |
| 4.0x or more | 807 (79.6%) | 103 (7.5%) |
| Total | 1,014 (100.0%) | 1,378 (100.0%) |
Real Estate Taxes by Mortgage Status in Whitefish
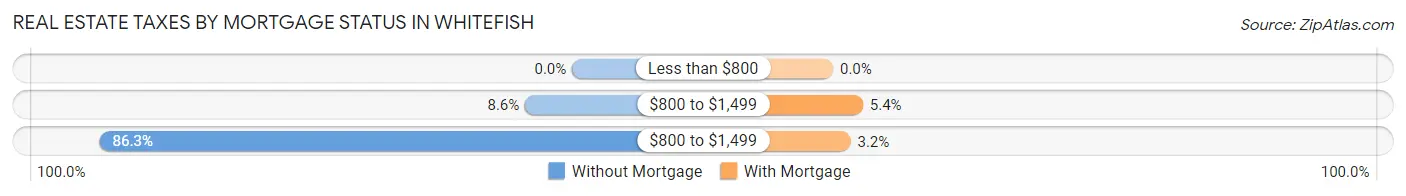
| Property Taxes | Without Mortgage | With Mortgage |
| Less than $800 | 0 (0.0%) | 0 (0.0%) |
| $800 to $1,499 | 87 (8.6%) | 75 (5.4%) |
| $800 to $1,499 | 875 (86.3%) | 44 (3.2%) |
| Total | 1,014 (100.0%) | 1,378 (100.0%) |
Health & Disability in Whitefish
Health Insurance Coverage by Age in Whitefish
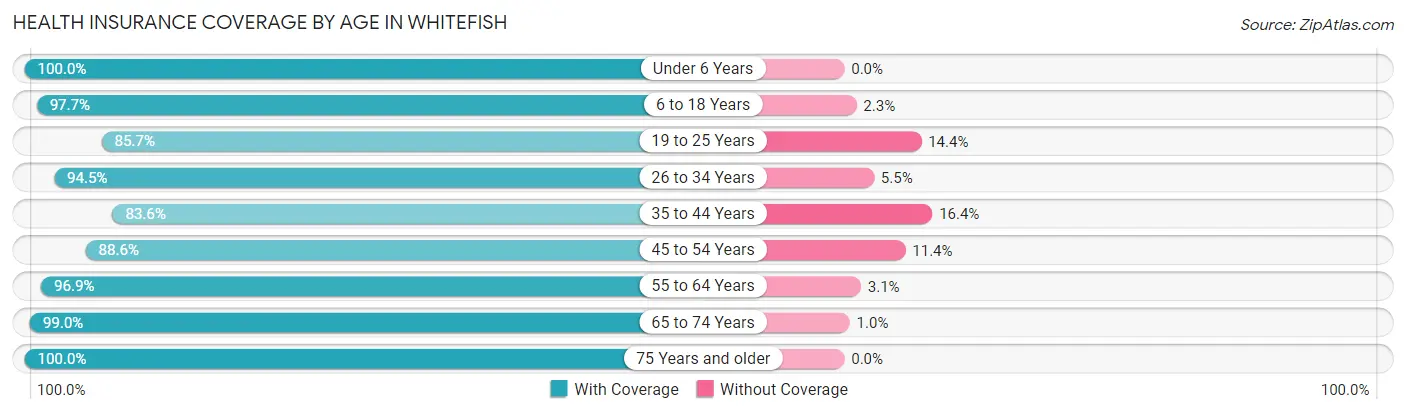
| Age Bracket | With Coverage | Without Coverage |
| Under 6 Years | 367 (100.0%) | 0 (0.0%) |
| 6 to 18 Years | 1,037 (97.7%) | 24 (2.3%) |
| 19 to 25 Years | 364 (85.7%) | 61 (14.3%) |
| 26 to 34 Years | 1,129 (94.5%) | 66 (5.5%) |
| 35 to 44 Years | 1,010 (83.6%) | 198 (16.4%) |
| 45 to 54 Years | 840 (88.6%) | 108 (11.4%) |
| 55 to 64 Years | 1,004 (96.9%) | 32 (3.1%) |
| 65 to 74 Years | 995 (99.0%) | 10 (1.0%) |
| 75 Years and older | 693 (100.0%) | 0 (0.0%) |
| Total | 7,439 (93.7%) | 499 (6.3%) |
Health Insurance Coverage by Citizenship Status in Whitefish
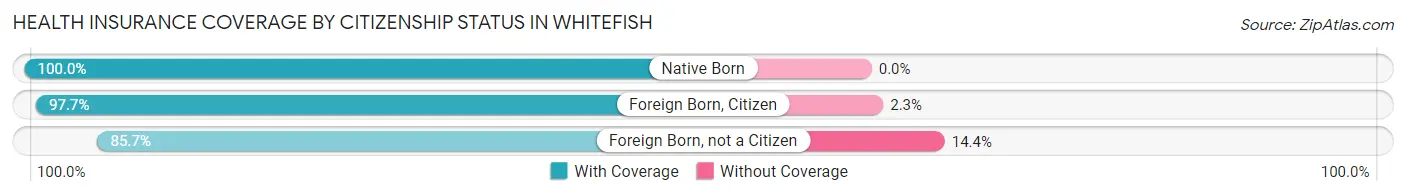
| Citizenship Status | With Coverage | Without Coverage |
| Native Born | 367 (100.0%) | 0 (0.0%) |
| Foreign Born, Citizen | 1,037 (97.7%) | 24 (2.3%) |
| Foreign Born, not a Citizen | 364 (85.7%) | 61 (14.3%) |
Health Insurance Coverage by Household Income in Whitefish
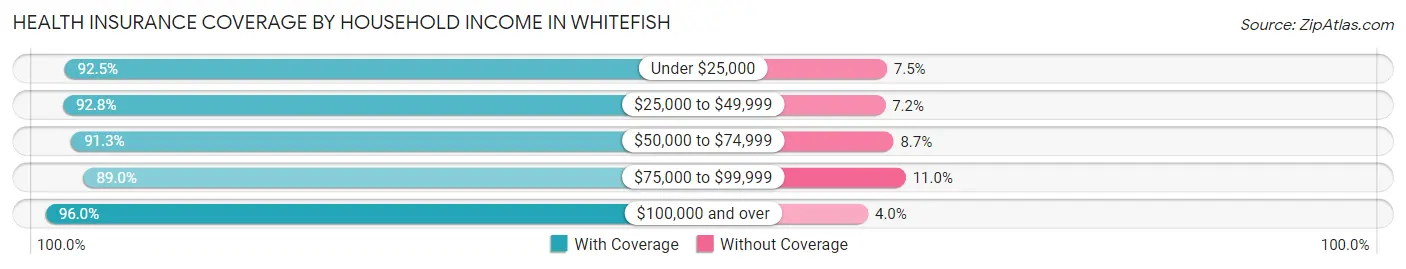
| Household Income | With Coverage | Without Coverage |
| Under $25,000 | 665 (92.5%) | 54 (7.5%) |
| $25,000 to $49,999 | 773 (92.8%) | 60 (7.2%) |
| $50,000 to $74,999 | 1,264 (91.3%) | 121 (8.7%) |
| $75,000 to $99,999 | 822 (89.0%) | 102 (11.0%) |
| $100,000 and over | 3,913 (96.0%) | 162 (4.0%) |
Public vs Private Health Insurance Coverage by Age in Whitefish
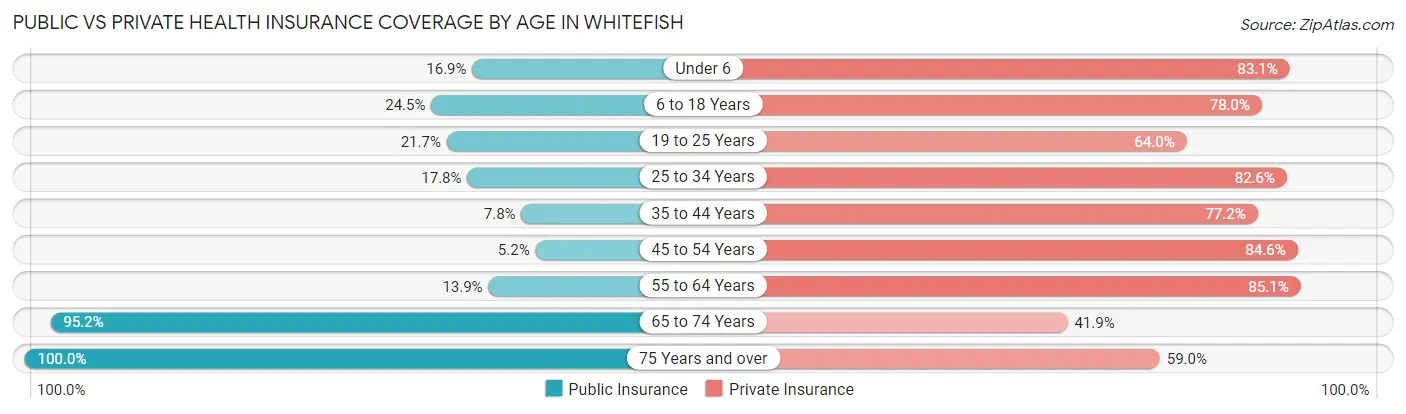
| Age Bracket | Public Insurance | Private Insurance |
| Under 6 | 62 (16.9%) | 305 (83.1%) |
| 6 to 18 Years | 260 (24.5%) | 827 (77.9%) |
| 19 to 25 Years | 92 (21.6%) | 272 (64.0%) |
| 25 to 34 Years | 213 (17.8%) | 987 (82.6%) |
| 35 to 44 Years | 94 (7.8%) | 932 (77.1%) |
| 45 to 54 Years | 49 (5.2%) | 802 (84.6%) |
| 55 to 64 Years | 144 (13.9%) | 882 (85.1%) |
| 65 to 74 Years | 957 (95.2%) | 421 (41.9%) |
| 75 Years and over | 693 (100.0%) | 409 (59.0%) |
| Total | 2,564 (32.3%) | 5,837 (73.5%) |
Disability Status by Sex by Age in Whitefish
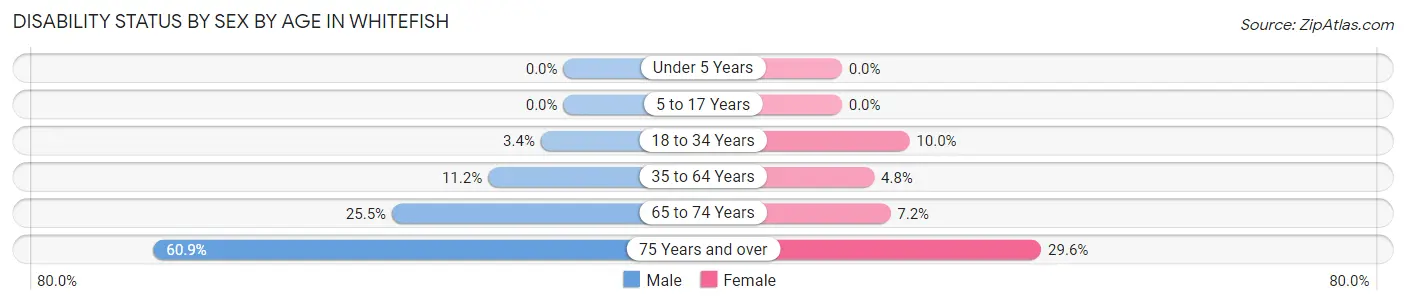
| Age Bracket | Male | Female |
| Under 5 Years | 0 (0.0%) | 0 (0.0%) |
| 5 to 17 Years | 0 (0.0%) | 0 (0.0%) |
| 18 to 34 Years | 29 (3.4%) | 81 (10.0%) |
| 35 to 64 Years | 166 (11.2%) | 82 (4.8%) |
| 65 to 74 Years | 111 (25.5%) | 41 (7.2%) |
| 75 Years and over | 210 (60.9%) | 103 (29.6%) |
Disability Class by Sex by Age in Whitefish
Disability Class: Hearing Difficulty
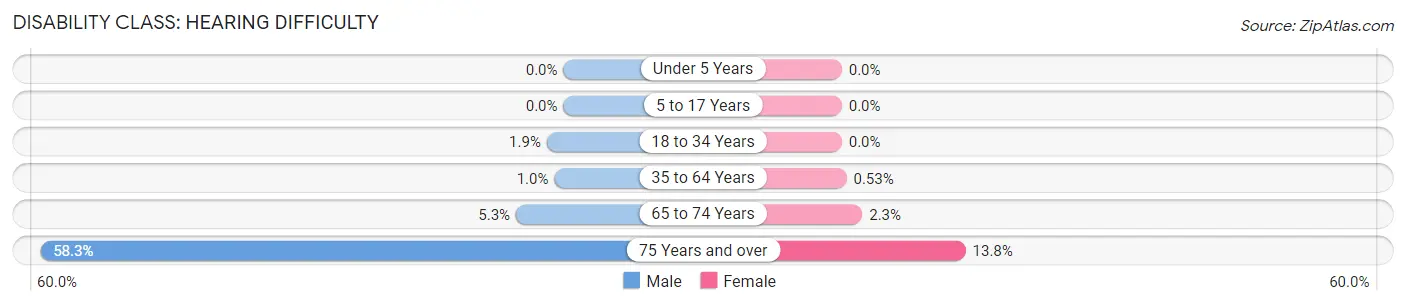
| Age Bracket | Male | Female |
| Under 5 Years | 0 (0.0%) | 0 (0.0%) |
| 5 to 17 Years | 0 (0.0%) | 0 (0.0%) |
| 18 to 34 Years | 16 (1.8%) | 0 (0.0%) |
| 35 to 64 Years | 15 (1.0%) | 9 (0.5%) |
| 65 to 74 Years | 23 (5.3%) | 13 (2.3%) |
| 75 Years and over | 201 (58.3%) | 48 (13.8%) |
Disability Class: Vision Difficulty
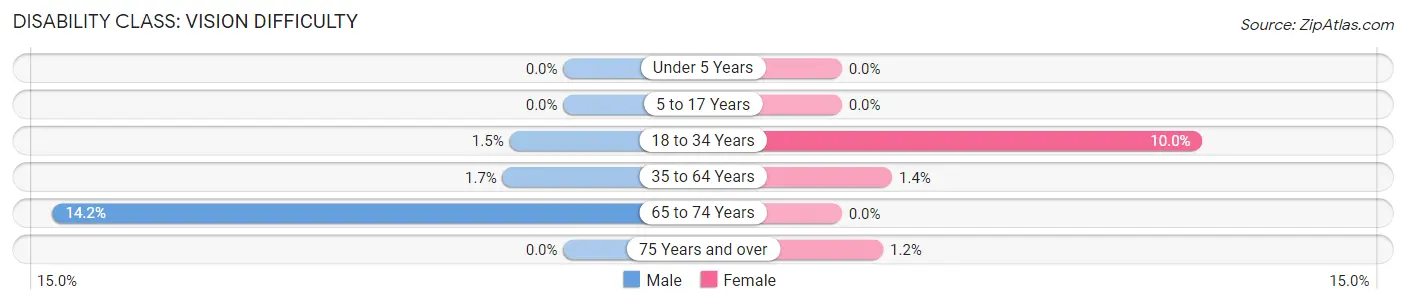
| Age Bracket | Male | Female |
| Under 5 Years | 0 (0.0%) | 0 (0.0%) |
| 5 to 17 Years | 0 (0.0%) | 0 (0.0%) |
| 18 to 34 Years | 13 (1.5%) | 81 (10.0%) |
| 35 to 64 Years | 25 (1.7%) | 24 (1.4%) |
| 65 to 74 Years | 62 (14.2%) | 0 (0.0%) |
| 75 Years and over | 0 (0.0%) | 4 (1.1%) |
Disability Class: Cognitive Difficulty
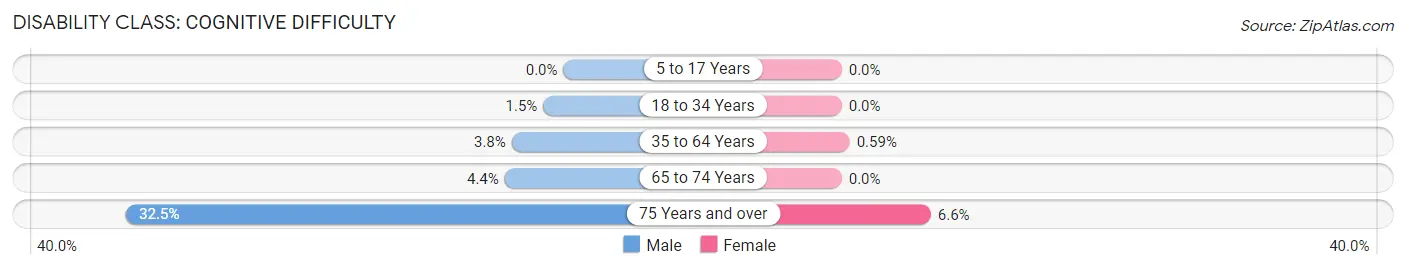
| Age Bracket | Male | Female |
| 5 to 17 Years | 0 (0.0%) | 0 (0.0%) |
| 18 to 34 Years | 13 (1.5%) | 0 (0.0%) |
| 35 to 64 Years | 57 (3.8%) | 10 (0.6%) |
| 65 to 74 Years | 19 (4.4%) | 0 (0.0%) |
| 75 Years and over | 112 (32.5%) | 23 (6.6%) |
Disability Class: Ambulatory Difficulty
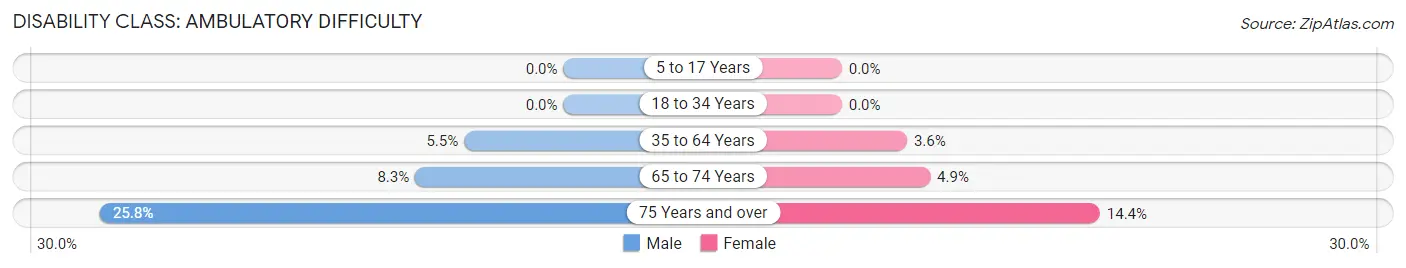
| Age Bracket | Male | Female |
| 5 to 17 Years | 0 (0.0%) | 0 (0.0%) |
| 18 to 34 Years | 0 (0.0%) | 0 (0.0%) |
| 35 to 64 Years | 82 (5.5%) | 62 (3.6%) |
| 65 to 74 Years | 36 (8.3%) | 28 (4.9%) |
| 75 Years and over | 89 (25.8%) | 50 (14.4%) |
Disability Class: Self-Care Difficulty
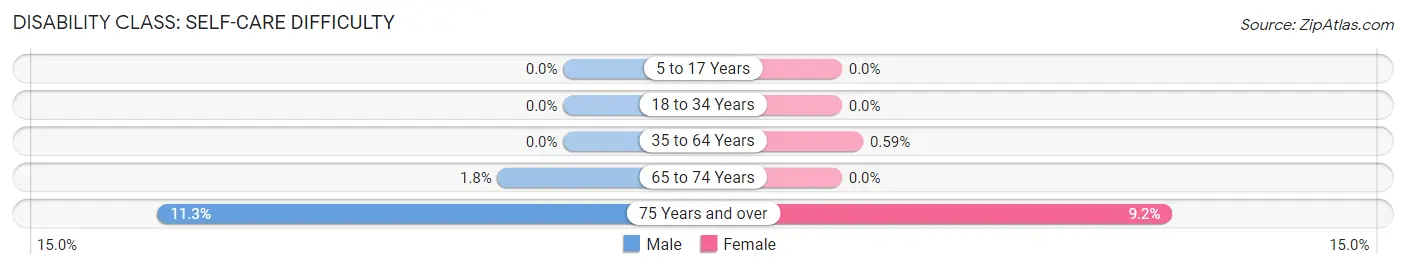
| Age Bracket | Male | Female |
| 5 to 17 Years | 0 (0.0%) | 0 (0.0%) |
| 18 to 34 Years | 0 (0.0%) | 0 (0.0%) |
| 35 to 64 Years | 0 (0.0%) | 10 (0.6%) |
| 65 to 74 Years | 8 (1.8%) | 0 (0.0%) |
| 75 Years and over | 39 (11.3%) | 32 (9.2%) |
Technology Access in Whitefish
Computing Device Access in Whitefish
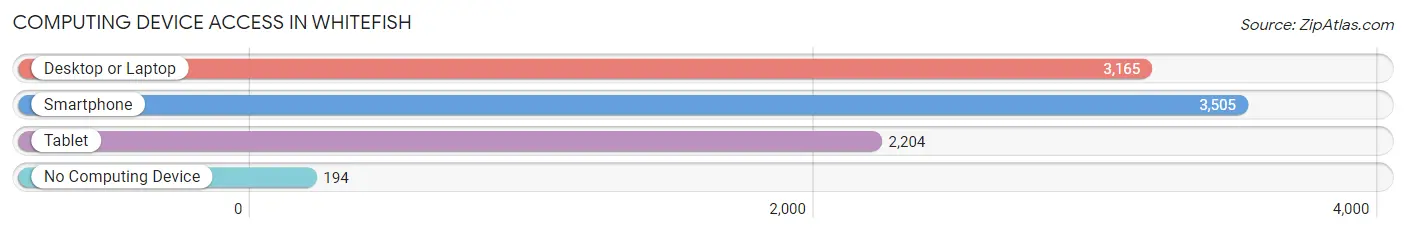
| Device Type | # Households | % Households |
| Desktop or Laptop | 3,165 | 82.9% |
| Smartphone | 3,505 | 91.8% |
| Tablet | 2,204 | 57.7% |
| No Computing Device | 194 | 5.1% |
| Total | 3,817 | 100.0% |
Internet Access in Whitefish
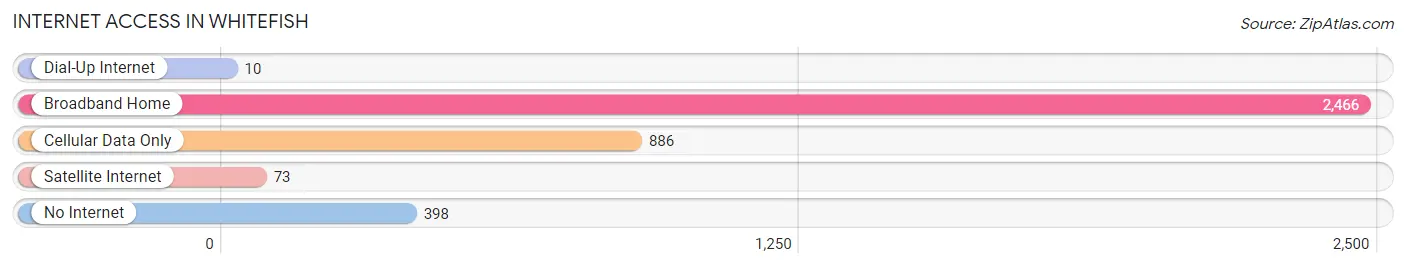
| Internet Type | # Households | % Households |
| Dial-Up Internet | 10 | 0.3% |
| Broadband Home | 2,466 | 64.6% |
| Cellular Data Only | 886 | 23.2% |
| Satellite Internet | 73 | 1.9% |
| No Internet | 398 | 10.4% |
| Total | 3,817 | 100.0% |
Whitefish Summary
Whitefish, Montana is a small city located in the Flathead Valley of northwestern Montana. It is situated at the base of Big Mountain Ski Resort and is surrounded by the Flathead National Forest and Glacier National Park. The city has a population of 6,357 as of the 2010 census, making it the largest city in Flathead County.
History
Whitefish was first settled in the late 1800s by homesteaders and loggers. The city was officially incorporated in 1905 and was named after the whitefish that were abundant in the nearby Flathead River. The city quickly grew as a logging and railroad town, and by the 1920s, it had become a popular tourist destination. The Great Northern Railway built a depot in Whitefish in 1921, and the city was connected to the rest of the country by rail.
In the 1950s, Whitefish began to transition from a logging and railroad town to a tourist destination. The city was home to the first ski resort in Montana, Big Mountain Ski Resort, which opened in 1947. The resort quickly became a popular destination for skiers and snowboarders from all over the country.
Geography
Whitefish is located in the Flathead Valley of northwestern Montana. The city is situated at the base of Big Mountain Ski Resort and is surrounded by the Flathead National Forest and Glacier National Park. The city is located at an elevation of 3,028 feet and has a total area of 4.2 square miles.
The city is located on the western edge of the Rocky Mountains and is home to several lakes, including Whitefish Lake, which is the largest lake in the Flathead Valley. The city is also home to several rivers, including the Flathead River, which is the largest river in the area.
Economy
Whitefish is a popular tourist destination and is home to several ski resorts, including Big Mountain Ski Resort. The city is also home to several restaurants, bars, and shops, as well as a variety of outdoor activities, such as fishing, hiking, and camping.
The city is also home to several manufacturing and technology companies, including Whitefish Energy, which is a renewable energy company. The city is also home to several educational institutions, including Flathead Valley Community College and Montana State University-Whitefish.
Demographics
As of the 2010 census, Whitefish had a population of 6,357. The racial makeup of the city was 94.3% White, 0.7% African American, 0.7% Native American, 0.7% Asian, 0.2% Pacific Islander, 1.2% from other races, and 2.1% from two or more races. Hispanic or Latino of any race were 3.3% of the population.
The median income for a household in Whitefish was $41,944, and the median income for a family was $50,944. The per capita income for the city was $25,944. About 11.2% of families and 15.2% of the population were below the poverty line, including 18.2% of those under age 18 and 8.2% of those age 65 or over.
Common Questions
What is Per Capita Income in Whitefish?
Per Capita income in Whitefish is $58,504.
What is the Median Family Income in Whitefish?
Median Family Income in Whitefish is $122,500.
What is the Median Household income in Whitefish?
Median Household Income in Whitefish is $69,919.
What is Income or Wage Gap in Whitefish?
Income or Wage Gap in Whitefish is 30.1%.
Women in Whitefish earn 69.9 cents for every dollar earned by a man.
What is Inequality or Gini Index in Whitefish?
Inequality or Gini Index in Whitefish is 0.53.
What is the Total Population of Whitefish?
Total Population of Whitefish is 8,098.
What is the Total Male Population of Whitefish?
Total Male Population of Whitefish is 4,004.
What is the Total Female Population of Whitefish?
Total Female Population of Whitefish is 4,094.
What is the Ratio of Males per 100 Females in Whitefish?
There are 97.80 Males per 100 Females in Whitefish.
What is the Ratio of Females per 100 Males in Whitefish?
There are 102.25 Females per 100 Males in Whitefish.
What is the Median Population Age in Whitefish?
Median Population Age in Whitefish is 43.0 Years.
What is the Average Family Size in Whitefish
Average Family Size in Whitefish is 2.8 People.
What is the Average Household Size in Whitefish
Average Household Size in Whitefish is 2.1 People.
How Large is the Labor Force in Whitefish?
There are 4,711 People in the Labor Forcein in Whitefish.
What is the Percentage of People in the Labor Force in Whitefish?
68.4% of People are in the Labor Force in Whitefish.
What is the Unemployment Rate in Whitefish?
Unemployment Rate in Whitefish is 2.5%.