Silver Gate, MT Map & Demographics
Silver Gate Map
Silver Gate Overview
$89,698
PER CAPITA INCOME
$250,001
AVG FAMILY INCOME
0.36
INEQUALITY / GINI INDEX
114
TOTAL POPULATION
65
MALE POPULATION
49
FEMALE POPULATION
132.65
MALES / 100 FEMALES
75.38
FEMALES / 100 MALES
56.9
MEDIAN AGE
2.4
AVG FAMILY SIZE
2.1
AVG HOUSEHOLD SIZE
51
LABOR FORCE [ PEOPLE ]
50.5%
PERCENT IN LABOR FORCE
Silver Gate Zip Codes
Silver Gate Area Codes
Income in Silver Gate
Income Overview in Silver Gate
| Characteristic | Number | Measure |
| Per Capita Income | 114 | $89,698 |
| Median Family Income | 44 | $250,001 |
| Mean Family Income | 44 | $196,439 |
| Median Household Income | 53 | $0 |
| Mean Household Income | 53 | $171,164 |
| Income Deficit | 44 | $0 |
| Wage / Income Gap (%) | 114 | 0.00% |
| Wage / Income Gap ($) | 114 | 100.00¢ per $1 |
| Gini / Inequality Index | 114 | 0.36 |
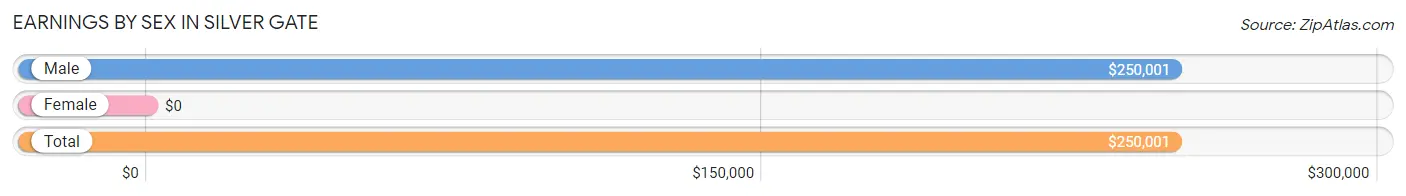
Earnings by Sex in Silver Gate
| Sex | Number | Average Earnings |
| Male | 45 (83.3%) | $250,001 |
| Female | 9 (16.7%) | $0 |
| Total | 54 (100.0%) | $250,001 |
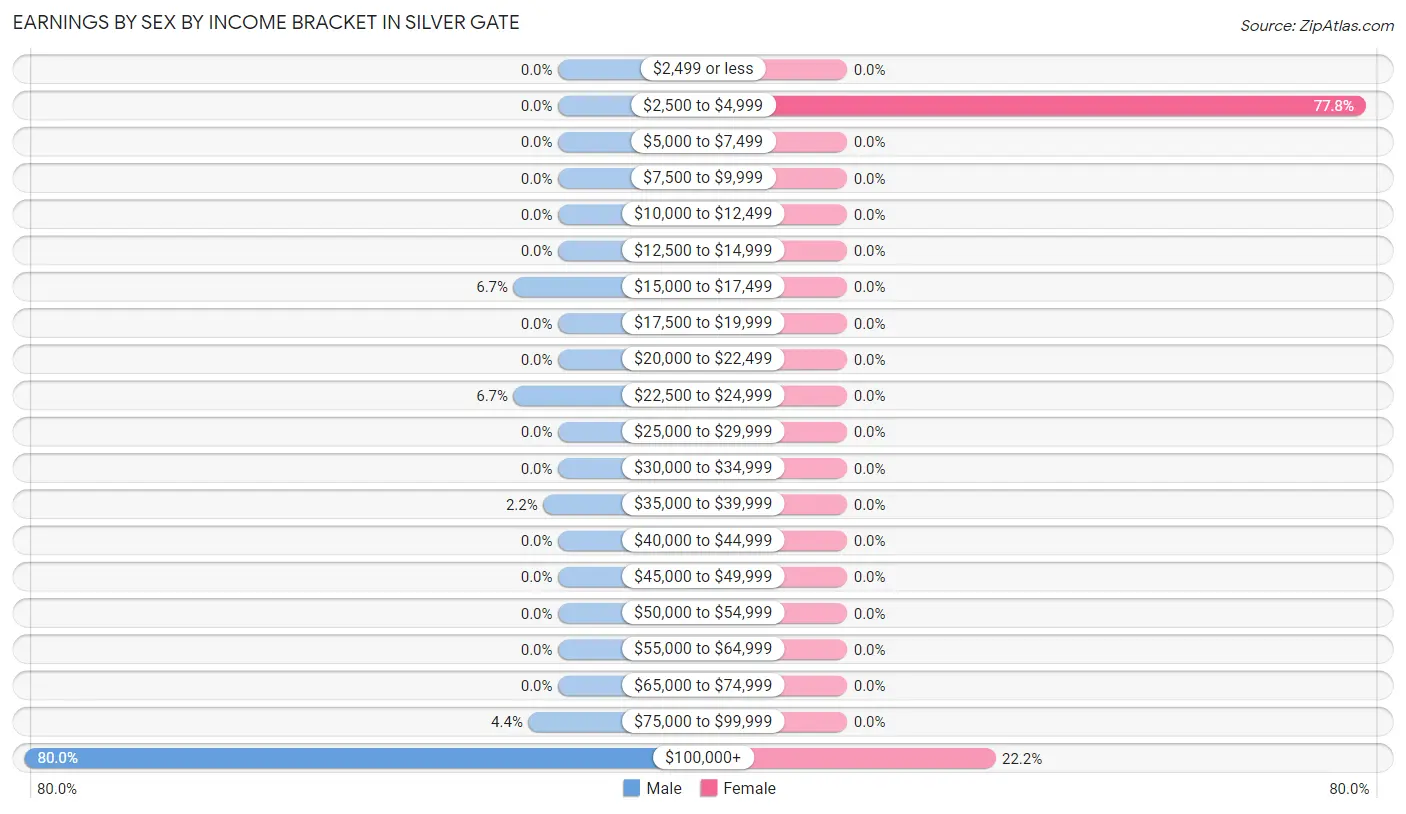
Earnings by Sex by Income Bracket in Silver Gate
The most common earnings brackets in Silver Gate are $100,000+ for men (36 | 80.0%) and $2,500 to $4,999 for women (7 | 77.8%).
| Income | Male | Female |
| $2,499 or less | 0 (0.0%) | 0 (0.0%) |
| $2,500 to $4,999 | 0 (0.0%) | 7 (77.8%) |
| $5,000 to $7,499 | 0 (0.0%) | 0 (0.0%) |
| $7,500 to $9,999 | 0 (0.0%) | 0 (0.0%) |
| $10,000 to $12,499 | 0 (0.0%) | 0 (0.0%) |
| $12,500 to $14,999 | 0 (0.0%) | 0 (0.0%) |
| $15,000 to $17,499 | 3 (6.7%) | 0 (0.0%) |
| $17,500 to $19,999 | 0 (0.0%) | 0 (0.0%) |
| $20,000 to $22,499 | 0 (0.0%) | 0 (0.0%) |
| $22,500 to $24,999 | 3 (6.7%) | 0 (0.0%) |
| $25,000 to $29,999 | 0 (0.0%) | 0 (0.0%) |
| $30,000 to $34,999 | 0 (0.0%) | 0 (0.0%) |
| $35,000 to $39,999 | 1 (2.2%) | 0 (0.0%) |
| $40,000 to $44,999 | 0 (0.0%) | 0 (0.0%) |
| $45,000 to $49,999 | 0 (0.0%) | 0 (0.0%) |
| $50,000 to $54,999 | 0 (0.0%) | 0 (0.0%) |
| $55,000 to $64,999 | 0 (0.0%) | 0 (0.0%) |
| $65,000 to $74,999 | 0 (0.0%) | 0 (0.0%) |
| $75,000 to $99,999 | 2 (4.4%) | 0 (0.0%) |
| $100,000+ | 36 (80.0%) | 2 (22.2%) |
| Total | 45 (100.0%) | 9 (100.0%) |
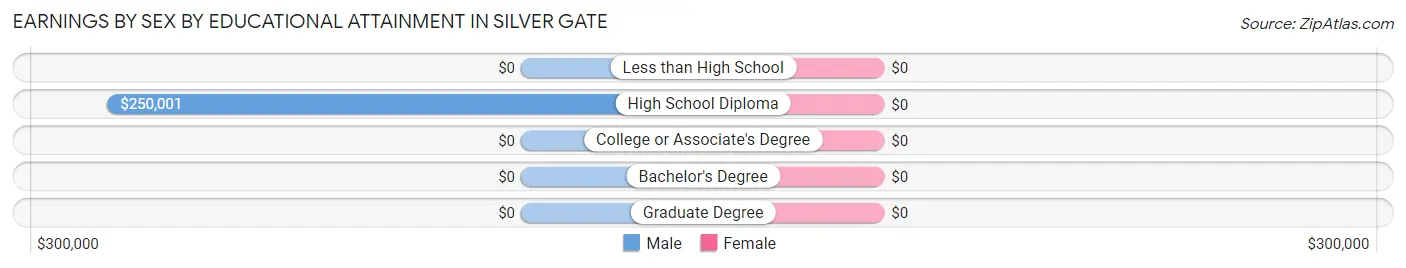
Earnings by Sex by Educational Attainment in Silver Gate
| Educational Attainment | Male Income | Female Income |
| Less than High School | - | - |
| High School Diploma | $250,001 | $0 |
| College or Associate's Degree | - | - |
| Bachelor's Degree | - | - |
| Graduate Degree | - | - |
| Total | $250,001 | $0 |
Family Income in Silver Gate
Family Income Brackets in Silver Gate
According to the Silver Gate family income data, there are 27 families falling into the $200,000+ income range, which is the most common income bracket and makes up 61.4% of all families.
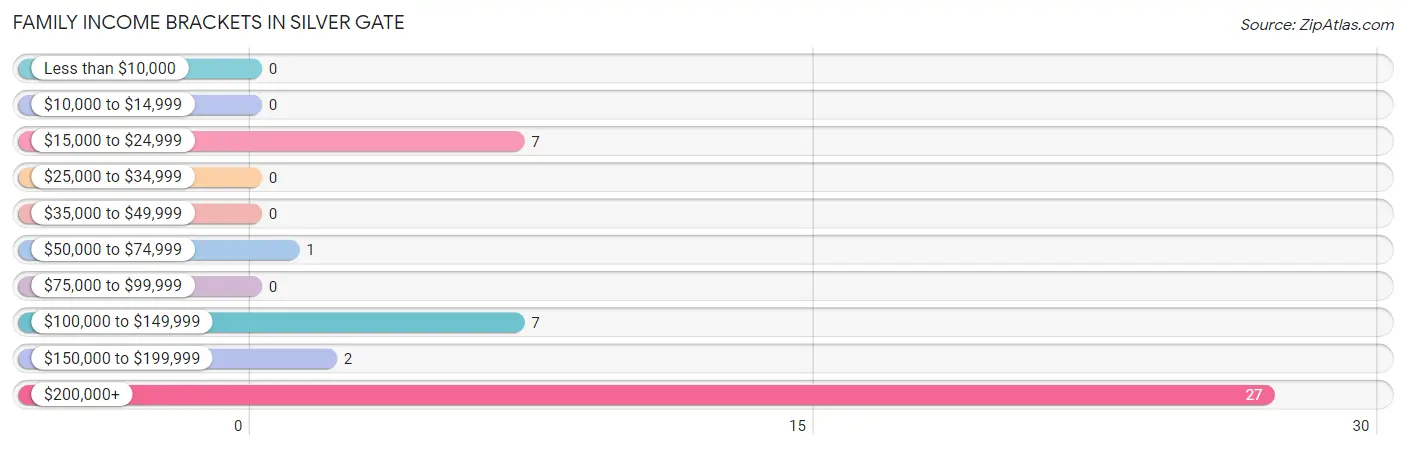
| Income Bracket | # Families | % Families |
| Less than $10,000 | 0 | 0.0% |
| $10,000 to $14,999 | 0 | 0.0% |
| $15,000 to $24,999 | 7 | 15.9% |
| $25,000 to $34,999 | 0 | 0.0% |
| $35,000 to $49,999 | 0 | 0.0% |
| $50,000 to $74,999 | 1 | 2.3% |
| $75,000 to $99,999 | 0 | 0.0% |
| $100,000 to $149,999 | 7 | 15.9% |
| $150,000 to $199,999 | 2 | 4.5% |
| $200,000+ | 27 | 61.4% |
Family Income by Famaliy Size in Silver Gate
2-person families (37 | 84.1%) account for the highest median family income in Silver Gate with $250,001 per family, while 2-person families (37 | 84.1%) have the highest median income of $125,000 per family member.
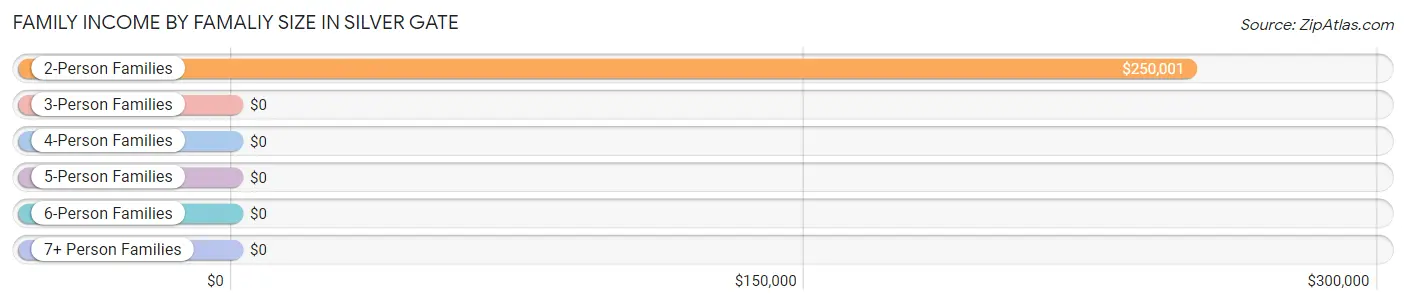
| Income Bracket | # Families | Median Income |
| 2-Person Families | 37 (84.1%) | $250,001 |
| 3-Person Families | 0 (0.0%) | $0 |
| 4-Person Families | 7 (15.9%) | $0 |
| 5-Person Families | 0 (0.0%) | $0 |
| 6-Person Families | 0 (0.0%) | $0 |
| 7+ Person Families | 0 (0.0%) | $0 |
| Total | 44 (100.0%) | $250,001 |
Family Income by Number of Earners in Silver Gate
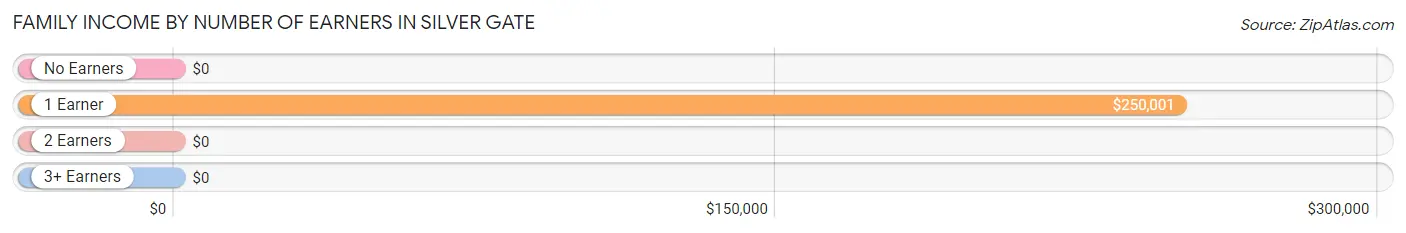
| Number of Earners | # Families | Median Income |
| No Earners | 9 (20.4%) | $0 |
| 1 Earner | 26 (59.1%) | $250,001 |
| 2 Earners | 9 (20.4%) | $0 |
| 3+ Earners | 0 (0.0%) | $0 |
| Total | 44 (100.0%) | $250,001 |
Household Income in Silver Gate
Household Income Brackets in Silver Gate
With 27 households falling in the category, the $200,000+ income range is the most frequent in Silver Gate, accounting for 50.9% of all households.
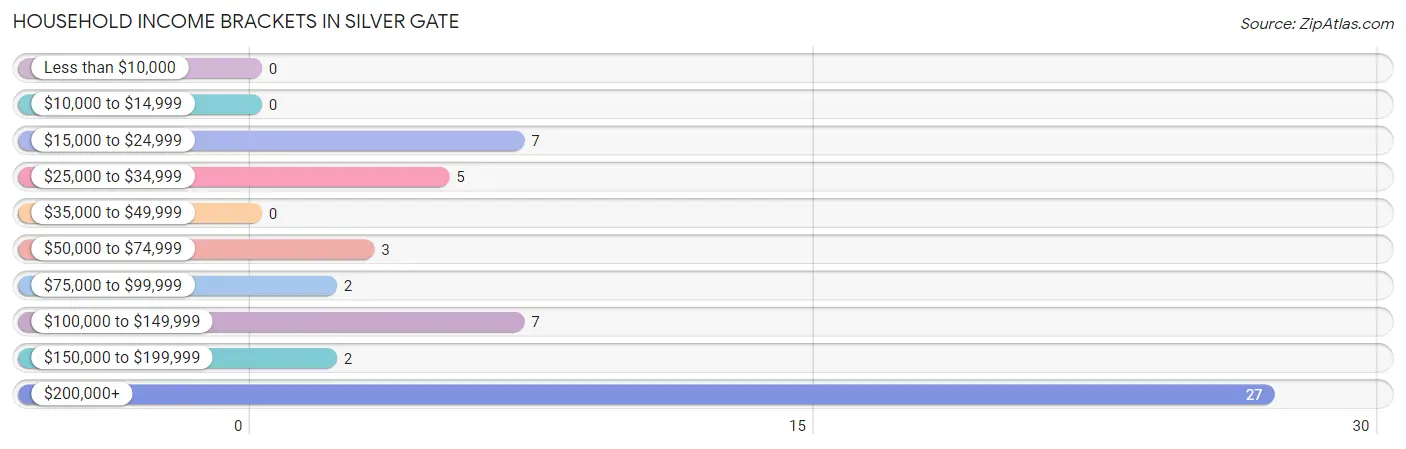
| Income Bracket | # Households | % Households |
| Less than $10,000 | 0 | 0.0% |
| $10,000 to $14,999 | 0 | 0.0% |
| $15,000 to $24,999 | 7 | 13.2% |
| $25,000 to $34,999 | 5 | 9.4% |
| $35,000 to $49,999 | 0 | 0.0% |
| $50,000 to $74,999 | 3 | 5.7% |
| $75,000 to $99,999 | 2 | 3.8% |
| $100,000 to $149,999 | 7 | 13.2% |
| $150,000 to $199,999 | 2 | 3.8% |
| $200,000+ | 27 | 50.9% |
Household Income by Householder Age in Silver Gate
The median household income in Silver Gate is $0, with the highest median household income of $31,250 found in the 65+ years age bracket for the primary householder. A total of 19 households (35.8%) fall into this category.
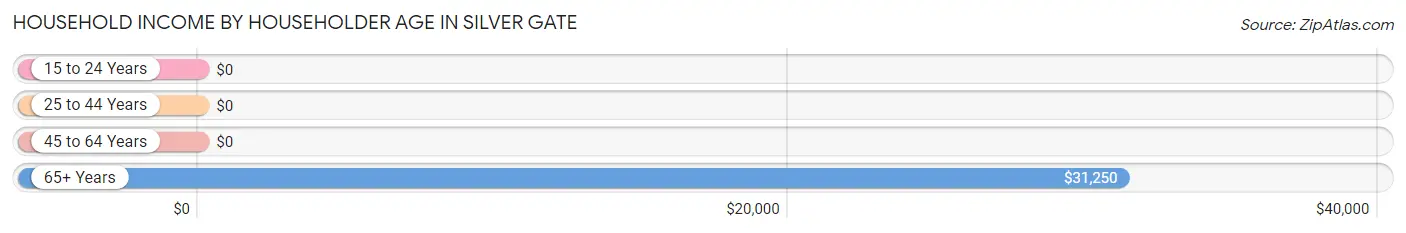
| Income Bracket | # Households | Median Income |
| 15 to 24 Years | 0 (0.0%) | $0 |
| 25 to 44 Years | 4 (7.5%) | $0 |
| 45 to 64 Years | 30 (56.6%) | $0 |
| 65+ Years | 19 (35.8%) | $31,250 |
| Total | 53 (100.0%) | $0 |
Poverty in Silver Gate
Income Below Poverty by Sex and Age in Silver Gate
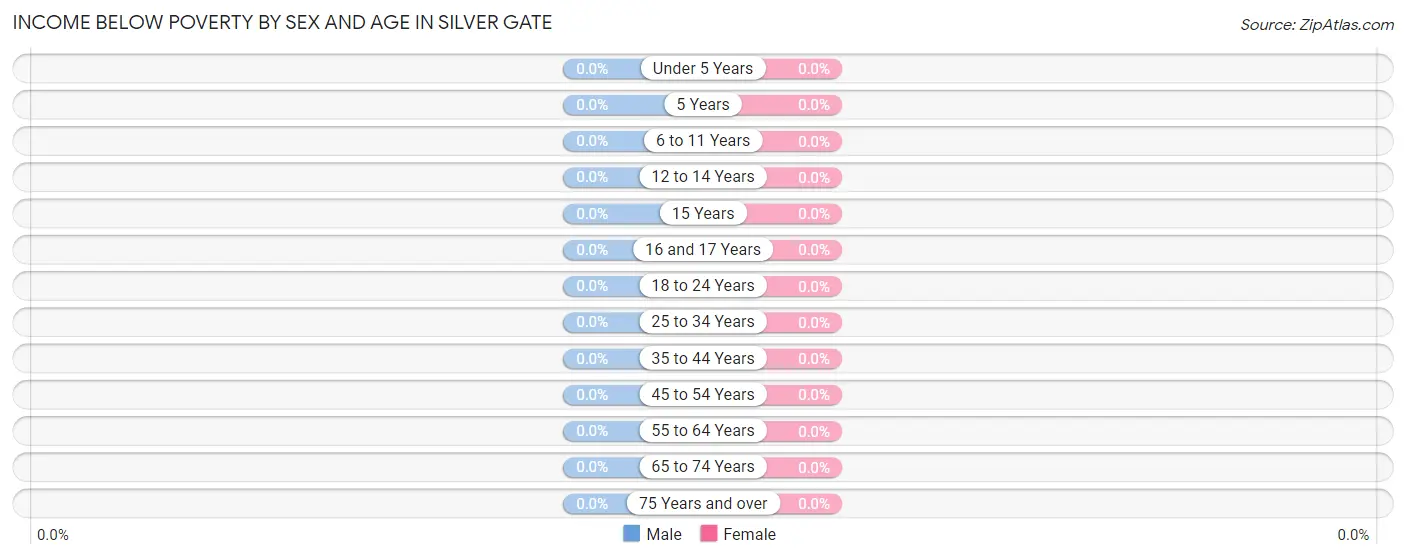
| Age Bracket | Male | Female |
| Under 5 Years | 0 (0.0%) | 0 (0.0%) |
| 5 Years | 0 (0.0%) | 0 (0.0%) |
| 6 to 11 Years | 0 (0.0%) | 0 (0.0%) |
| 12 to 14 Years | 0 (0.0%) | 0 (0.0%) |
| 15 Years | 0 (0.0%) | 0 (0.0%) |
| 16 and 17 Years | 0 (0.0%) | 0 (0.0%) |
| 18 to 24 Years | 0 (0.0%) | 0 (0.0%) |
| 25 to 34 Years | 0 (0.0%) | 0 (0.0%) |
| 35 to 44 Years | 0 (0.0%) | 0 (0.0%) |
| 45 to 54 Years | 0 (0.0%) | 0 (0.0%) |
| 55 to 64 Years | 0 (0.0%) | 0 (0.0%) |
| 65 to 74 Years | 0 (0.0%) | 0 (0.0%) |
| 75 Years and over | 0 (0.0%) | 0 (0.0%) |
| Total | 0 (0.0%) | 0 (0.0%) |
Income Above Poverty by Sex and Age in Silver Gate
According to the poverty statistics in Silver Gate, males aged 6 to 11 years and females aged 5 years are the age groups that are most secure financially, with 100.0% of males and 100.0% of females in these age groups living above the poverty line.
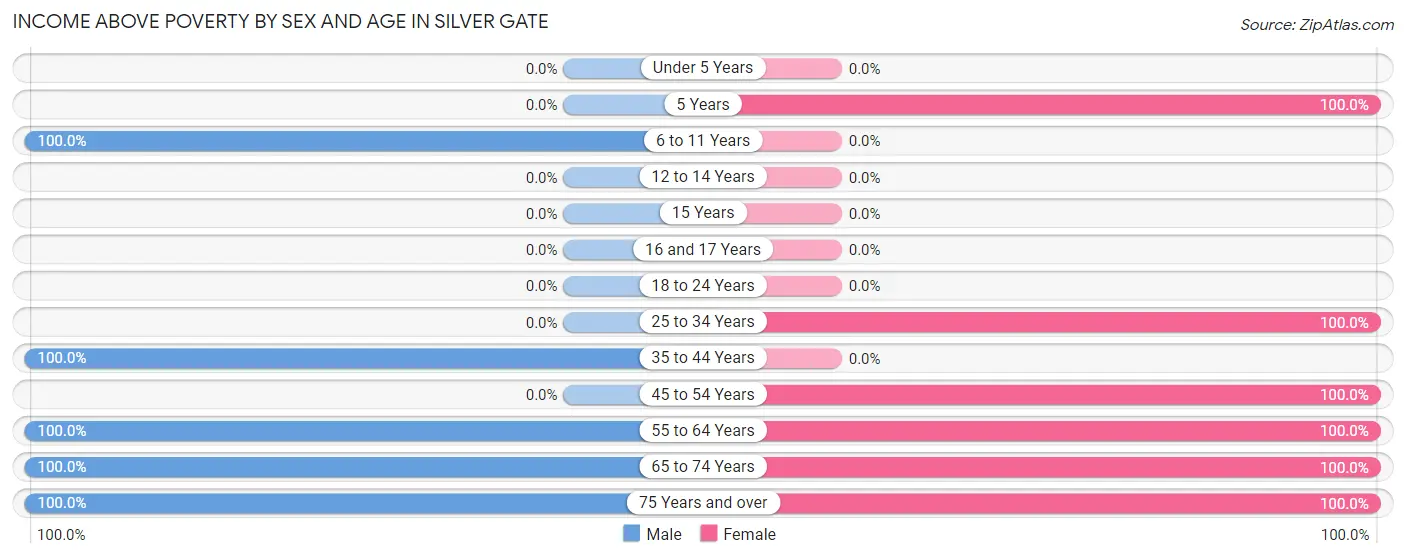
| Age Bracket | Male | Female |
| Under 5 Years | 0 (0.0%) | 0 (0.0%) |
| 5 Years | 0 (0.0%) | 6 (100.0%) |
| 6 to 11 Years | 7 (100.0%) | 0 (0.0%) |
| 12 to 14 Years | 0 (0.0%) | 0 (0.0%) |
| 15 Years | 0 (0.0%) | 0 (0.0%) |
| 16 and 17 Years | 0 (0.0%) | 0 (0.0%) |
| 18 to 24 Years | 0 (0.0%) | 0 (0.0%) |
| 25 to 34 Years | 0 (0.0%) | 2 (100.0%) |
| 35 to 44 Years | 11 (100.0%) | 0 (0.0%) |
| 45 to 54 Years | 0 (0.0%) | 7 (100.0%) |
| 55 to 64 Years | 30 (100.0%) | 29 (100.0%) |
| 65 to 74 Years | 15 (100.0%) | 1 (100.0%) |
| 75 Years and over | 2 (100.0%) | 4 (100.0%) |
| Total | 65 (100.0%) | 49 (100.0%) |
Income Below Poverty Among Married-Couple Families in Silver Gate
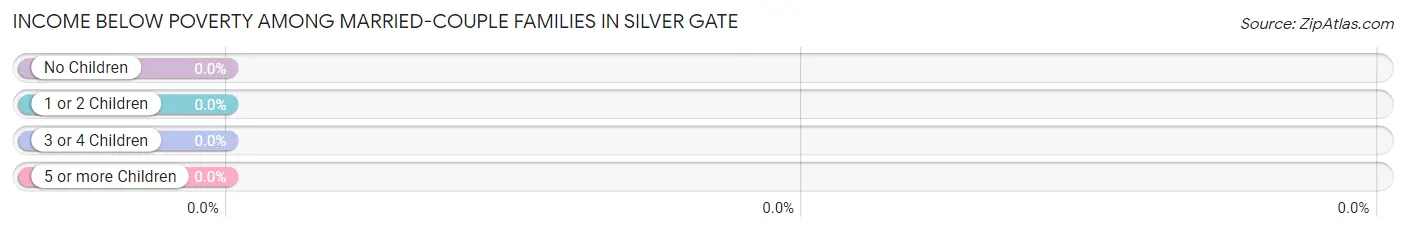
| Children | Above Poverty | Below Poverty |
| No Children | 35 (100.0%) | 0 (0.0%) |
| 1 or 2 Children | 7 (100.0%) | 0 (0.0%) |
| 3 or 4 Children | 0 (0.0%) | 0 (0.0%) |
| 5 or more Children | 0 (0.0%) | 0 (0.0%) |
| Total | 42 (100.0%) | 0 (0.0%) |
Income Below Poverty Among Single-Parent Households in Silver Gate
| Children | Single Father | Single Mother |
| No Children | 0 (0.0%) | 0 (0.0%) |
| 1 or 2 Children | 0 (0.0%) | 0 (0.0%) |
| 3 or 4 Children | 0 (0.0%) | 0 (0.0%) |
| 5 or more Children | 0 (0.0%) | 0 (0.0%) |
| Total | 0 (0.0%) | 0 (0.0%) |
Income Below Poverty Among Married-Couple vs Single-Parent Households in Silver Gate
| Children | Married-Couple Families | Single-Parent Households |
| No Children | 0 (0.0%) | 0 (0.0%) |
| 1 or 2 Children | 0 (0.0%) | 0 (0.0%) |
| 3 or 4 Children | 0 (0.0%) | 0 (0.0%) |
| 5 or more Children | 0 (0.0%) | 0 (0.0%) |
| Total | 0 (0.0%) | 0 (0.0%) |
Race in Silver Gate
The most populous races in Silver Gate are White / Caucasian (114 | 100.0%), and Hispanic or Latino (2 | 1.8%).
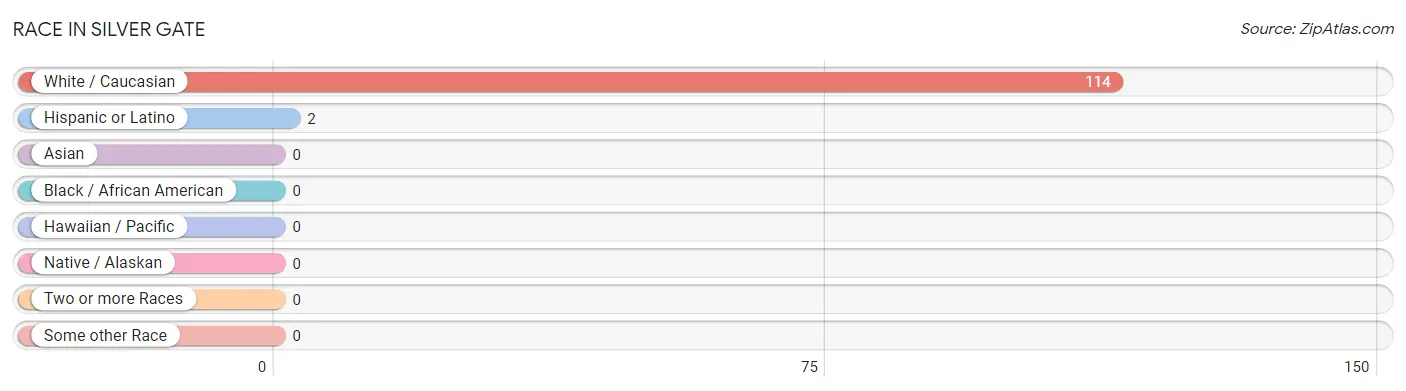
| Race | # Population | % Population |
| Asian | 0 | 0.0% |
| Black / African American | 0 | 0.0% |
| Hawaiian / Pacific | 0 | 0.0% |
| Hispanic or Latino | 2 | 1.8% |
| Native / Alaskan | 0 | 0.0% |
| White / Caucasian | 114 | 100.0% |
| Two or more Races | 0 | 0.0% |
| Some other Race | 0 | 0.0% |
| Total | 114 | 100.0% |
Ancestry in Silver Gate
The most populous ancestries reported in Silver Gate are German (25 | 21.9%), Italian (20 | 17.5%), Polish (20 | 17.5%), Irish (13 | 11.4%), and Norwegian (8 | 7.0%), together accounting for 75.4% of all Silver Gate residents.
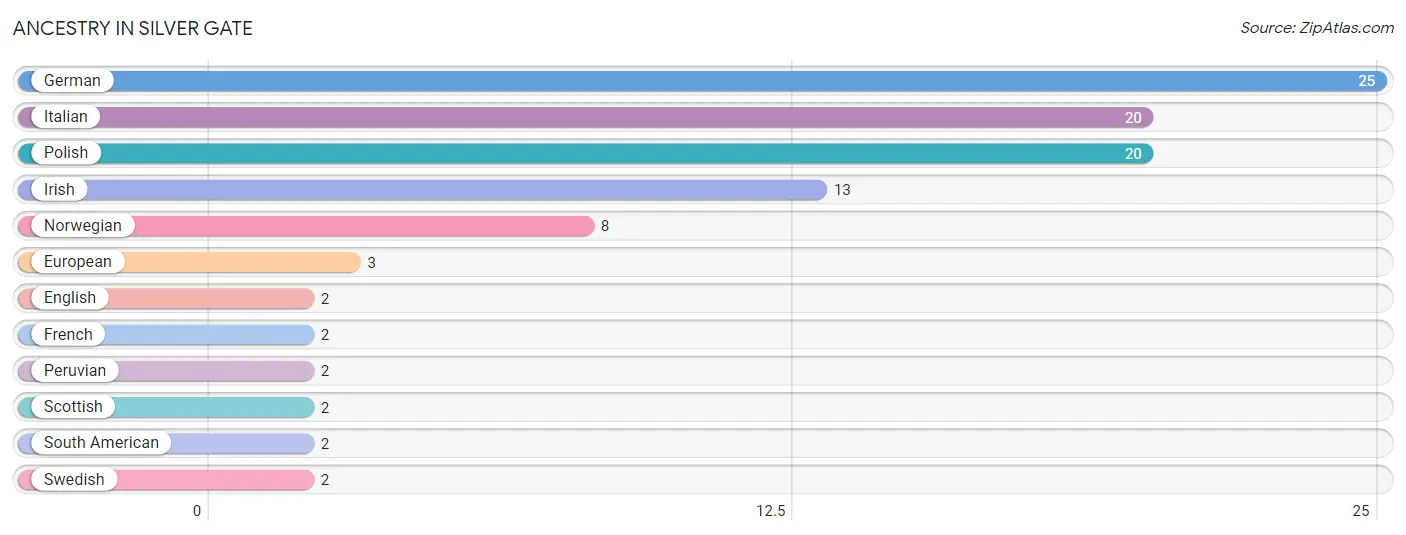
| Ancestry | # Population | % Population |
| English | 2 | 1.8% |
| European | 3 | 2.6% |
| French | 2 | 1.8% |
| German | 25 | 21.9% |
| Irish | 13 | 11.4% |
| Italian | 20 | 17.5% |
| Norwegian | 8 | 7.0% |
| Peruvian | 2 | 1.8% |
| Polish | 20 | 17.5% |
| Scottish | 2 | 1.8% |
| South American | 2 | 1.8% |
| Swedish | 2 | 1.8% | View All 12 Rows |
Immigrants in Silver Gate

| Immigration Origin | # Population | % Population | View All 0 Rows |
Sex and Age in Silver Gate
Sex and Age in Silver Gate
The most populous age groups in Silver Gate are 55 to 59 Years (30 | 46.2%) for men and 55 to 59 Years (23 | 46.9%) for women.
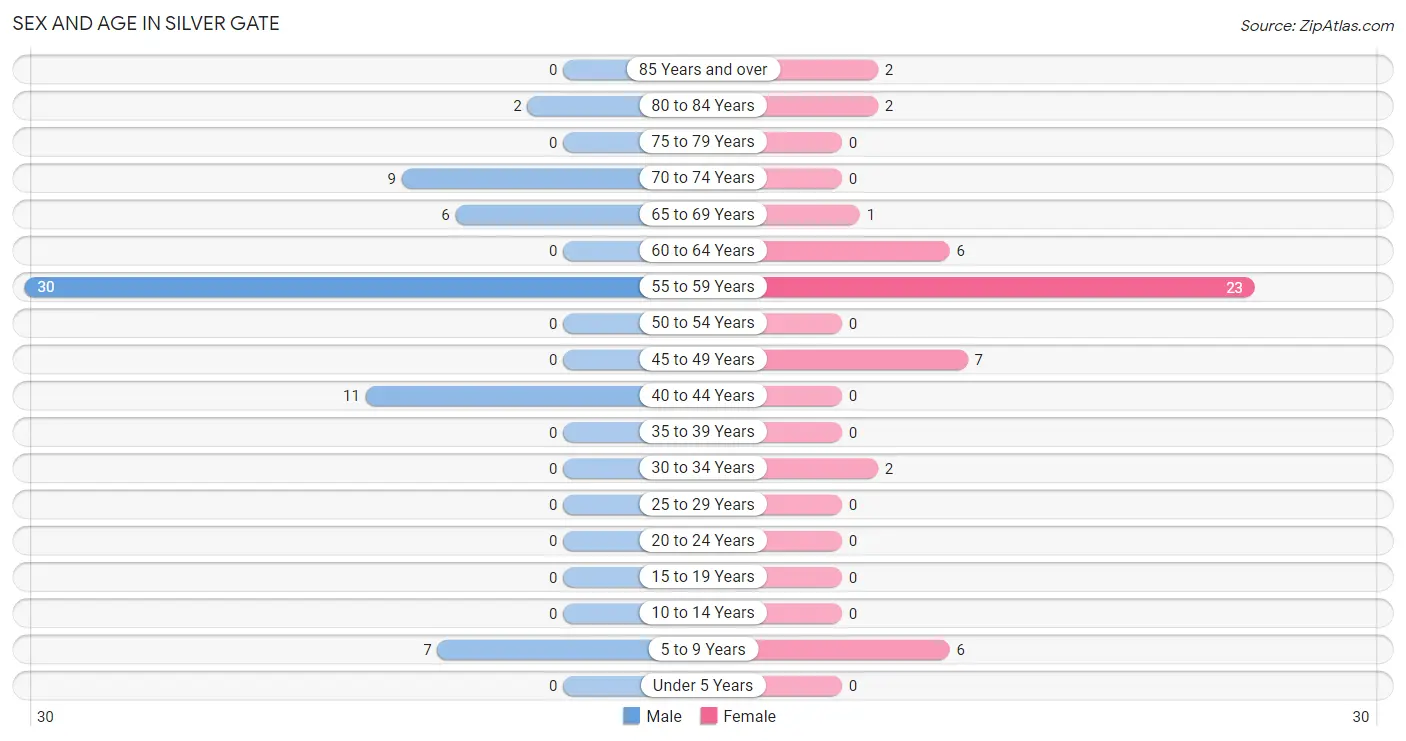
| Age Bracket | Male | Female |
| Under 5 Years | 0 (0.0%) | 0 (0.0%) |
| 5 to 9 Years | 7 (10.8%) | 6 (12.2%) |
| 10 to 14 Years | 0 (0.0%) | 0 (0.0%) |
| 15 to 19 Years | 0 (0.0%) | 0 (0.0%) |
| 20 to 24 Years | 0 (0.0%) | 0 (0.0%) |
| 25 to 29 Years | 0 (0.0%) | 0 (0.0%) |
| 30 to 34 Years | 0 (0.0%) | 2 (4.1%) |
| 35 to 39 Years | 0 (0.0%) | 0 (0.0%) |
| 40 to 44 Years | 11 (16.9%) | 0 (0.0%) |
| 45 to 49 Years | 0 (0.0%) | 7 (14.3%) |
| 50 to 54 Years | 0 (0.0%) | 0 (0.0%) |
| 55 to 59 Years | 30 (46.2%) | 23 (46.9%) |
| 60 to 64 Years | 0 (0.0%) | 6 (12.2%) |
| 65 to 69 Years | 6 (9.2%) | 1 (2.0%) |
| 70 to 74 Years | 9 (13.9%) | 0 (0.0%) |
| 75 to 79 Years | 0 (0.0%) | 0 (0.0%) |
| 80 to 84 Years | 2 (3.1%) | 2 (4.1%) |
| 85 Years and over | 0 (0.0%) | 2 (4.1%) |
| Total | 65 (100.0%) | 49 (100.0%) |
Families and Households in Silver Gate
Median Family Size in Silver Gate
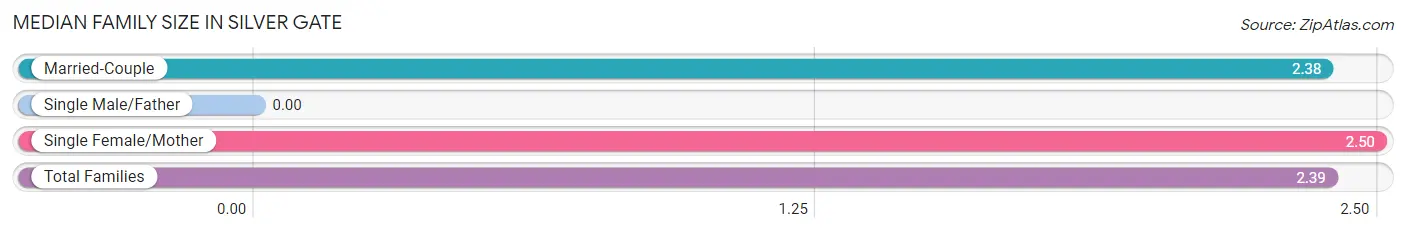
| Family Type | # Families | Family Size |
| Married-Couple | 42 (95.5%) | 2.38 |
| Single Male/Father | 0 (0.0%) | - |
| Single Female/Mother | 2 (4.5%) | 2.50 |
| Total Families | 44 (100.0%) | 2.39 |
Median Household Size in Silver Gate
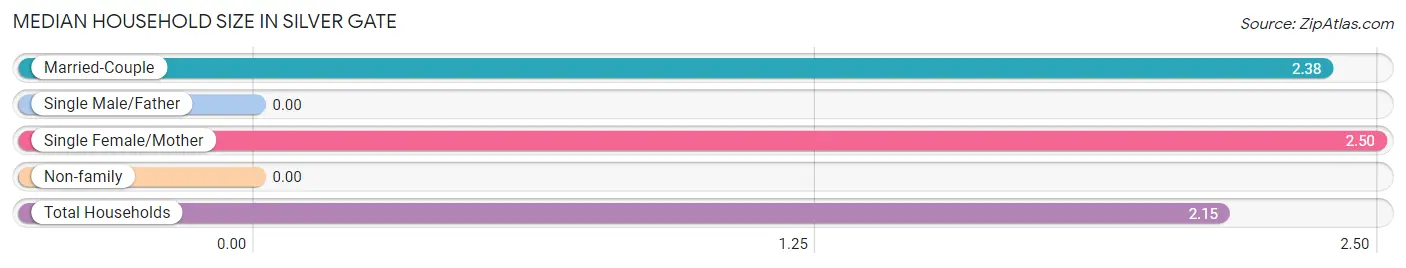
| Household Type | # Households | Household Size |
| Married-Couple | 42 (79.2%) | 2.38 |
| Single Male/Father | 0 (0.0%) | - |
| Single Female/Mother | 2 (3.8%) | 2.50 |
| Non-family | 9 (17.0%) | - |
| Total Households | 53 (100.0%) | 2.15 |
Household Size by Marriage Status in Silver Gate
Out of a total of 53 households in Silver Gate, 44 (83.0%) are family households, while 9 (17.0%) are nonfamily households. The most numerous type of family households are 2-person households, comprising 37, and the most common type of nonfamily households are 1-person households, comprising 9.
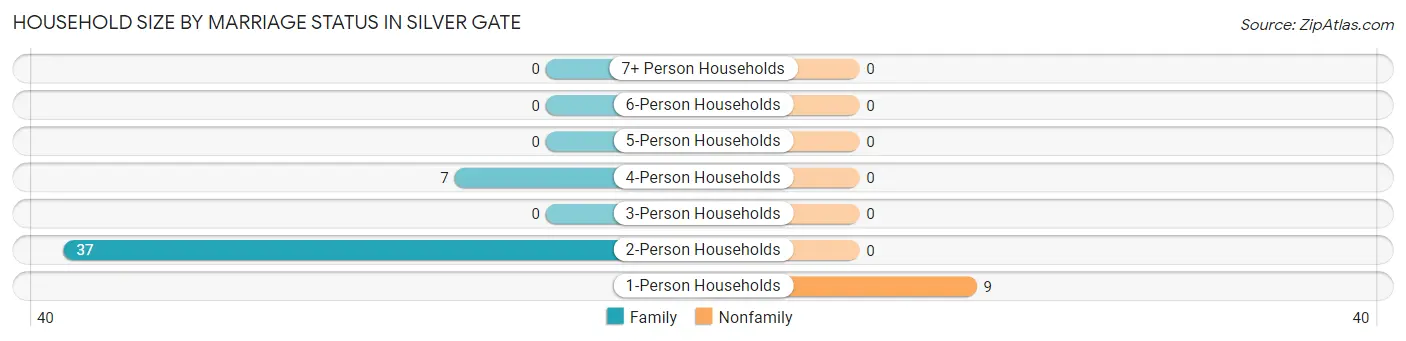
| Household Size | Family Households | Nonfamily Households |
| 1-Person Households | - | 9 (17.0%) |
| 2-Person Households | 37 (69.8%) | 0 (0.0%) |
| 3-Person Households | 0 (0.0%) | 0 (0.0%) |
| 4-Person Households | 7 (13.2%) | 0 (0.0%) |
| 5-Person Households | 0 (0.0%) | 0 (0.0%) |
| 6-Person Households | 0 (0.0%) | 0 (0.0%) |
| 7+ Person Households | 0 (0.0%) | 0 (0.0%) |
| Total | 44 (83.0%) | 9 (17.0%) |
Female Fertility in Silver Gate
Fertility by Age in Silver Gate
| Age Bracket | Women with Births | Births / 1,000 Women |
| 15 to 19 years | 0 (0.0%) | 0.0 |
| 20 to 34 years | 0 (0.0%) | 0.0 |
| 35 to 50 years | 0 (0.0%) | 0.0 |
| Total | 0 (0.0%) | 0.0 |
Fertility by Age by Marriage Status in Silver Gate
| Age Bracket | Married | Unmarried |
| 15 to 19 years | 0 (0.0%) | 0 (0.0%) |
| 20 to 34 years | 0 (0.0%) | 0 (0.0%) |
| 35 to 50 years | 0 (0.0%) | 0 (0.0%) |
| Total | 0 (0.0%) | 0 (0.0%) |
Fertility by Education in Silver Gate
| Educational Attainment | Women with Births | Births / 1,000 Women |
| Less than High School | 0 (0.0%) | 0.0 |
| High School Diploma | 0 (0.0%) | 0.0 |
| College or Associate's Degree | 0 (0.0%) | 0.0 |
| Bachelor's Degree | 0 (0.0%) | 0.0 |
| Graduate Degree | 0 (0.0%) | 0.0 |
| Total | 0 (0.0%) | 0.0 |
Fertility by Education by Marriage Status in Silver Gate
| Educational Attainment | Married | Unmarried |
| Less than High School | 0 (0.0%) | 0 (0.0%) |
| High School Diploma | 0 (0.0%) | 0 (0.0%) |
| College or Associate's Degree | 0 (0.0%) | 0 (0.0%) |
| Bachelor's Degree | 0 (0.0%) | 0 (0.0%) |
| Graduate Degree | 0 (0.0%) | 0 (0.0%) |
| Total | 0 (0.0%) | 0 (0.0%) |
Employment Characteristics in Silver Gate
Employment by Class of Employer in Silver Gate
Among the 51 employed individuals in Silver Gate, private company employees (48 | 94.1%), and self-employed (not incorporated) (3 | 5.9%) make up the most common classes of employment.
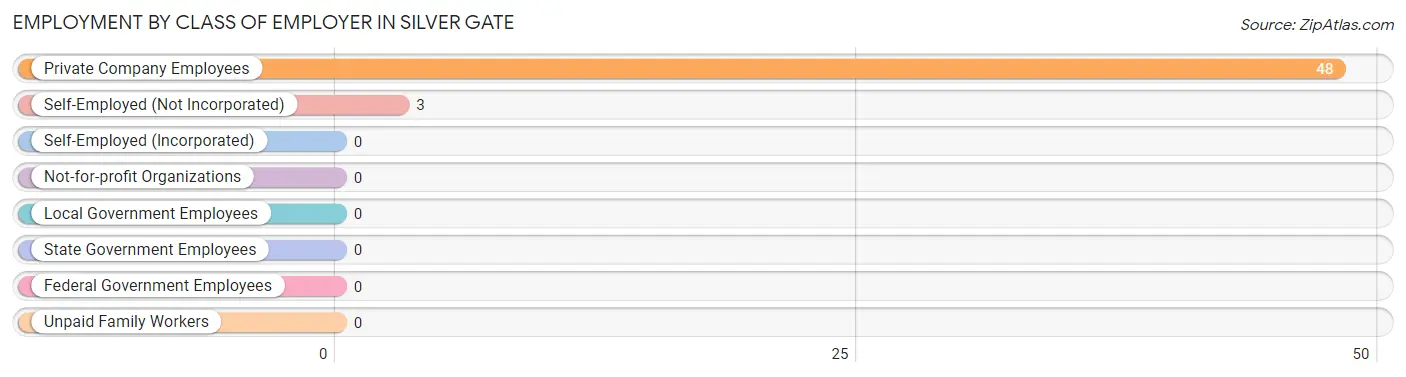
| Employer Class | # Employees | % Employees |
| Private Company Employees | 48 | 94.1% |
| Self-Employed (Incorporated) | 0 | 0.0% |
| Self-Employed (Not Incorporated) | 3 | 5.9% |
| Not-for-profit Organizations | 0 | 0.0% |
| Local Government Employees | 0 | 0.0% |
| State Government Employees | 0 | 0.0% |
| Federal Government Employees | 0 | 0.0% |
| Unpaid Family Workers | 0 | 0.0% |
| Total | 51 | 100.0% |
Employment Status by Age in Silver Gate
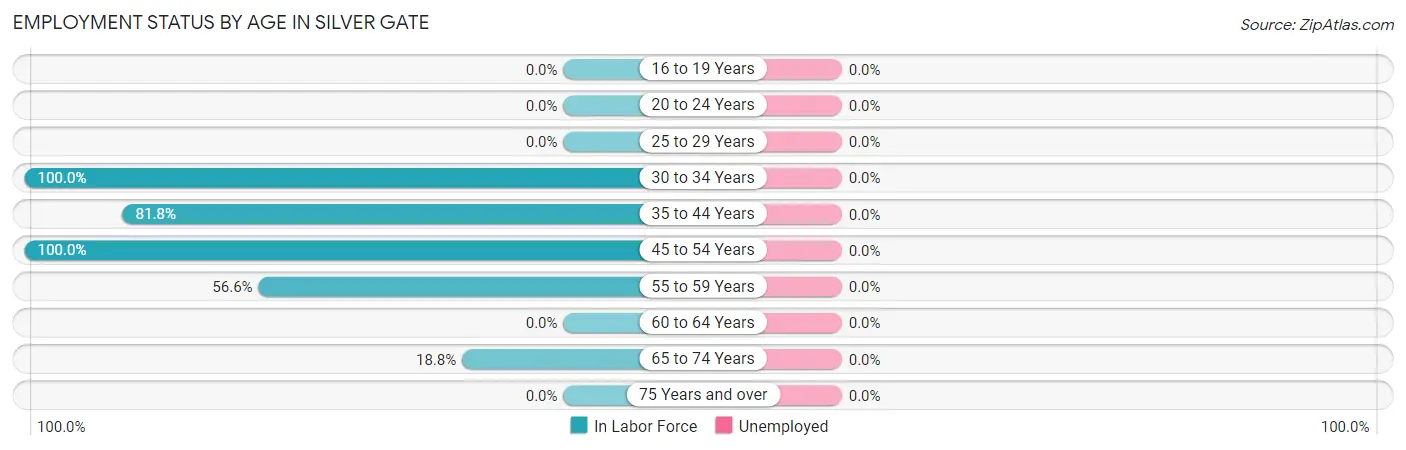
| Age Bracket | In Labor Force | Unemployed |
| 16 to 19 Years | 0 (0.0%) | 0 (0.0%) |
| 20 to 24 Years | 0 (0.0%) | 0 (0.0%) |
| 25 to 29 Years | 0 (0.0%) | 0 (0.0%) |
| 30 to 34 Years | 2 (100.0%) | 0 (0.0%) |
| 35 to 44 Years | 9 (81.8%) | 0 (0.0%) |
| 45 to 54 Years | 7 (100.0%) | 0 (0.0%) |
| 55 to 59 Years | 30 (56.6%) | 0 (0.0%) |
| 60 to 64 Years | 0 (0.0%) | 0 (0.0%) |
| 65 to 74 Years | 3 (18.8%) | 0 (0.0%) |
| 75 Years and over | 0 (0.0%) | 0 (0.0%) |
| Total | 51 (50.5%) | 0 (0.0%) |
Employment Status by Educational Attainment in Silver Gate
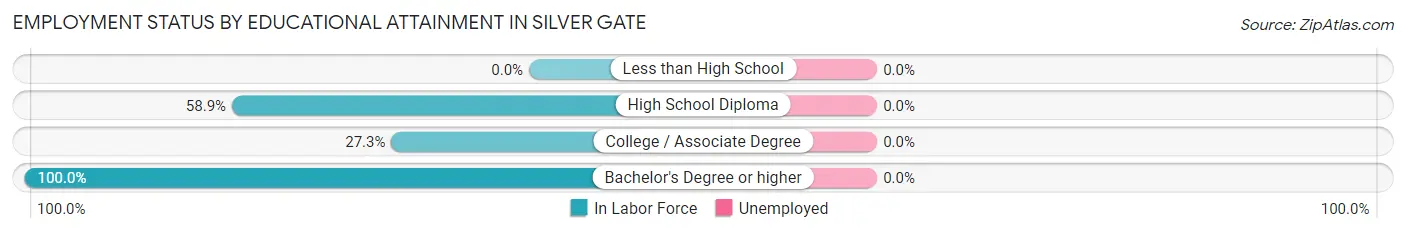
| Educational Attainment | In Labor Force | Unemployed |
| Less than High School | 0 (0.0%) | 0 (0.0%) |
| High School Diploma | 33 (58.9%) | 0 (0.0%) |
| College / Associate Degree | 3 (27.3%) | 0 (0.0%) |
| Bachelor's Degree or higher | 12 (100.0%) | 0 (0.0%) |
| Total | 48 (60.8%) | 0 (0.0%) |
Employment Occupations by Sex in Silver Gate
Management, Business, Science and Arts Occupations
The most common Management, Business, Science and Arts occupations in Silver Gate are Computers, Engineering & Science (29 | 56.9%), Computers & Mathematics (29 | 56.9%), and Management (9 | 17.6%).
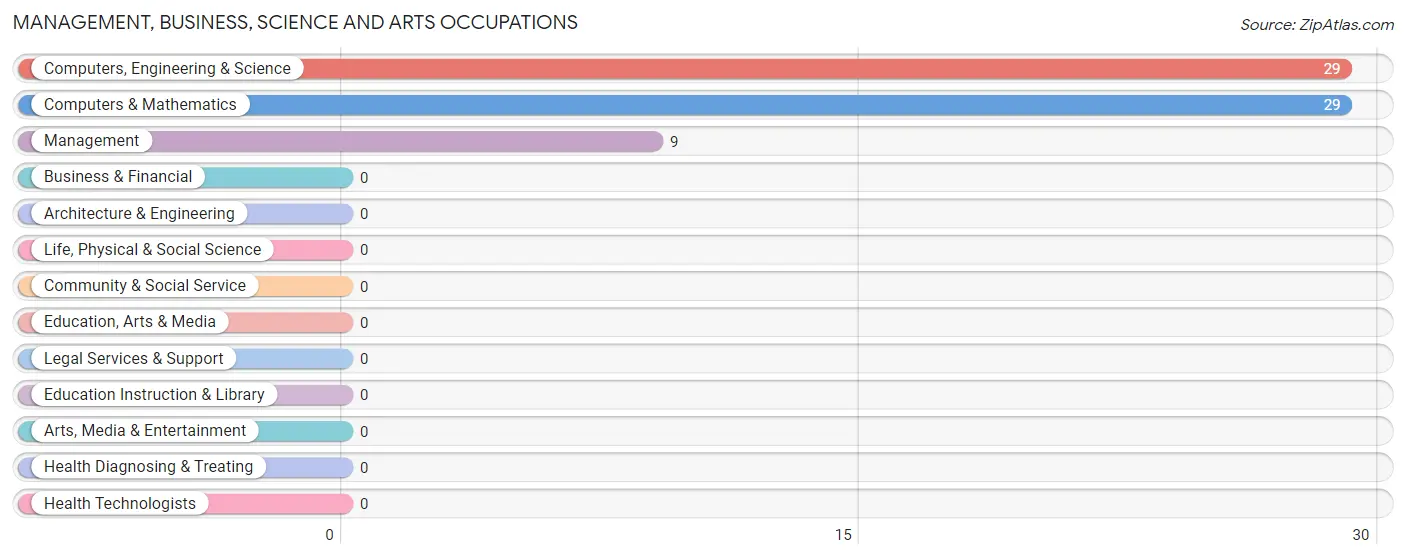
Management, Business, Science and Arts Occupations by Sex
Within the Management, Business, Science and Arts occupations in Silver Gate, the most male-oriented occupations are Management (100.0%), Computers, Engineering & Science (93.1%), and Computers & Mathematics (93.1%), while the most female-oriented occupations are Computers, Engineering & Science (6.9%), and Computers & Mathematics (6.9%).
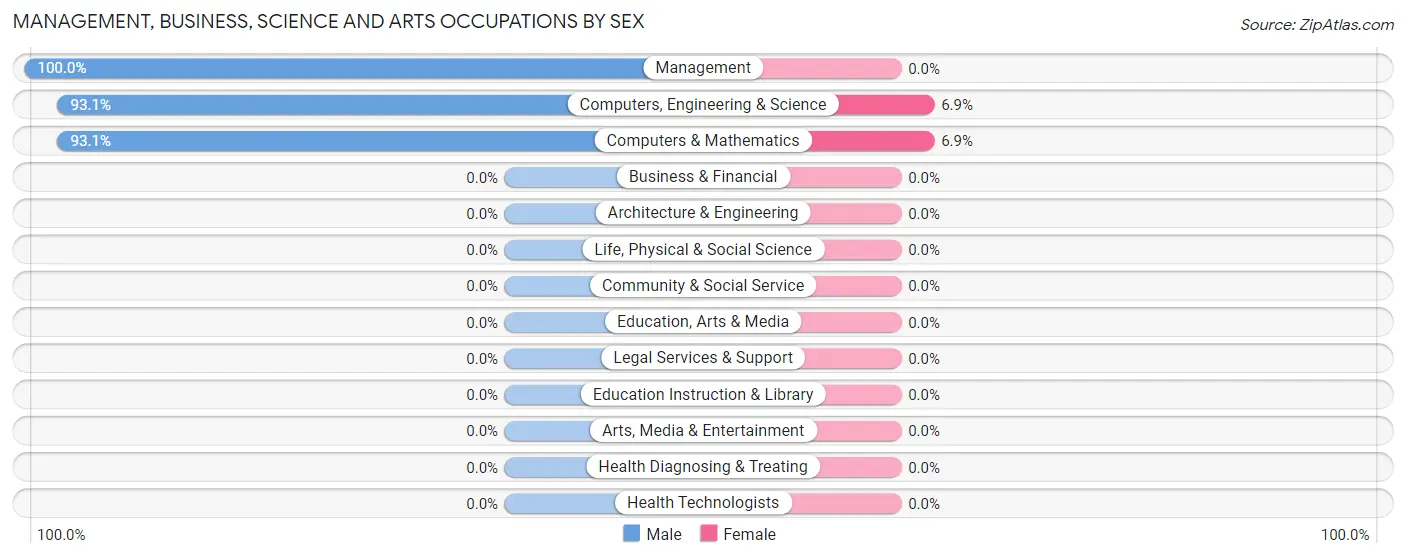
| Occupation | Male | Female |
| Management | 9 (100.0%) | 0 (0.0%) |
| Business & Financial | 0 (0.0%) | 0 (0.0%) |
| Computers, Engineering & Science | 27 (93.1%) | 2 (6.9%) |
| Computers & Mathematics | 27 (93.1%) | 2 (6.9%) |
| Architecture & Engineering | 0 (0.0%) | 0 (0.0%) |
| Life, Physical & Social Science | 0 (0.0%) | 0 (0.0%) |
| Community & Social Service | 0 (0.0%) | 0 (0.0%) |
| Education, Arts & Media | 0 (0.0%) | 0 (0.0%) |
| Legal Services & Support | 0 (0.0%) | 0 (0.0%) |
| Education Instruction & Library | 0 (0.0%) | 0 (0.0%) |
| Arts, Media & Entertainment | 0 (0.0%) | 0 (0.0%) |
| Health Diagnosing & Treating | 0 (0.0%) | 0 (0.0%) |
| Health Technologists | 0 (0.0%) | 0 (0.0%) |
| Total (Category) | 36 (94.7%) | 2 (5.3%) |
| Total (Overall) | 42 (82.4%) | 9 (17.6%) |
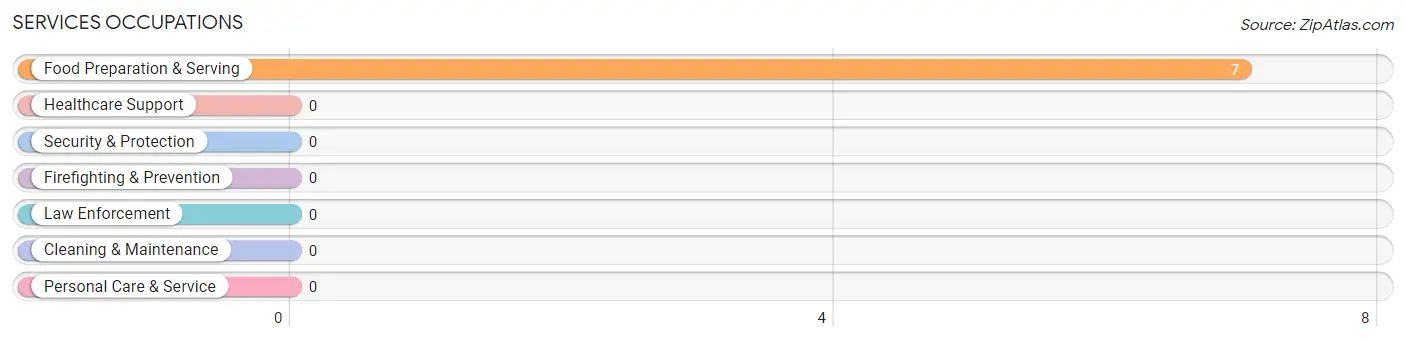
Services Occupations
The most common Services occupations in Silver Gate are , and Food Preparation & Serving (7 | 13.7%).
Services Occupations by Sex
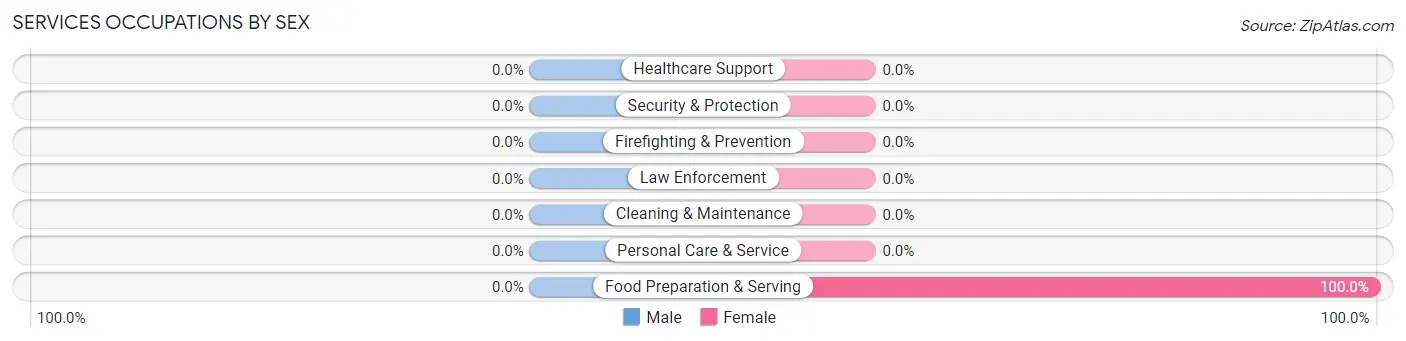
| Occupation | Male | Female |
| Healthcare Support | 0 (0.0%) | 0 (0.0%) |
| Security & Protection | 0 (0.0%) | 0 (0.0%) |
| Firefighting & Prevention | 0 (0.0%) | 0 (0.0%) |
| Law Enforcement | 0 (0.0%) | 0 (0.0%) |
| Food Preparation & Serving | 0 (0.0%) | 7 (100.0%) |
| Cleaning & Maintenance | 0 (0.0%) | 0 (0.0%) |
| Personal Care & Service | 0 (0.0%) | 0 (0.0%) |
| Total (Category) | 0 (0.0%) | 7 (100.0%) |
| Total (Overall) | 42 (82.4%) | 9 (17.6%) |
Sales and Office Occupations
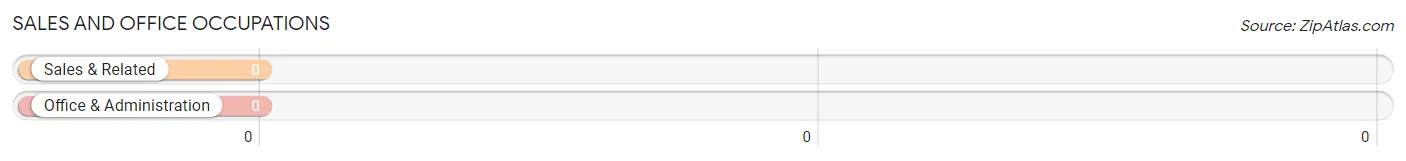
Sales and Office Occupations by Sex
| Occupation | Male | Female |
| Sales & Related | 0 (0.0%) | 0 (0.0%) |
| Office & Administration | 0 (0.0%) | 0 (0.0%) |
| Total (Category) | 0 (0.0%) | 0 (0.0%) |
| Total (Overall) | 42 (82.4%) | 9 (17.6%) |
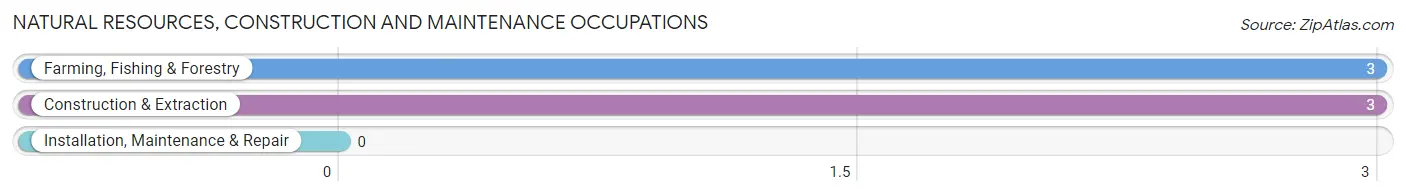
Natural Resources, Construction and Maintenance Occupations
The most common Natural Resources, Construction and Maintenance occupations in Silver Gate are Farming, Fishing & Forestry (3 | 5.9%), and Construction & Extraction (3 | 5.9%).
Natural Resources, Construction and Maintenance Occupations by Sex
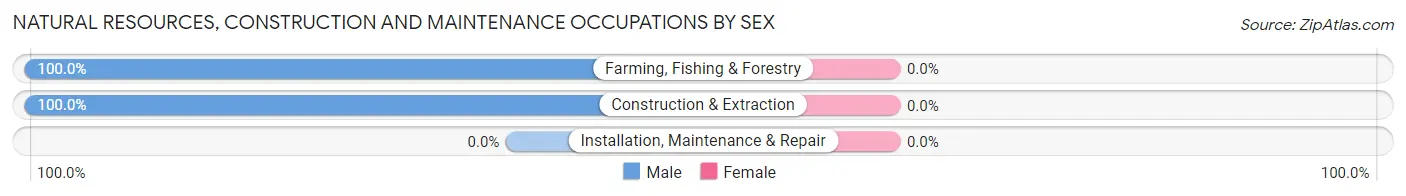
| Occupation | Male | Female |
| Farming, Fishing & Forestry | 3 (100.0%) | 0 (0.0%) |
| Construction & Extraction | 3 (100.0%) | 0 (0.0%) |
| Installation, Maintenance & Repair | 0 (0.0%) | 0 (0.0%) |
| Total (Category) | 6 (100.0%) | 0 (0.0%) |
| Total (Overall) | 42 (82.4%) | 9 (17.6%) |
Production, Transportation and Moving Occupations
Production, Transportation and Moving Occupations by Sex
| Occupation | Male | Female |
| Production | 0 (0.0%) | 0 (0.0%) |
| Transportation | 0 (0.0%) | 0 (0.0%) |
| Material Moving | 0 (0.0%) | 0 (0.0%) |
| Total (Category) | 0 (0.0%) | 0 (0.0%) |
| Total (Overall) | 42 (82.4%) | 9 (17.6%) |
Employment Industries by Sex in Silver Gate
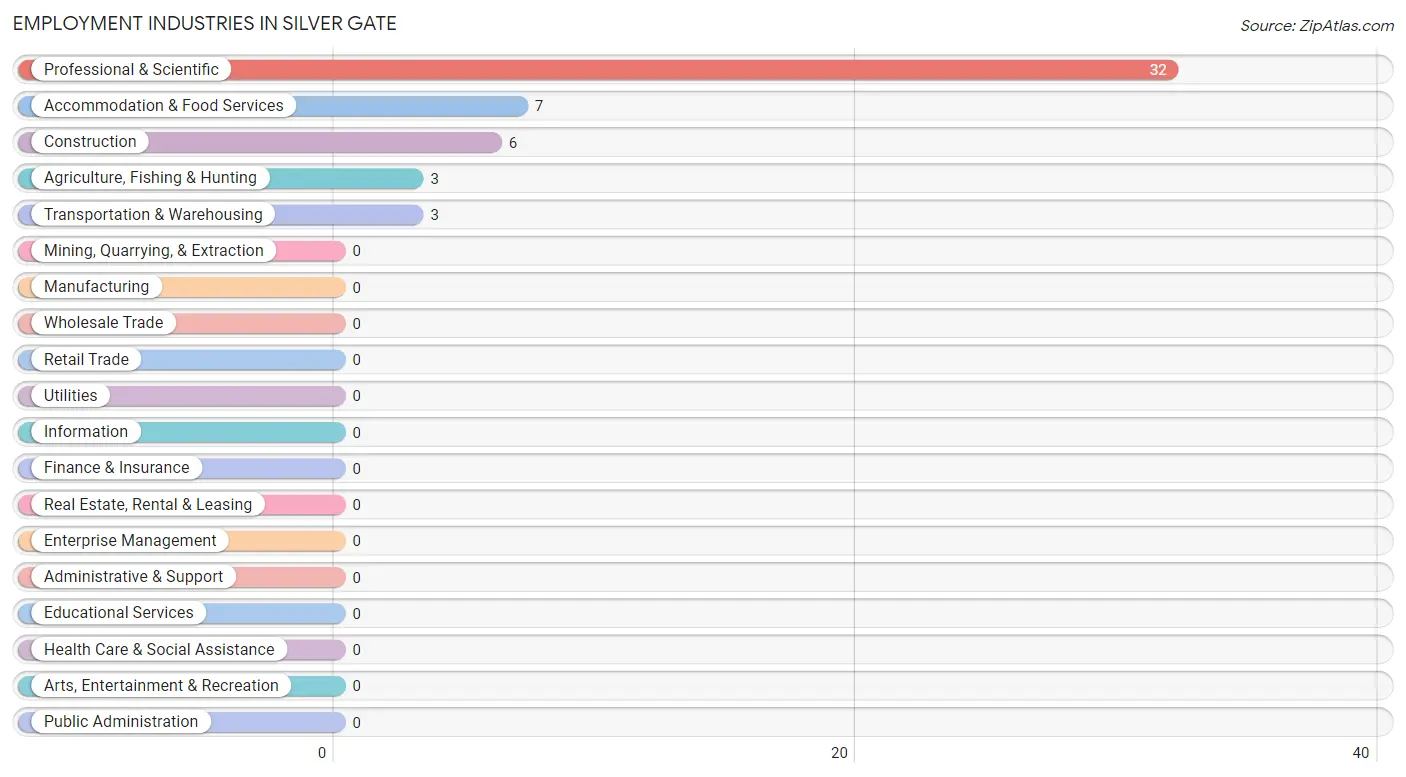
Employment Industries in Silver Gate
The major employment industries in Silver Gate include Professional & Scientific (32 | 62.7%), Accommodation & Food Services (7 | 13.7%), Construction (6 | 11.8%), Agriculture, Fishing & Hunting (3 | 5.9%), and Transportation & Warehousing (3 | 5.9%).
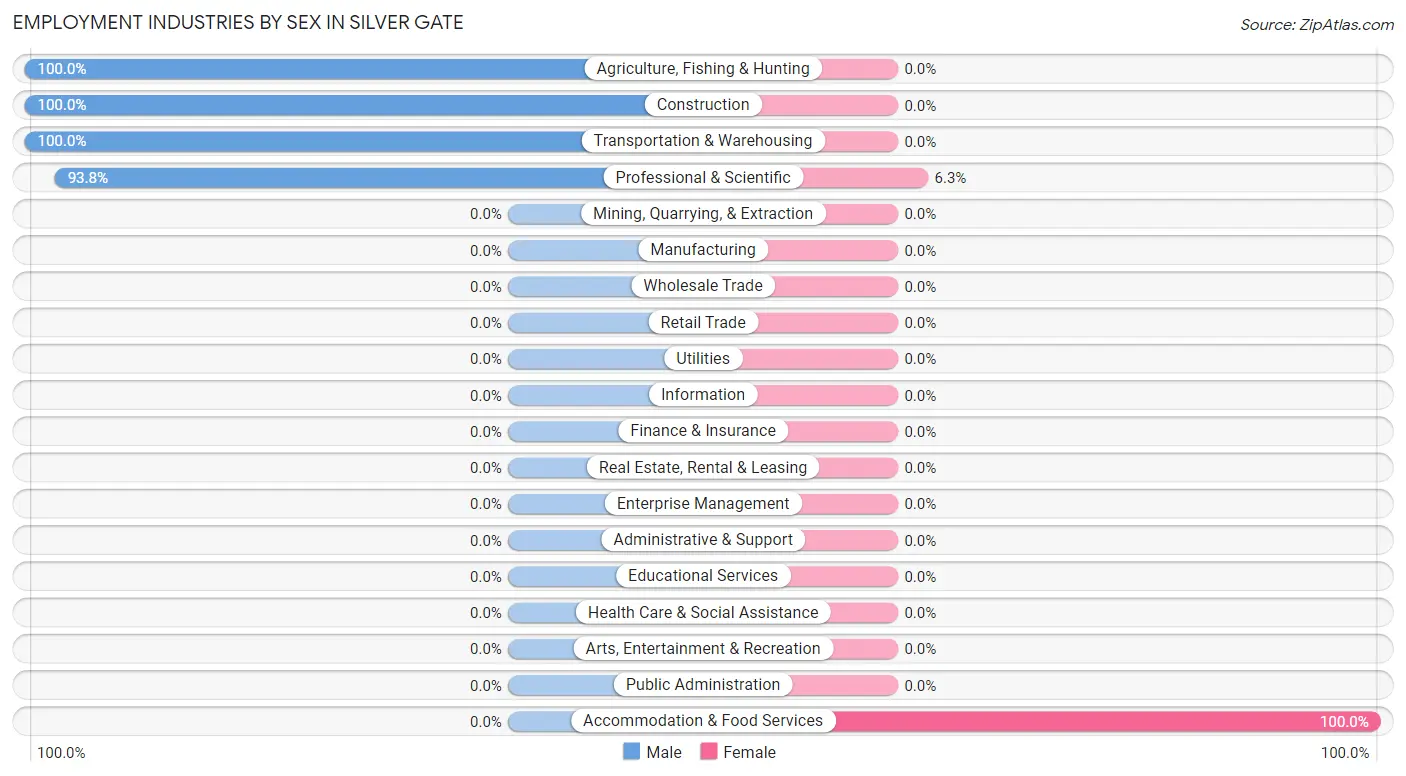
Employment Industries by Sex in Silver Gate
The Silver Gate industries that see more men than women are Agriculture, Fishing & Hunting (100.0%), Construction (100.0%), and Transportation & Warehousing (100.0%), whereas the industries that tend to have a higher number of women are Accommodation & Food Services (100.0%), and Professional & Scientific (6.2%).
| Industry | Male | Female |
| Agriculture, Fishing & Hunting | 3 (100.0%) | 0 (0.0%) |
| Mining, Quarrying, & Extraction | 0 (0.0%) | 0 (0.0%) |
| Construction | 6 (100.0%) | 0 (0.0%) |
| Manufacturing | 0 (0.0%) | 0 (0.0%) |
| Wholesale Trade | 0 (0.0%) | 0 (0.0%) |
| Retail Trade | 0 (0.0%) | 0 (0.0%) |
| Transportation & Warehousing | 3 (100.0%) | 0 (0.0%) |
| Utilities | 0 (0.0%) | 0 (0.0%) |
| Information | 0 (0.0%) | 0 (0.0%) |
| Finance & Insurance | 0 (0.0%) | 0 (0.0%) |
| Real Estate, Rental & Leasing | 0 (0.0%) | 0 (0.0%) |
| Professional & Scientific | 30 (93.8%) | 2 (6.2%) |
| Enterprise Management | 0 (0.0%) | 0 (0.0%) |
| Administrative & Support | 0 (0.0%) | 0 (0.0%) |
| Educational Services | 0 (0.0%) | 0 (0.0%) |
| Health Care & Social Assistance | 0 (0.0%) | 0 (0.0%) |
| Arts, Entertainment & Recreation | 0 (0.0%) | 0 (0.0%) |
| Accommodation & Food Services | 0 (0.0%) | 7 (100.0%) |
| Public Administration | 0 (0.0%) | 0 (0.0%) |
| Total | 42 (82.4%) | 9 (17.6%) |
Education in Silver Gate
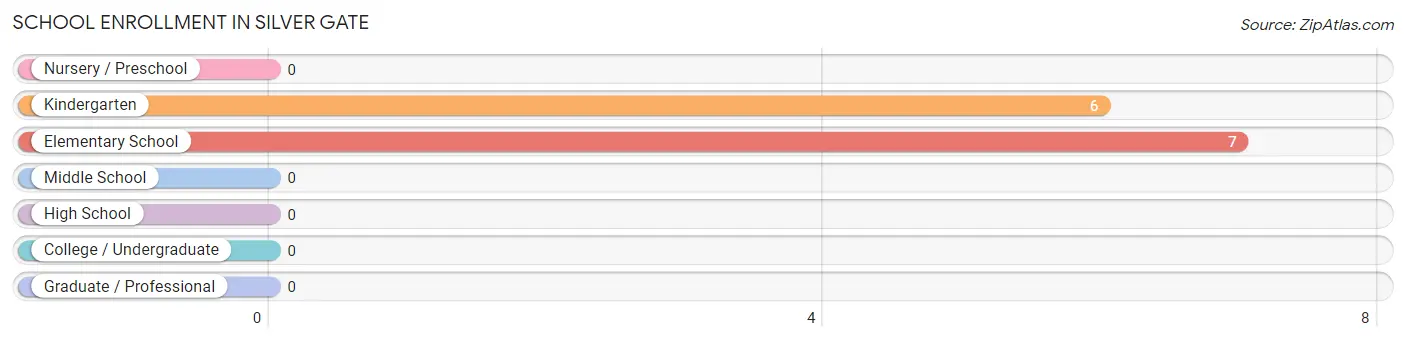
School Enrollment in Silver Gate
The most common levels of schooling among the 13 students in Silver Gate are elementary school (7 | 53.8%), and kindergarten (6 | 46.2%).
| School Level | # Students | % Students |
| Nursery / Preschool | 0 | 0.0% |
| Kindergarten | 6 | 46.2% |
| Elementary School | 7 | 53.8% |
| Middle School | 0 | 0.0% |
| High School | 0 | 0.0% |
| College / Undergraduate | 0 | 0.0% |
| Graduate / Professional | 0 | 0.0% |
| Total | 13 | 100.0% |
School Enrollment by Age by Funding Source in Silver Gate
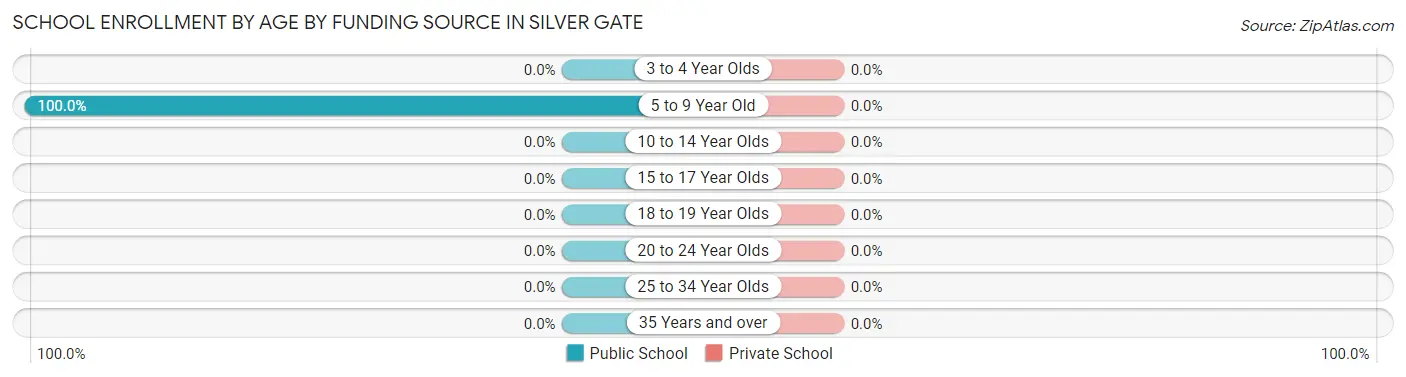
| Age Bracket | Public School | Private School |
| 3 to 4 Year Olds | 0 (0.0%) | 0 (0.0%) |
| 5 to 9 Year Old | 13 (100.0%) | 0 (0.0%) |
| 10 to 14 Year Olds | 0 (0.0%) | 0 (0.0%) |
| 15 to 17 Year Olds | 0 (0.0%) | 0 (0.0%) |
| 18 to 19 Year Olds | 0 (0.0%) | 0 (0.0%) |
| 20 to 24 Year Olds | 0 (0.0%) | 0 (0.0%) |
| 25 to 34 Year Olds | 0 (0.0%) | 0 (0.0%) |
| 35 Years and over | 0 (0.0%) | 0 (0.0%) |
| Total | 13 (100.0%) | 0 (0.0%) |
Educational Attainment by Field of Study in Silver Gate
Bio, nature & agricultural (9 | 39.1%), education (4 | 17.4%), computers & mathematics (3 | 13.0%), physical & health sciences (3 | 13.0%), and engineering (2 | 8.7%) are the most common fields of study among 23 individuals in Silver Gate who have obtained a bachelor's degree or higher.
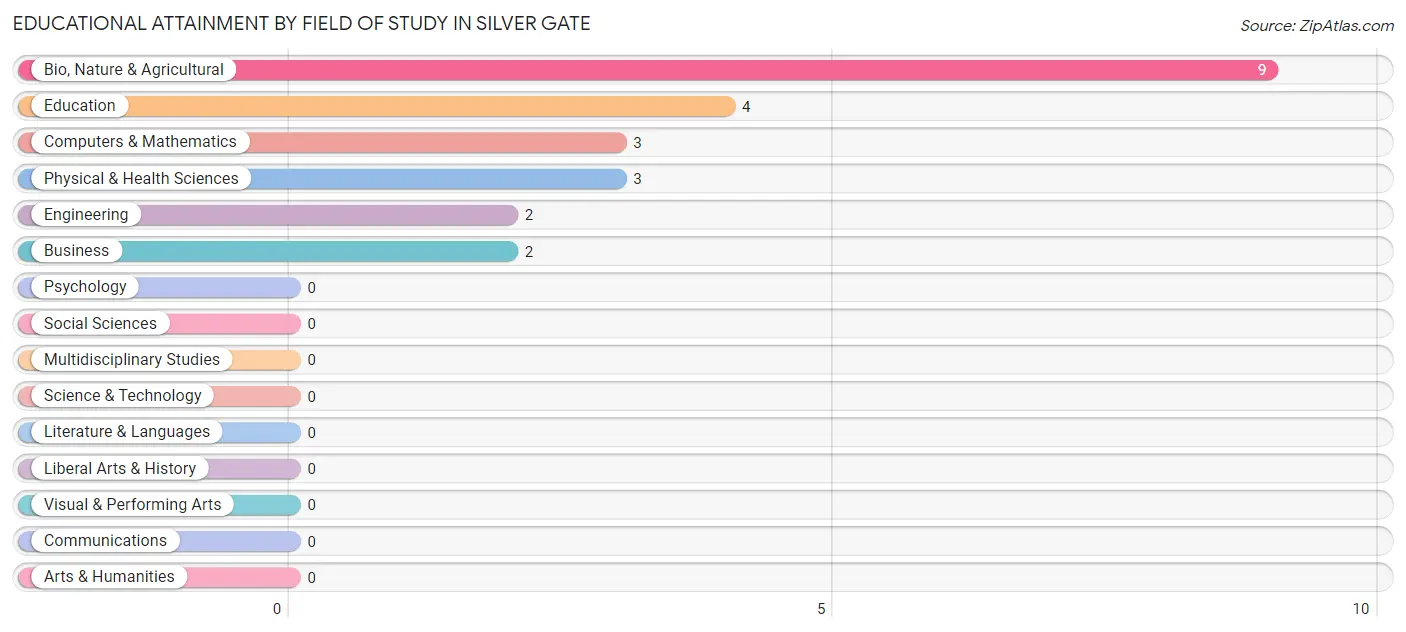
| Field of Study | # Graduates | % Graduates |
| Computers & Mathematics | 3 | 13.0% |
| Bio, Nature & Agricultural | 9 | 39.1% |
| Physical & Health Sciences | 3 | 13.0% |
| Psychology | 0 | 0.0% |
| Social Sciences | 0 | 0.0% |
| Engineering | 2 | 8.7% |
| Multidisciplinary Studies | 0 | 0.0% |
| Science & Technology | 0 | 0.0% |
| Business | 2 | 8.7% |
| Education | 4 | 17.4% |
| Literature & Languages | 0 | 0.0% |
| Liberal Arts & History | 0 | 0.0% |
| Visual & Performing Arts | 0 | 0.0% |
| Communications | 0 | 0.0% |
| Arts & Humanities | 0 | 0.0% |
| Total | 23 | 100.0% |
Transportation & Commute in Silver Gate
Vehicle Availability by Sex in Silver Gate
The most prevalent vehicle ownership categories in Silver Gate are males with 2 vehicles (39, accounting for 92.9%) and females with 2 vehicles (7, making up 433.3%).
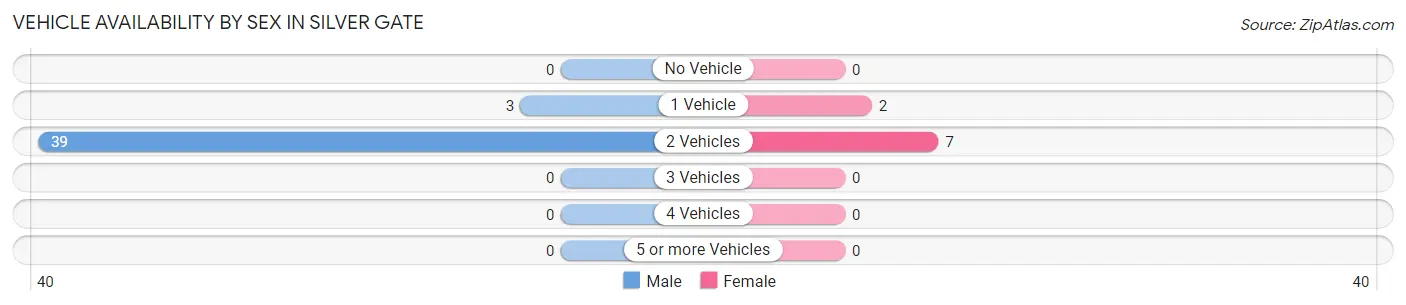
| Vehicles Available | Male | Female |
| No Vehicle | 0 (0.0%) | 0 (0.0%) |
| 1 Vehicle | 3 (7.1%) | 2 (22.2%) |
| 2 Vehicles | 39 (92.9%) | 7 (77.8%) |
| 3 Vehicles | 0 (0.0%) | 0 (0.0%) |
| 4 Vehicles | 0 (0.0%) | 0 (0.0%) |
| 5 or more Vehicles | 0 (0.0%) | 0 (0.0%) |
| Total | 42 (100.0%) | 9 (100.0%) |
Commute Time in Silver Gate
The most frequently occuring commute durations in Silver Gate are 15 to 19 minutes (9 commuters, 47.4%), less than 5 minutes (7 commuters, 36.8%), and 30 to 34 minutes (3 commuters, 15.8%).
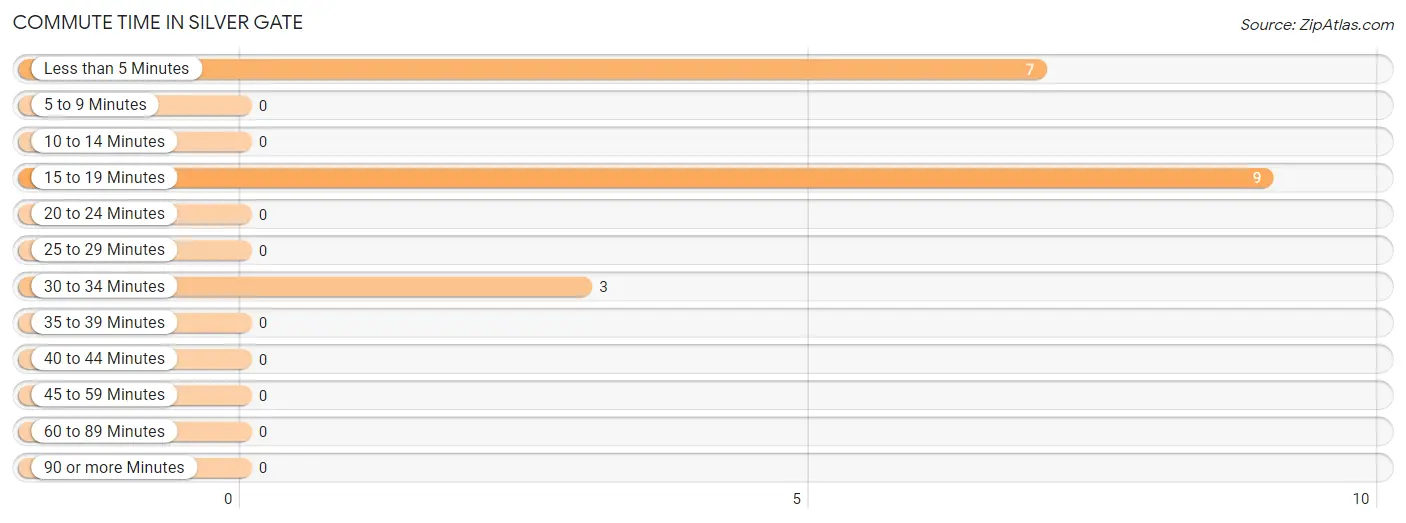
| Commute Time | # Commuters | % Commuters |
| Less than 5 Minutes | 7 | 36.8% |
| 5 to 9 Minutes | 0 | 0.0% |
| 10 to 14 Minutes | 0 | 0.0% |
| 15 to 19 Minutes | 9 | 47.4% |
| 20 to 24 Minutes | 0 | 0.0% |
| 25 to 29 Minutes | 0 | 0.0% |
| 30 to 34 Minutes | 3 | 15.8% |
| 35 to 39 Minutes | 0 | 0.0% |
| 40 to 44 Minutes | 0 | 0.0% |
| 45 to 59 Minutes | 0 | 0.0% |
| 60 to 89 Minutes | 0 | 0.0% |
| 90 or more Minutes | 0 | 0.0% |
Commute Time by Sex in Silver Gate
The most common commute times in Silver Gate are 15 to 19 minutes (9 commuters, 75.0%) for males and less than 5 minutes (7 commuters, 100.0%) for females.
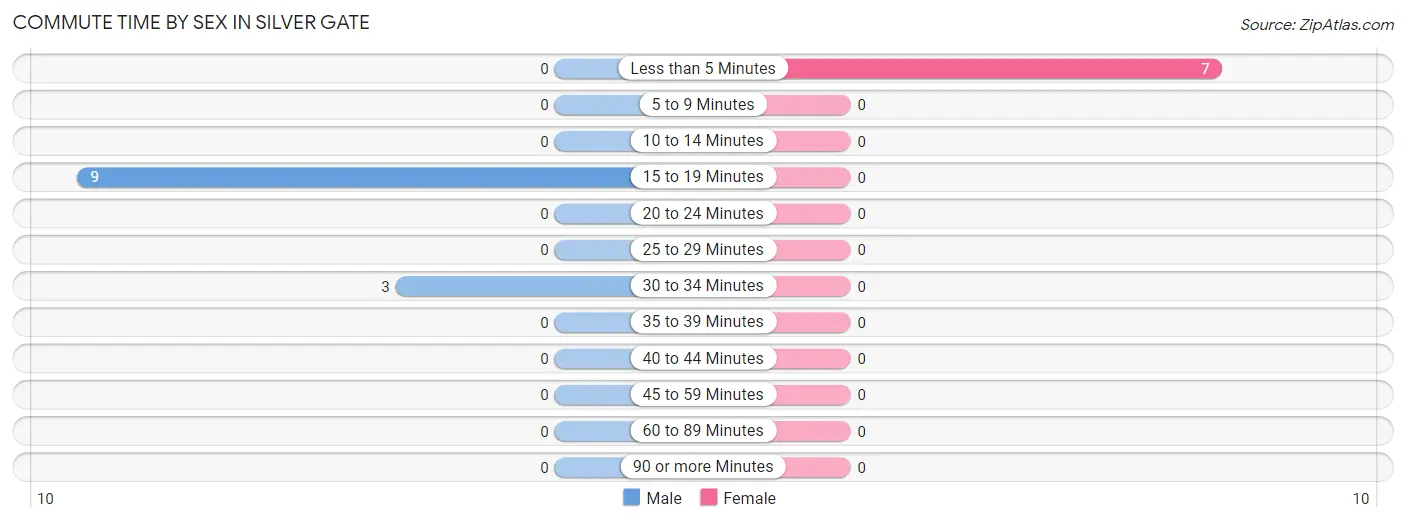
| Commute Time | Male | Female |
| Less than 5 Minutes | 0 (0.0%) | 7 (100.0%) |
| 5 to 9 Minutes | 0 (0.0%) | 0 (0.0%) |
| 10 to 14 Minutes | 0 (0.0%) | 0 (0.0%) |
| 15 to 19 Minutes | 9 (75.0%) | 0 (0.0%) |
| 20 to 24 Minutes | 0 (0.0%) | 0 (0.0%) |
| 25 to 29 Minutes | 0 (0.0%) | 0 (0.0%) |
| 30 to 34 Minutes | 3 (25.0%) | 0 (0.0%) |
| 35 to 39 Minutes | 0 (0.0%) | 0 (0.0%) |
| 40 to 44 Minutes | 0 (0.0%) | 0 (0.0%) |
| 45 to 59 Minutes | 0 (0.0%) | 0 (0.0%) |
| 60 to 89 Minutes | 0 (0.0%) | 0 (0.0%) |
| 90 or more Minutes | 0 (0.0%) | 0 (0.0%) |
Time of Departure to Work by Sex in Silver Gate
The most frequent times of departure to work in Silver Gate are 6:00 AM to 6:29 AM (6, 50.0%) for males and 11:00 AM to 11:59 AM (7, 100.0%) for females.
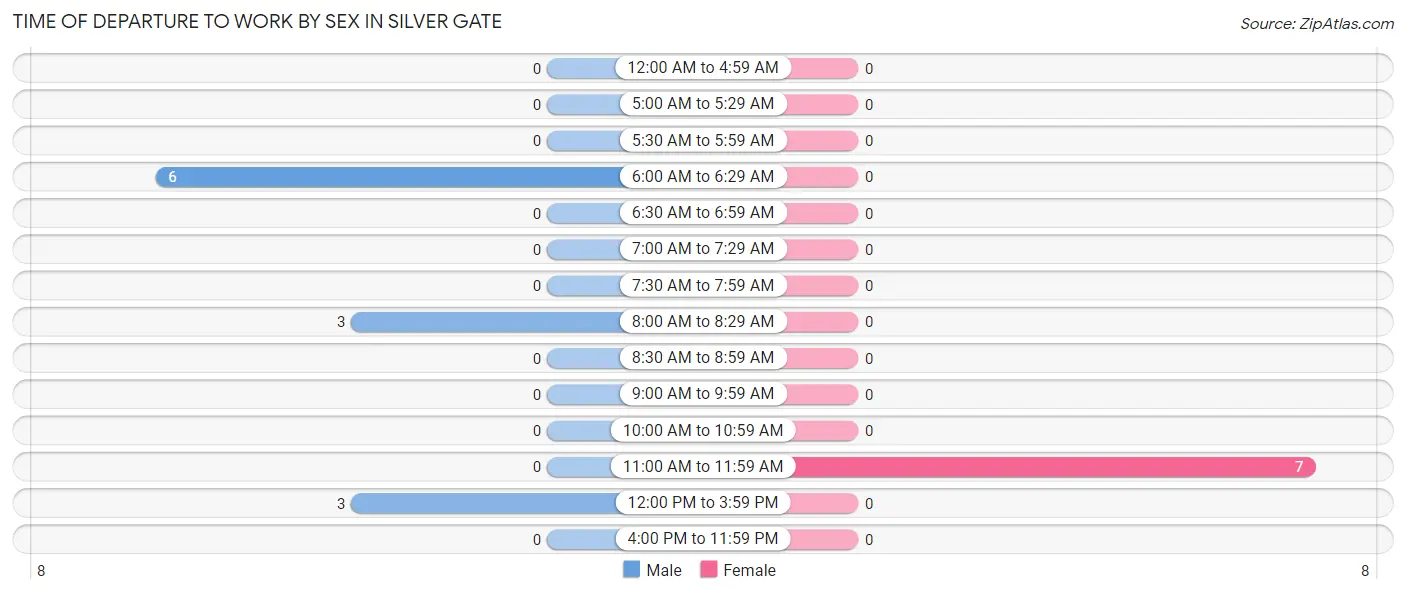
| Time of Departure | Male | Female |
| 12:00 AM to 4:59 AM | 0 (0.0%) | 0 (0.0%) |
| 5:00 AM to 5:29 AM | 0 (0.0%) | 0 (0.0%) |
| 5:30 AM to 5:59 AM | 0 (0.0%) | 0 (0.0%) |
| 6:00 AM to 6:29 AM | 6 (50.0%) | 0 (0.0%) |
| 6:30 AM to 6:59 AM | 0 (0.0%) | 0 (0.0%) |
| 7:00 AM to 7:29 AM | 0 (0.0%) | 0 (0.0%) |
| 7:30 AM to 7:59 AM | 0 (0.0%) | 0 (0.0%) |
| 8:00 AM to 8:29 AM | 3 (25.0%) | 0 (0.0%) |
| 8:30 AM to 8:59 AM | 0 (0.0%) | 0 (0.0%) |
| 9:00 AM to 9:59 AM | 0 (0.0%) | 0 (0.0%) |
| 10:00 AM to 10:59 AM | 0 (0.0%) | 0 (0.0%) |
| 11:00 AM to 11:59 AM | 0 (0.0%) | 7 (100.0%) |
| 12:00 PM to 3:59 PM | 3 (25.0%) | 0 (0.0%) |
| 4:00 PM to 11:59 PM | 0 (0.0%) | 0 (0.0%) |
| Total | 12 (100.0%) | 7 (100.0%) |
Housing Occupancy in Silver Gate
Occupancy by Ownership in Silver Gate
Of the total 53 dwellings in Silver Gate, owner-occupied units account for 51 (96.2%), while renter-occupied units make up 2 (3.8%).
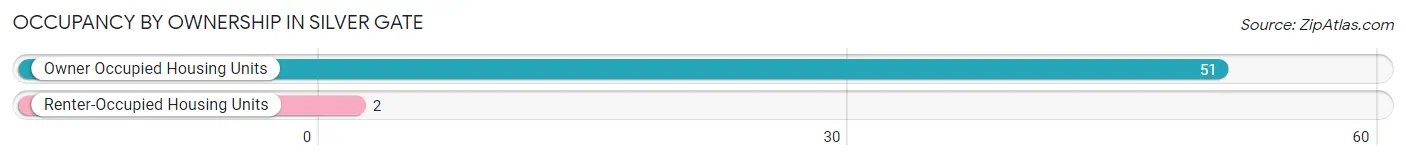
| Occupancy | # Housing Units | % Housing Units |
| Owner Occupied Housing Units | 51 | 96.2% |
| Renter-Occupied Housing Units | 2 | 3.8% |
| Total Occupied Housing Units | 53 | 100.0% |
Occupancy by Household Size in Silver Gate
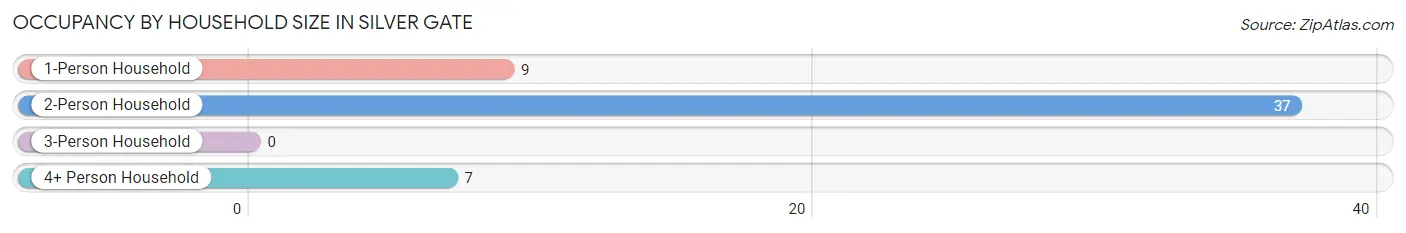
| Household Size | # Housing Units | % Housing Units |
| 1-Person Household | 9 | 17.0% |
| 2-Person Household | 37 | 69.8% |
| 3-Person Household | 0 | 0.0% |
| 4+ Person Household | 7 | 13.2% |
| Total Housing Units | 53 | 100.0% |
Occupancy by Ownership by Household Size in Silver Gate
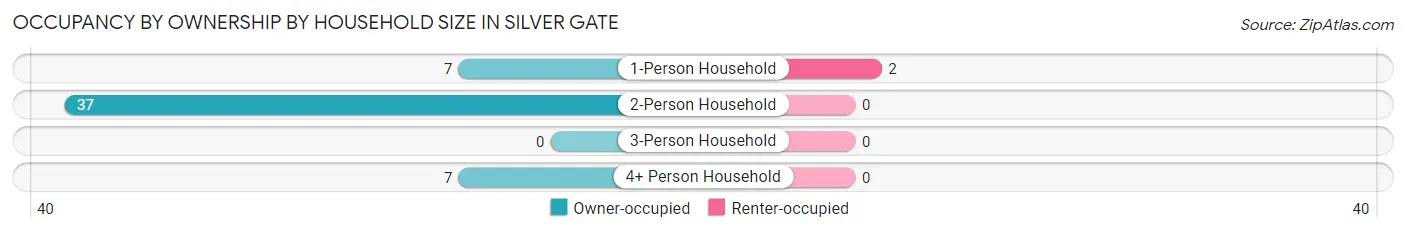
| Household Size | Owner-occupied | Renter-occupied |
| 1-Person Household | 7 (77.8%) | 2 (22.2%) |
| 2-Person Household | 37 (100.0%) | 0 (0.0%) |
| 3-Person Household | 0 (0.0%) | 0 (0.0%) |
| 4+ Person Household | 7 (100.0%) | 0 (0.0%) |
| Total Housing Units | 51 (96.2%) | 2 (3.8%) |
Occupancy by Educational Attainment in Silver Gate
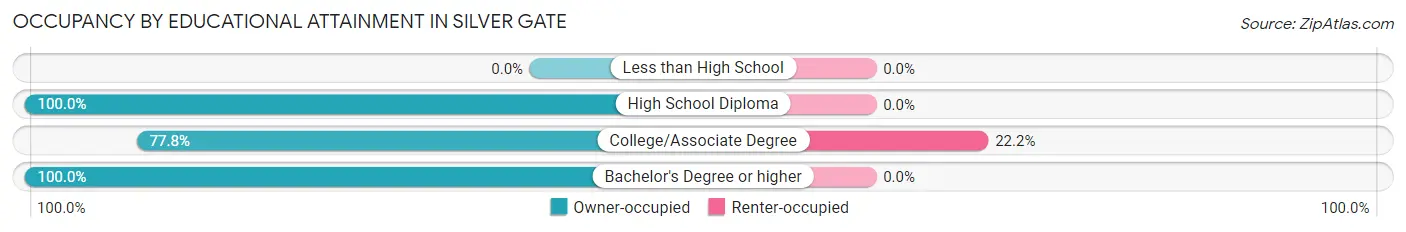
| Household Size | Owner-occupied | Renter-occupied |
| Less than High School | 0 (0.0%) | 0 (0.0%) |
| High School Diploma | 27 (100.0%) | 0 (0.0%) |
| College/Associate Degree | 7 (77.8%) | 2 (22.2%) |
| Bachelor's Degree or higher | 17 (100.0%) | 0 (0.0%) |
Occupancy by Age of Householder in Silver Gate
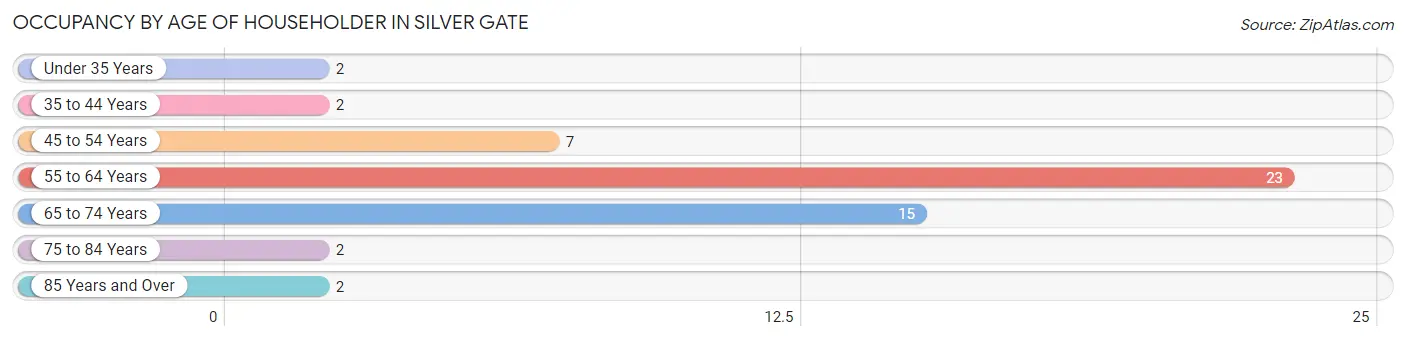
| Age Bracket | # Households | % Households |
| Under 35 Years | 2 | 3.8% |
| 35 to 44 Years | 2 | 3.8% |
| 45 to 54 Years | 7 | 13.2% |
| 55 to 64 Years | 23 | 43.4% |
| 65 to 74 Years | 15 | 28.3% |
| 75 to 84 Years | 2 | 3.8% |
| 85 Years and Over | 2 | 3.8% |
| Total | 53 | 100.0% |
Housing Finances in Silver Gate
Median Income by Occupancy in Silver Gate
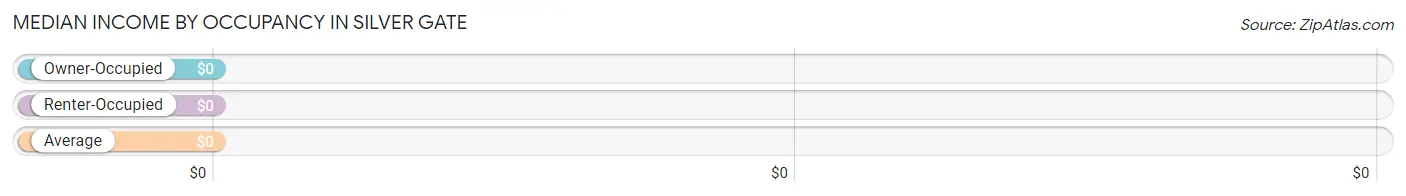
| Occupancy Type | # Households | Median Income |
| Owner-Occupied | 51 (96.2%) | $0 |
| Renter-Occupied | 2 (3.8%) | $0 |
| Average | 53 (100.0%) | $0 |
Occupancy by Householder Income Bracket in Silver Gate
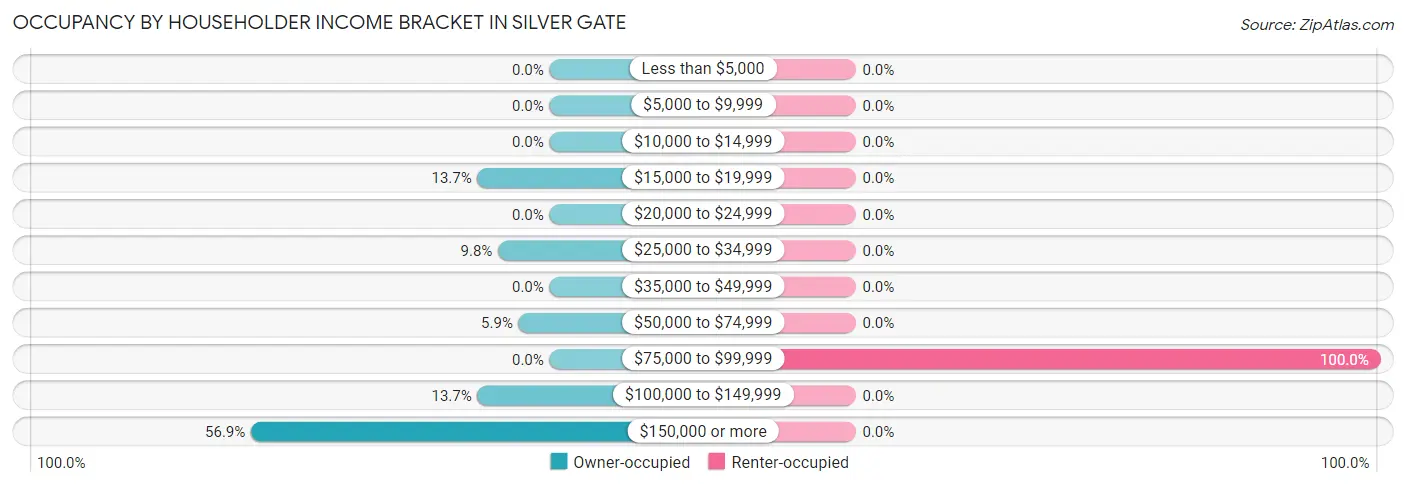
| Income Bracket | Owner-occupied | Renter-occupied |
| Less than $5,000 | 0 (0.0%) | 0 (0.0%) |
| $5,000 to $9,999 | 0 (0.0%) | 0 (0.0%) |
| $10,000 to $14,999 | 0 (0.0%) | 0 (0.0%) |
| $15,000 to $19,999 | 7 (13.7%) | 0 (0.0%) |
| $20,000 to $24,999 | 0 (0.0%) | 0 (0.0%) |
| $25,000 to $34,999 | 5 (9.8%) | 0 (0.0%) |
| $35,000 to $49,999 | 0 (0.0%) | 0 (0.0%) |
| $50,000 to $74,999 | 3 (5.9%) | 0 (0.0%) |
| $75,000 to $99,999 | 0 (0.0%) | 2 (100.0%) |
| $100,000 to $149,999 | 7 (13.7%) | 0 (0.0%) |
| $150,000 or more | 29 (56.9%) | 0 (0.0%) |
| Total | 51 (100.0%) | 2 (100.0%) |
Monthly Housing Cost Tiers in Silver Gate
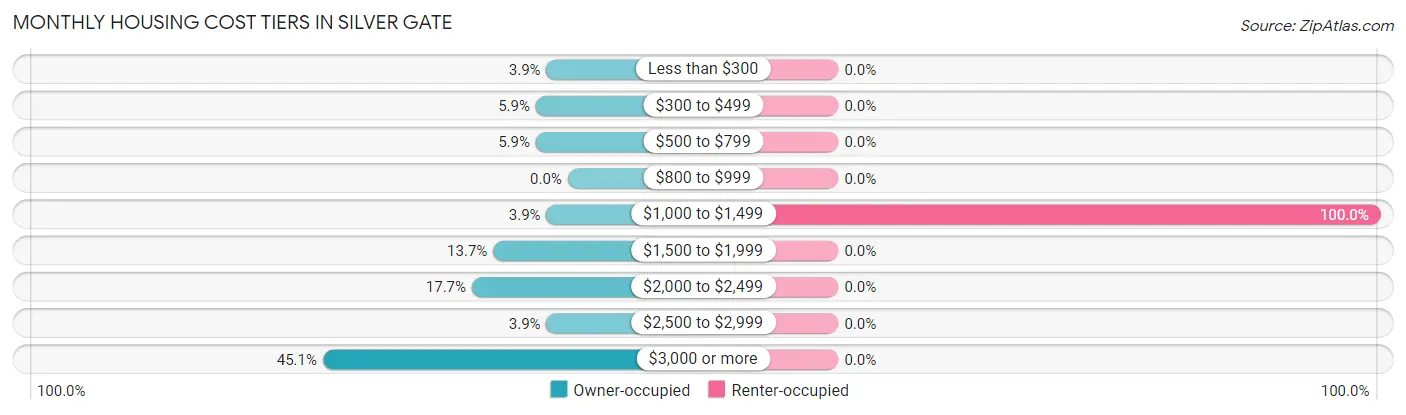
| Monthly Cost | Owner-occupied | Renter-occupied |
| Less than $300 | 2 (3.9%) | 0 (0.0%) |
| $300 to $499 | 3 (5.9%) | 0 (0.0%) |
| $500 to $799 | 3 (5.9%) | 0 (0.0%) |
| $800 to $999 | 0 (0.0%) | 0 (0.0%) |
| $1,000 to $1,499 | 2 (3.9%) | 2 (100.0%) |
| $1,500 to $1,999 | 7 (13.7%) | 0 (0.0%) |
| $2,000 to $2,499 | 9 (17.6%) | 0 (0.0%) |
| $2,500 to $2,999 | 2 (3.9%) | 0 (0.0%) |
| $3,000 or more | 23 (45.1%) | 0 (0.0%) |
| Total | 51 (100.0%) | 2 (100.0%) |
Physical Housing Characteristics in Silver Gate
Housing Structures in Silver Gate
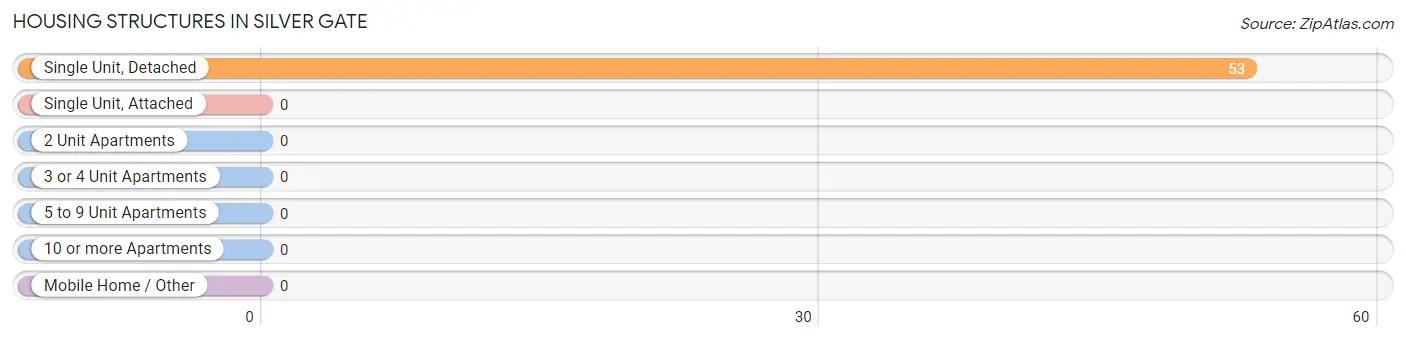
| Structure Type | # Housing Units | % Housing Units |
| Single Unit, Detached | 53 | 100.0% |
| Single Unit, Attached | 0 | 0.0% |
| 2 Unit Apartments | 0 | 0.0% |
| 3 or 4 Unit Apartments | 0 | 0.0% |
| 5 to 9 Unit Apartments | 0 | 0.0% |
| 10 or more Apartments | 0 | 0.0% |
| Mobile Home / Other | 0 | 0.0% |
| Total | 53 | 100.0% |
Housing Structures by Occupancy in Silver Gate
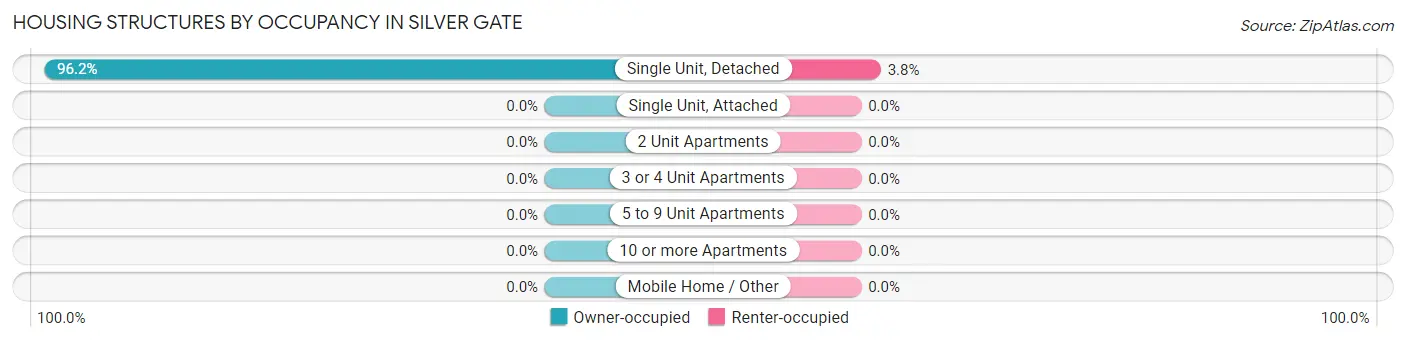
| Structure Type | Owner-occupied | Renter-occupied |
| Single Unit, Detached | 51 (96.2%) | 2 (3.8%) |
| Single Unit, Attached | 0 (0.0%) | 0 (0.0%) |
| 2 Unit Apartments | 0 (0.0%) | 0 (0.0%) |
| 3 or 4 Unit Apartments | 0 (0.0%) | 0 (0.0%) |
| 5 to 9 Unit Apartments | 0 (0.0%) | 0 (0.0%) |
| 10 or more Apartments | 0 (0.0%) | 0 (0.0%) |
| Mobile Home / Other | 0 (0.0%) | 0 (0.0%) |
| Total | 51 (96.2%) | 2 (3.8%) |
Housing Structures by Number of Rooms in Silver Gate
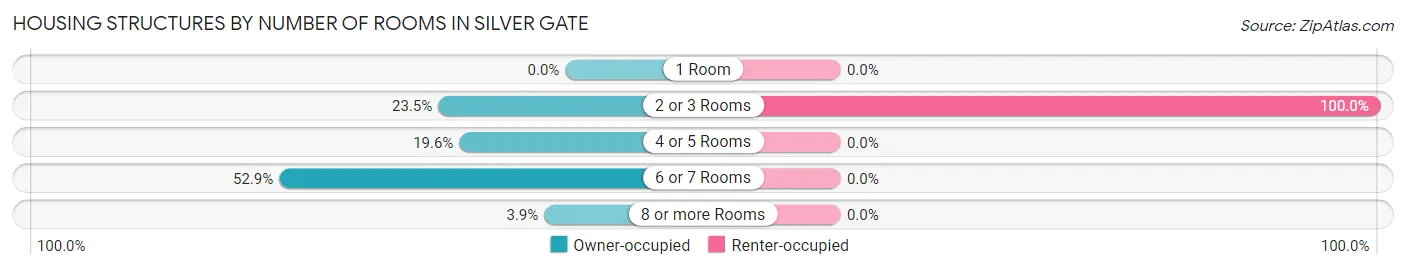
| Number of Rooms | Owner-occupied | Renter-occupied |
| 1 Room | 0 (0.0%) | 0 (0.0%) |
| 2 or 3 Rooms | 12 (23.5%) | 2 (100.0%) |
| 4 or 5 Rooms | 10 (19.6%) | 0 (0.0%) |
| 6 or 7 Rooms | 27 (52.9%) | 0 (0.0%) |
| 8 or more Rooms | 2 (3.9%) | 0 (0.0%) |
| Total | 51 (100.0%) | 2 (100.0%) |
Housing Structure by Heating Type in Silver Gate
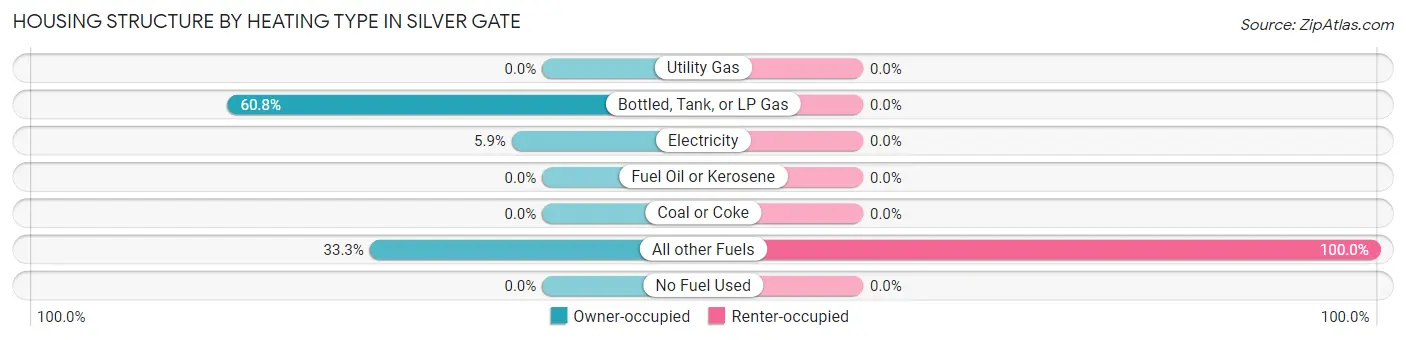
| Heating Type | Owner-occupied | Renter-occupied |
| Utility Gas | 0 (0.0%) | 0 (0.0%) |
| Bottled, Tank, or LP Gas | 31 (60.8%) | 0 (0.0%) |
| Electricity | 3 (5.9%) | 0 (0.0%) |
| Fuel Oil or Kerosene | 0 (0.0%) | 0 (0.0%) |
| Coal or Coke | 0 (0.0%) | 0 (0.0%) |
| All other Fuels | 17 (33.3%) | 2 (100.0%) |
| No Fuel Used | 0 (0.0%) | 0 (0.0%) |
| Total | 51 (100.0%) | 2 (100.0%) |
Household Vehicle Usage in Silver Gate
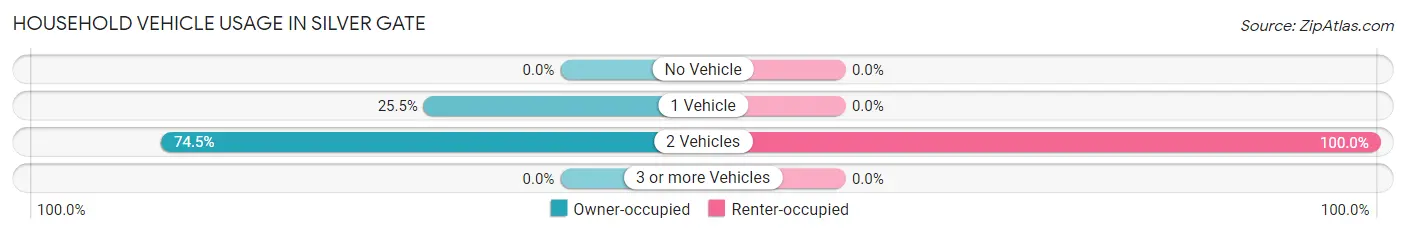
| Vehicles per Household | Owner-occupied | Renter-occupied |
| No Vehicle | 0 (0.0%) | 0 (0.0%) |
| 1 Vehicle | 13 (25.5%) | 0 (0.0%) |
| 2 Vehicles | 38 (74.5%) | 2 (100.0%) |
| 3 or more Vehicles | 0 (0.0%) | 0 (0.0%) |
| Total | 51 (100.0%) | 2 (100.0%) |
Real Estate & Mortgages in Silver Gate
Real Estate and Mortgage Overview in Silver Gate
| Characteristic | Without Mortgage | With Mortgage |
| Housing Units | 8 | 43 |
| Median Property Value | $283,300 | $597,700 |
| Median Household Income | $51,250 | $27 |
| Monthly Housing Costs | $467 | $23 |
| Real Estate Taxes | $1,833 | $0 |
Property Value by Mortgage Status in Silver Gate
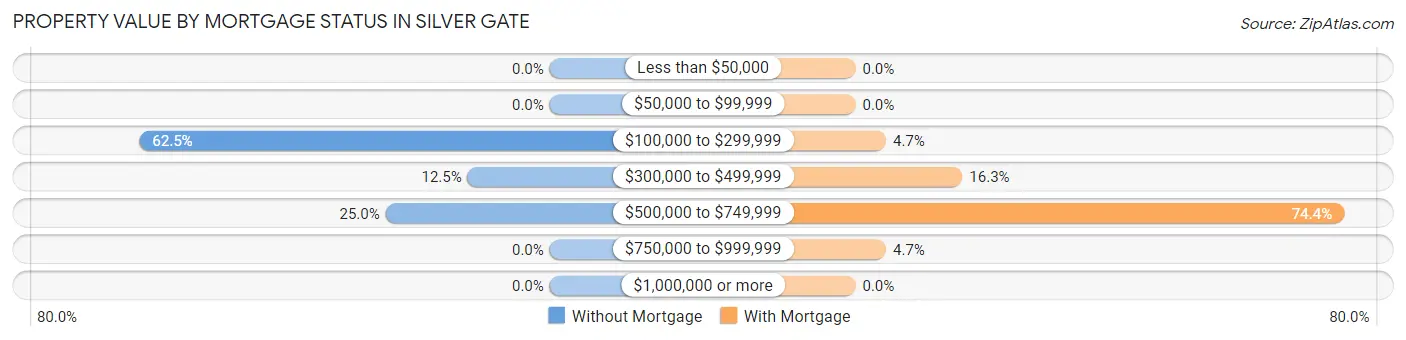
| Property Value | Without Mortgage | With Mortgage |
| Less than $50,000 | 0 (0.0%) | 0 (0.0%) |
| $50,000 to $99,999 | 0 (0.0%) | 0 (0.0%) |
| $100,000 to $299,999 | 5 (62.5%) | 2 (4.6%) |
| $300,000 to $499,999 | 1 (12.5%) | 7 (16.3%) |
| $500,000 to $749,999 | 2 (25.0%) | 32 (74.4%) |
| $750,000 to $999,999 | 0 (0.0%) | 2 (4.6%) |
| $1,000,000 or more | 0 (0.0%) | 0 (0.0%) |
| Total | 8 (100.0%) | 43 (100.0%) |
Household Income by Mortgage Status in Silver Gate
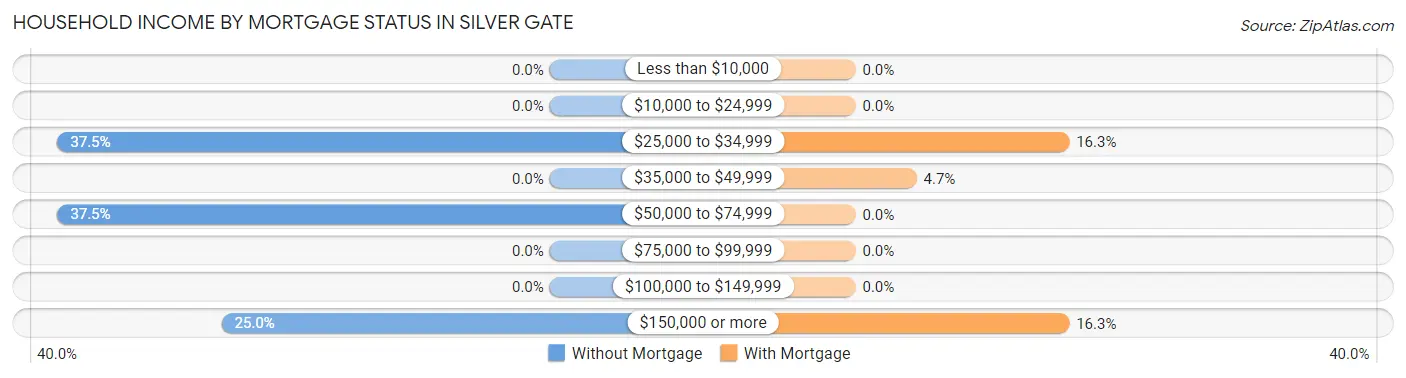
| Household Income | Without Mortgage | With Mortgage |
| Less than $10,000 | 0 (0.0%) | 0 (0.0%) |
| $10,000 to $24,999 | 0 (0.0%) | 0 (0.0%) |
| $25,000 to $34,999 | 3 (37.5%) | 7 (16.3%) |
| $35,000 to $49,999 | 0 (0.0%) | 2 (4.6%) |
| $50,000 to $74,999 | 3 (37.5%) | 0 (0.0%) |
| $75,000 to $99,999 | 0 (0.0%) | 0 (0.0%) |
| $100,000 to $149,999 | 0 (0.0%) | 0 (0.0%) |
| $150,000 or more | 2 (25.0%) | 7 (16.3%) |
| Total | 8 (100.0%) | 43 (100.0%) |
Property Value to Household Income Ratio in Silver Gate
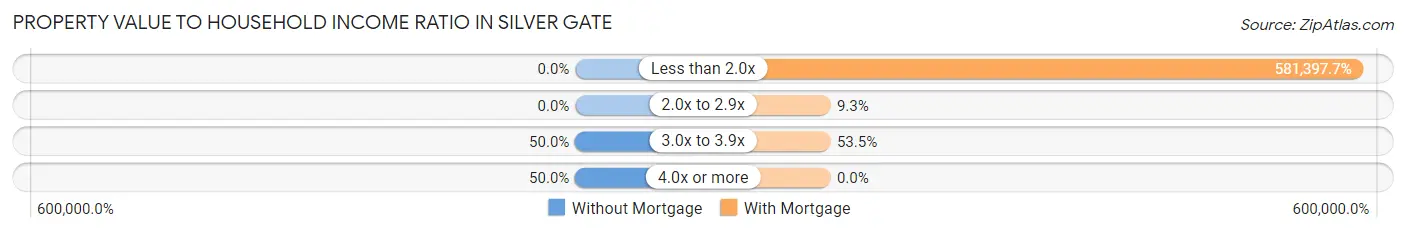
| Value-to-Income Ratio | Without Mortgage | With Mortgage |
| Less than 2.0x | 0 (0.0%) | 250,001 (581,397.7%) |
| 2.0x to 2.9x | 0 (0.0%) | 4 (9.3%) |
| 3.0x to 3.9x | 4 (50.0%) | 23 (53.5%) |
| 4.0x or more | 4 (50.0%) | 0 (0.0%) |
| Total | 8 (100.0%) | 43 (100.0%) |
Real Estate Taxes by Mortgage Status in Silver Gate
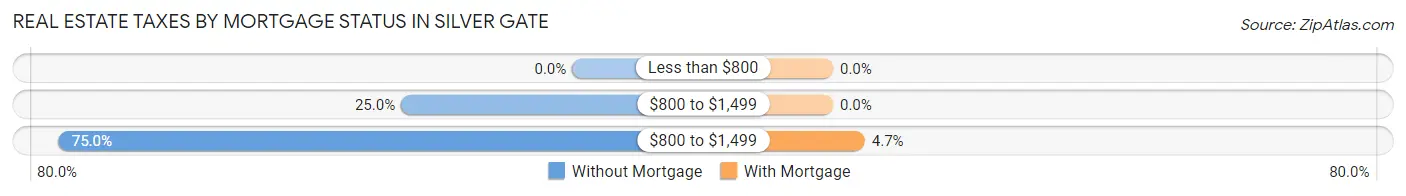
| Property Taxes | Without Mortgage | With Mortgage |
| Less than $800 | 0 (0.0%) | 0 (0.0%) |
| $800 to $1,499 | 2 (25.0%) | 0 (0.0%) |
| $800 to $1,499 | 6 (75.0%) | 2 (4.6%) |
| Total | 8 (100.0%) | 43 (100.0%) |
Health & Disability in Silver Gate
Health Insurance Coverage by Age in Silver Gate
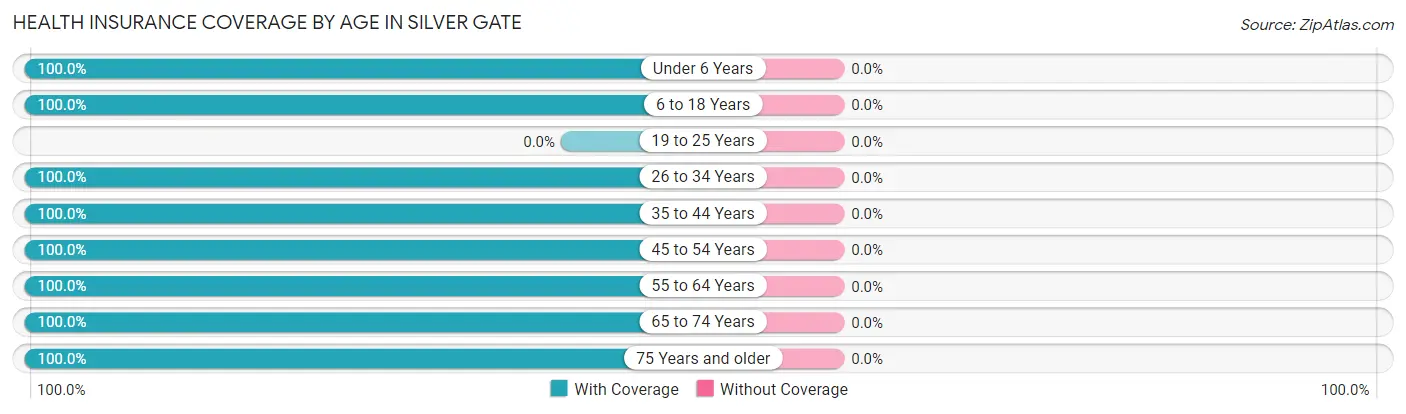
| Age Bracket | With Coverage | Without Coverage |
| Under 6 Years | 6 (100.0%) | 0 (0.0%) |
| 6 to 18 Years | 7 (100.0%) | 0 (0.0%) |
| 19 to 25 Years | 0 (0.0%) | 0 (0.0%) |
| 26 to 34 Years | 2 (100.0%) | 0 (0.0%) |
| 35 to 44 Years | 11 (100.0%) | 0 (0.0%) |
| 45 to 54 Years | 7 (100.0%) | 0 (0.0%) |
| 55 to 64 Years | 59 (100.0%) | 0 (0.0%) |
| 65 to 74 Years | 16 (100.0%) | 0 (0.0%) |
| 75 Years and older | 6 (100.0%) | 0 (0.0%) |
| Total | 114 (100.0%) | 0 (0.0%) |
Health Insurance Coverage by Citizenship Status in Silver Gate
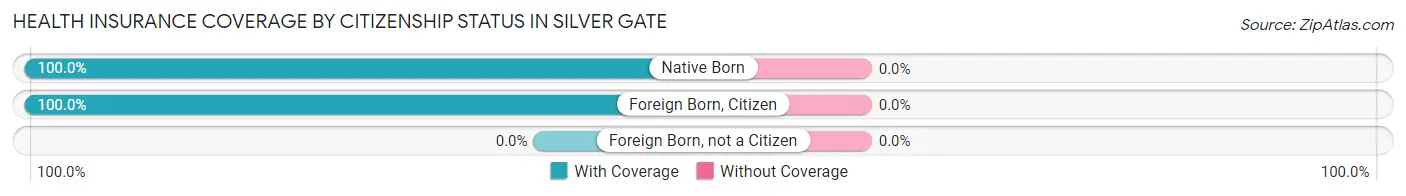
| Citizenship Status | With Coverage | Without Coverage |
| Native Born | 6 (100.0%) | 0 (0.0%) |
| Foreign Born, Citizen | 7 (100.0%) | 0 (0.0%) |
| Foreign Born, not a Citizen | 0 (0.0%) | 0 (0.0%) |
Health Insurance Coverage by Household Income in Silver Gate
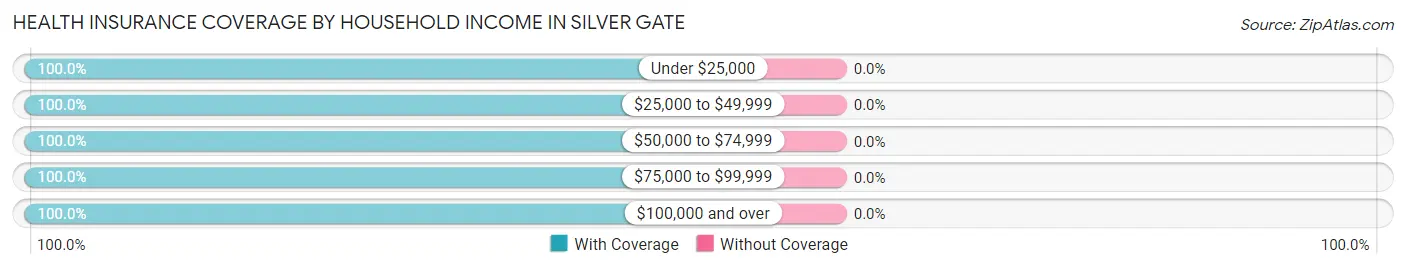
| Household Income | With Coverage | Without Coverage |
| Under $25,000 | 13 (100.0%) | 0 (0.0%) |
| $25,000 to $49,999 | 5 (100.0%) | 0 (0.0%) |
| $50,000 to $74,999 | 4 (100.0%) | 0 (0.0%) |
| $75,000 to $99,999 | 2 (100.0%) | 0 (0.0%) |
| $100,000 and over | 90 (100.0%) | 0 (0.0%) |
Public vs Private Health Insurance Coverage by Age in Silver Gate
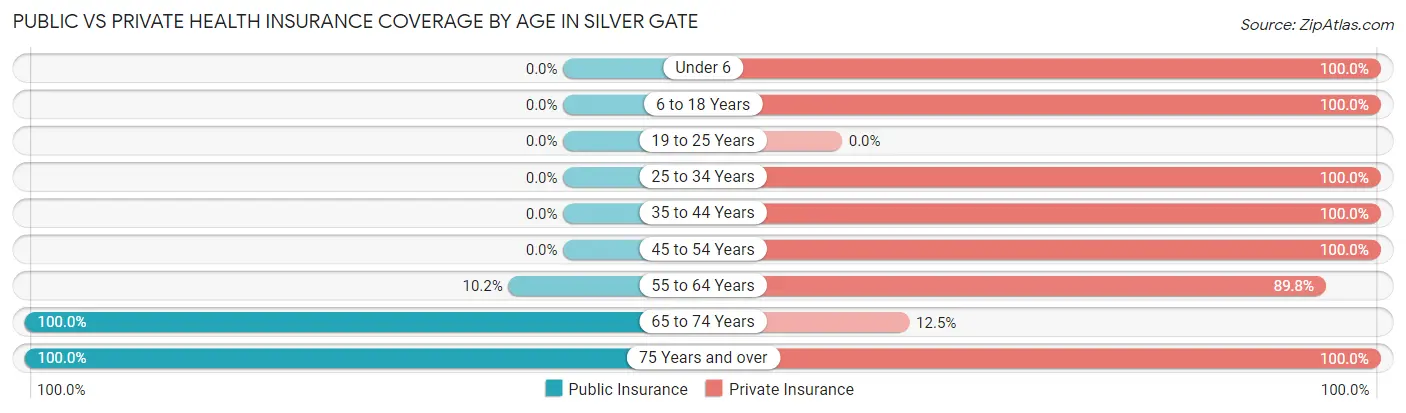
| Age Bracket | Public Insurance | Private Insurance |
| Under 6 | 0 (0.0%) | 6 (100.0%) |
| 6 to 18 Years | 0 (0.0%) | 7 (100.0%) |
| 19 to 25 Years | 0 (0.0%) | 0 (0.0%) |
| 25 to 34 Years | 0 (0.0%) | 2 (100.0%) |
| 35 to 44 Years | 0 (0.0%) | 11 (100.0%) |
| 45 to 54 Years | 0 (0.0%) | 7 (100.0%) |
| 55 to 64 Years | 6 (10.2%) | 53 (89.8%) |
| 65 to 74 Years | 16 (100.0%) | 2 (12.5%) |
| 75 Years and over | 6 (100.0%) | 6 (100.0%) |
| Total | 28 (24.6%) | 94 (82.5%) |
Disability Status by Sex by Age in Silver Gate
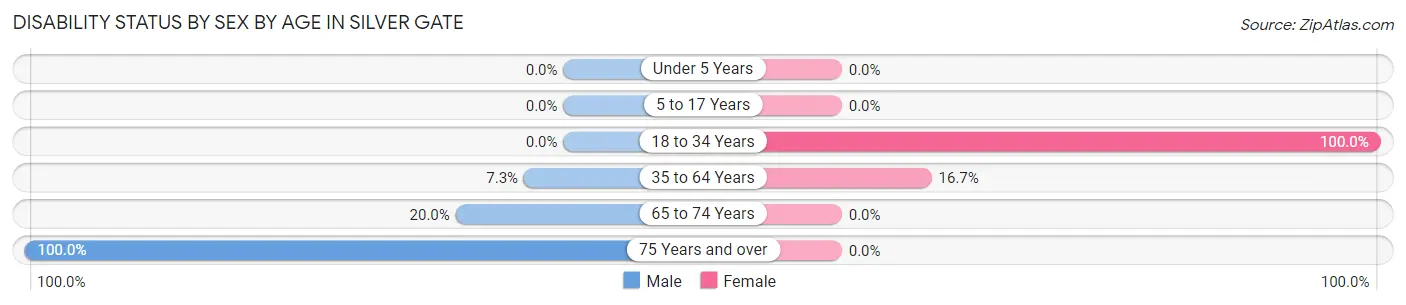
| Age Bracket | Male | Female |
| Under 5 Years | 0 (0.0%) | 0 (0.0%) |
| 5 to 17 Years | 0 (0.0%) | 0 (0.0%) |
| 18 to 34 Years | 0 (0.0%) | 2 (100.0%) |
| 35 to 64 Years | 3 (7.3%) | 6 (16.7%) |
| 65 to 74 Years | 3 (20.0%) | 0 (0.0%) |
| 75 Years and over | 2 (100.0%) | 0 (0.0%) |
Disability Class by Sex by Age in Silver Gate
Disability Class: Hearing Difficulty
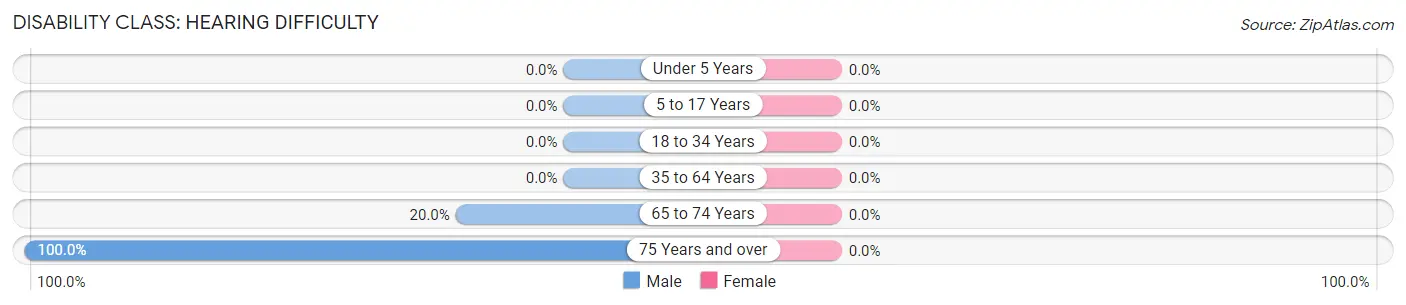
| Age Bracket | Male | Female |
| Under 5 Years | 0 (0.0%) | 0 (0.0%) |
| 5 to 17 Years | 0 (0.0%) | 0 (0.0%) |
| 18 to 34 Years | 0 (0.0%) | 0 (0.0%) |
| 35 to 64 Years | 0 (0.0%) | 0 (0.0%) |
| 65 to 74 Years | 3 (20.0%) | 0 (0.0%) |
| 75 Years and over | 2 (100.0%) | 0 (0.0%) |
Disability Class: Vision Difficulty
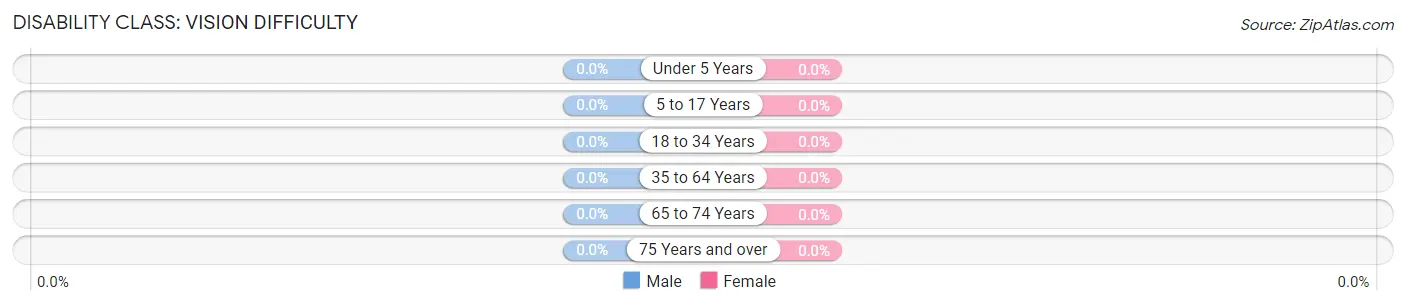
| Age Bracket | Male | Female |
| Under 5 Years | 0 (0.0%) | 0 (0.0%) |
| 5 to 17 Years | 0 (0.0%) | 0 (0.0%) |
| 18 to 34 Years | 0 (0.0%) | 0 (0.0%) |
| 35 to 64 Years | 0 (0.0%) | 0 (0.0%) |
| 65 to 74 Years | 0 (0.0%) | 0 (0.0%) |
| 75 Years and over | 0 (0.0%) | 0 (0.0%) |
Disability Class: Cognitive Difficulty
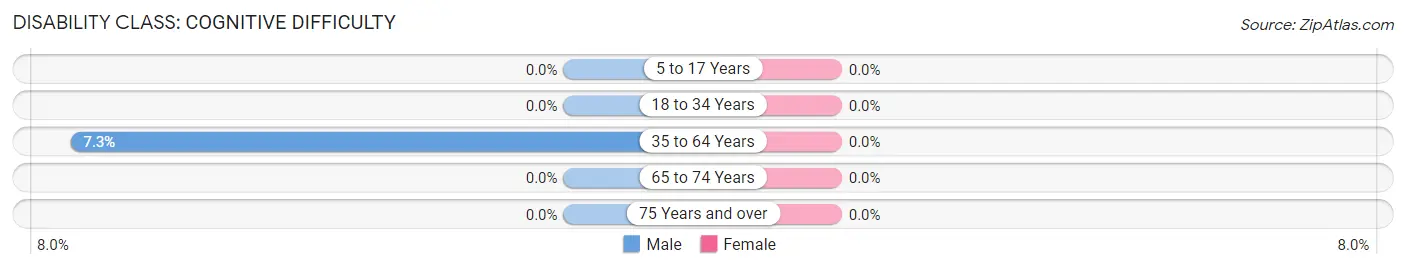
| Age Bracket | Male | Female |
| 5 to 17 Years | 0 (0.0%) | 0 (0.0%) |
| 18 to 34 Years | 0 (0.0%) | 0 (0.0%) |
| 35 to 64 Years | 3 (7.3%) | 0 (0.0%) |
| 65 to 74 Years | 0 (0.0%) | 0 (0.0%) |
| 75 Years and over | 0 (0.0%) | 0 (0.0%) |
Disability Class: Ambulatory Difficulty
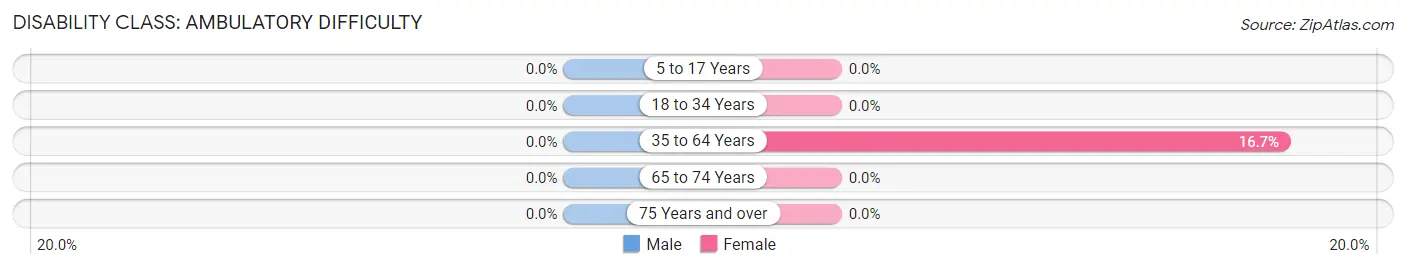
| Age Bracket | Male | Female |
| 5 to 17 Years | 0 (0.0%) | 0 (0.0%) |
| 18 to 34 Years | 0 (0.0%) | 0 (0.0%) |
| 35 to 64 Years | 0 (0.0%) | 6 (16.7%) |
| 65 to 74 Years | 0 (0.0%) | 0 (0.0%) |
| 75 Years and over | 0 (0.0%) | 0 (0.0%) |
Disability Class: Self-Care Difficulty
| Age Bracket | Male | Female |
| 5 to 17 Years | 0 (0.0%) | 0 (0.0%) |
| 18 to 34 Years | 0 (0.0%) | 0 (0.0%) |
| 35 to 64 Years | 0 (0.0%) | 0 (0.0%) |
| 65 to 74 Years | 0 (0.0%) | 0 (0.0%) |
| 75 Years and over | 0 (0.0%) | 0 (0.0%) |
Technology Access in Silver Gate
Computing Device Access in Silver Gate
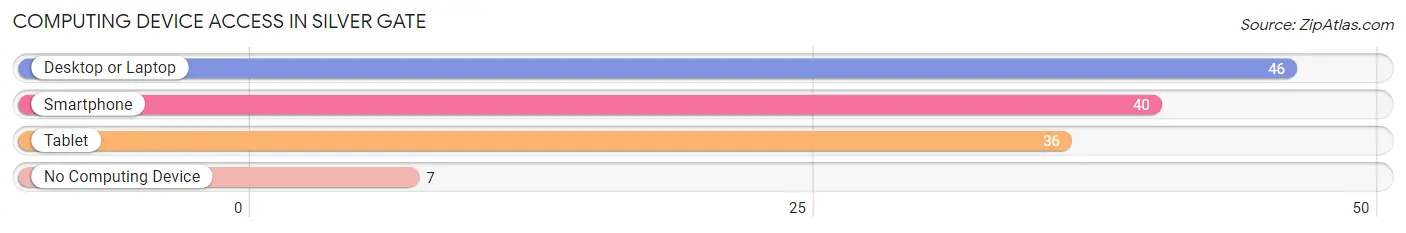
| Device Type | # Households | % Households |
| Desktop or Laptop | 46 | 86.8% |
| Smartphone | 40 | 75.5% |
| Tablet | 36 | 67.9% |
| No Computing Device | 7 | 13.2% |
| Total | 53 | 100.0% |
Internet Access in Silver Gate
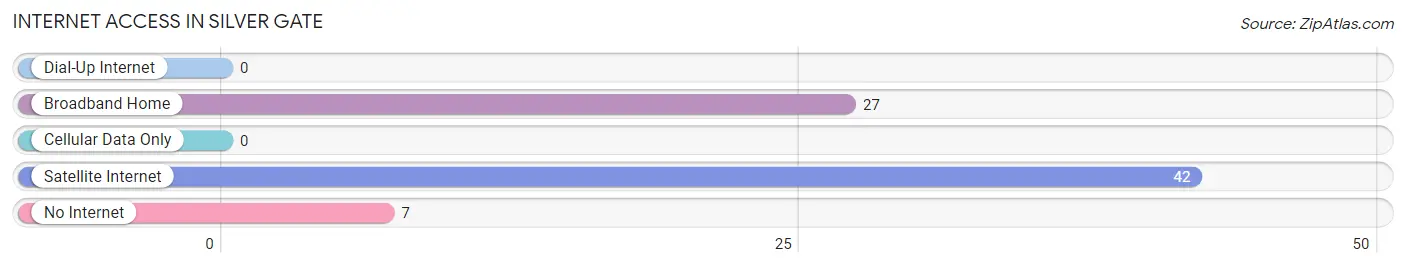
| Internet Type | # Households | % Households |
| Dial-Up Internet | 0 | 0.0% |
| Broadband Home | 27 | 50.9% |
| Cellular Data Only | 0 | 0.0% |
| Satellite Internet | 42 | 79.2% |
| No Internet | 7 | 13.2% |
| Total | 53 | 100.0% |
Silver Gate Summary
History
Silver Gate, Montana is a small unincorporated community located in the Beartooth Mountains of Carbon County, Montana. The town was founded in the late 1800s by prospectors who were searching for silver and gold in the area. The town was originally called Silver Gate City, but the name was shortened to Silver Gate in the early 1900s.
The town was originally a mining camp, but it quickly grew into a small town with a post office, a general store, a saloon, and a few other businesses. The town was also home to a number of miners and their families.
In the early 1900s, the town was a popular tourist destination for people who wanted to experience the wild west. The town was also home to a number of famous people, including Buffalo Bill Cody, who visited the town in the early 1900s.
The town was also home to a number of famous outlaws, including Butch Cassidy and the Sundance Kid, who were known to frequent the saloon in Silver Gate.
The town was also home to a number of famous outlaws, including Butch Cassidy and the Sundance Kid, who were known to frequent the saloon in Silver Gate.
The town was also home to a number of famous outlaws, including Butch Cassidy and the Sundance Kid, who were known to frequent the saloon in Silver Gate.
The town was also home to a number of famous outlaws, including Butch Cassidy and the Sundance Kid, who were known to frequent the saloon in Silver Gate.
The town was also home to a number of famous outlaws, including Butch Cassidy and the Sundance Kid, who were known to frequent the saloon in Silver Gate.
Geography
Silver Gate is located in the Beartooth Mountains of Carbon County, Montana. The town is situated at an elevation of 6,890 feet and is surrounded by the Absaroka-Beartooth Wilderness. The town is located approximately 25 miles south of Red Lodge, Montana and is accessible via US Highway 212.
The town is located in a mountainous region and is surrounded by forests and alpine meadows. The area is known for its abundance of wildlife, including elk, deer, moose, and bighorn sheep.
Economy
The economy of Silver Gate is largely based on tourism. The town is a popular destination for outdoor enthusiasts, who come to the area to enjoy the scenery and wildlife. The town is also home to a number of businesses, including a general store, a post office, and a few restaurants.
The town is also home to a number of small businesses, including a bed and breakfast, a gift shop, and a few other small businesses.
Demographics
As of the 2010 census, the population of Silver Gate was 97. The town is predominantly white, with a small percentage of Native American and Hispanic residents. The median household income in the town is $37,500, and the median age is 44.
Conclusion
Silver Gate, Montana is a small unincorporated community located in the Beartooth Mountains of Carbon County, Montana. The town was founded in the late 1800s by prospectors who were searching for silver and gold in the area. The town is now a popular tourist destination for outdoor enthusiasts, and is home to a number of businesses, including a general store, a post office, and a few restaurants. The population of Silver Gate is predominantly white, with a small percentage of Native American and Hispanic residents. The median household income in the town is $37,500, and the median age is 44.
Common Questions
What is Per Capita Income in Silver Gate?
Per Capita income in Silver Gate is $89,698.
What is the Median Family Income in Silver Gate?
Median Family Income in Silver Gate is $250,001.
What is Inequality or Gini Index in Silver Gate?
Inequality or Gini Index in Silver Gate is 0.36.
What is the Total Population of Silver Gate?
Total Population of Silver Gate is 114.
What is the Total Male Population of Silver Gate?
Total Male Population of Silver Gate is 65.
What is the Total Female Population of Silver Gate?
Total Female Population of Silver Gate is 49.
What is the Ratio of Males per 100 Females in Silver Gate?
There are 132.65 Males per 100 Females in Silver Gate.
What is the Ratio of Females per 100 Males in Silver Gate?
There are 75.38 Females per 100 Males in Silver Gate.
What is the Median Population Age in Silver Gate?
Median Population Age in Silver Gate is 56.9 Years.
What is the Average Family Size in Silver Gate
Average Family Size in Silver Gate is 2.4 People.
What is the Average Household Size in Silver Gate
Average Household Size in Silver Gate is 2.1 People.
How Large is the Labor Force in Silver Gate?
There are 51 People in the Labor Forcein in Silver Gate.
What is the Percentage of People in the Labor Force in Silver Gate?
50.5% of People are in the Labor Force in Silver Gate.