Elliston, MT Map & Demographics
Elliston Map
Elliston Overview
$33,923
PER CAPITA INCOME
$69,375
AVG FAMILY INCOME
$42,000
AVG HOUSEHOLD INCOME
42.9%
WAGE / INCOME GAP [ % ]
57.1¢/ $1
WAGE / INCOME GAP [ $ ]
0.48
INEQUALITY / GINI INDEX
223
TOTAL POPULATION
120
MALE POPULATION
103
FEMALE POPULATION
116.50
MALES / 100 FEMALES
85.83
FEMALES / 100 MALES
39.1
MEDIAN AGE
2.8
AVG FAMILY SIZE
2.2
AVG HOUSEHOLD SIZE
133
LABOR FORCE [ PEOPLE ]
72.7%
PERCENT IN LABOR FORCE
6.1%
UNEMPLOYMENT RATE
Elliston Zip Codes
Elliston Area Codes
Income in Elliston
Income Overview in Elliston
Per Capita Income in Elliston is $33,923, while median incomes of families and households are $69,375 and $42,000 respectively.
| Characteristic | Number | Measure |
| Per Capita Income | 223 | $33,923 |
| Median Family Income | 60 | $69,375 |
| Mean Family Income | 60 | $98,957 |
| Median Household Income | 102 | $42,000 |
| Mean Household Income | 102 | $76,662 |
| Income Deficit | 60 | $0 |
| Wage / Income Gap (%) | 223 | 42.93% |
| Wage / Income Gap ($) | 223 | 57.07¢ per $1 |
| Gini / Inequality Index | 223 | 0.48 |
Earnings by Sex in Elliston
Average Earnings in Elliston are $37,500, $38,984 for men and $22,250 for women, a difference of 42.9%.
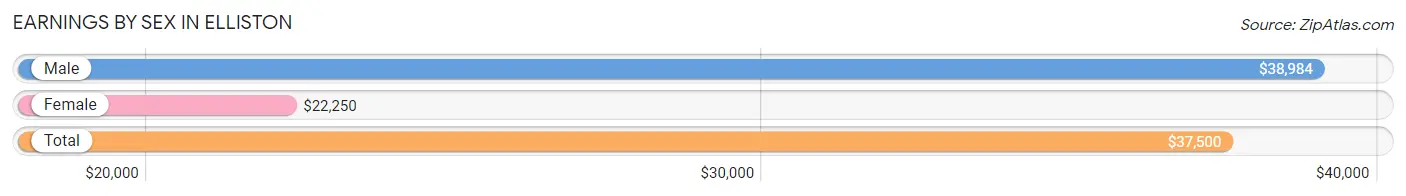
| Sex | Number | Average Earnings |
| Male | 79 (59.9%) | $38,984 |
| Female | 53 (40.2%) | $22,250 |
| Total | 132 (100.0%) | $37,500 |
Earnings by Sex by Income Bracket in Elliston
The most common earnings brackets in Elliston are $35,000 to $39,999 for men (18 | 22.8%) and $2,499 or less for women (14 | 26.4%).
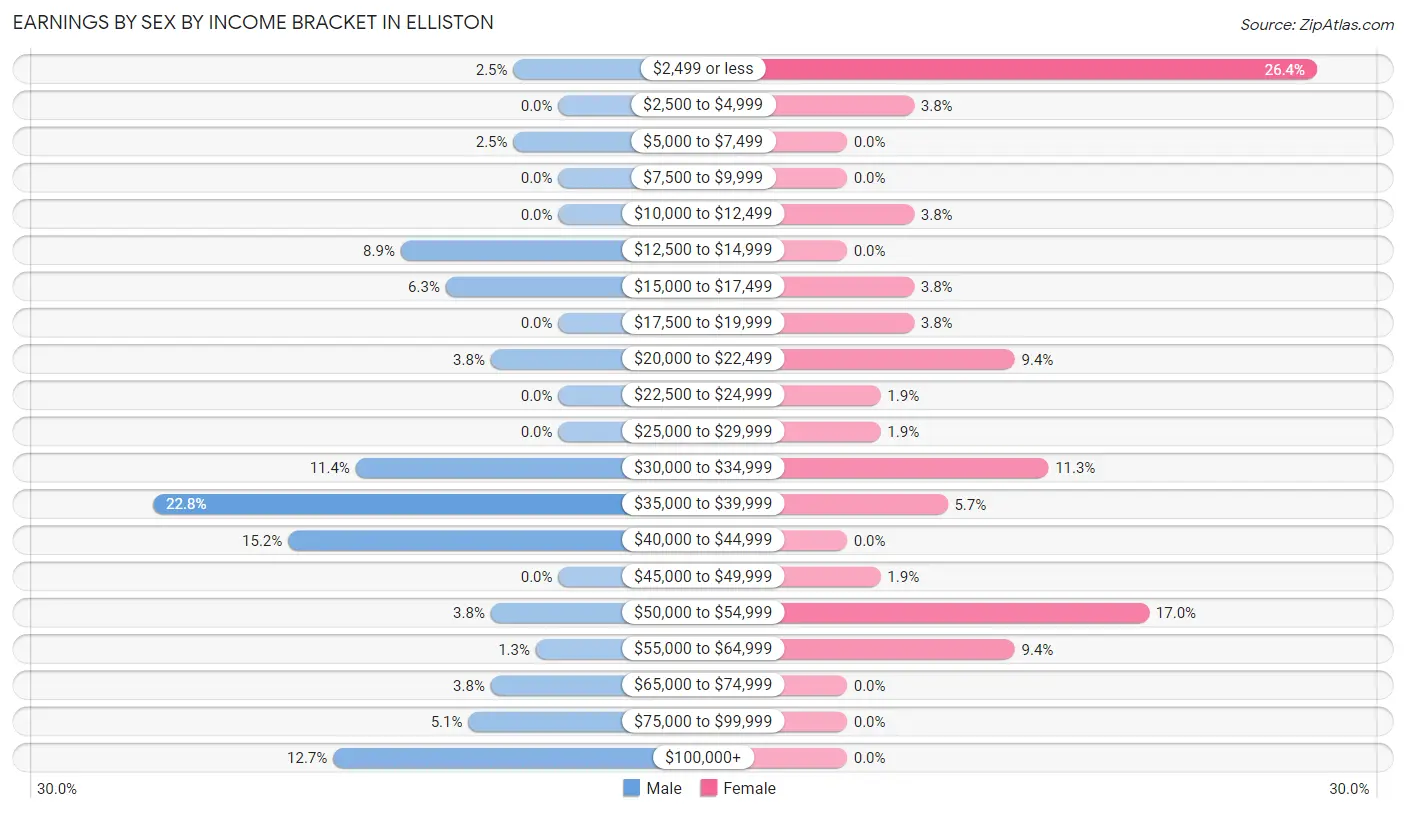
| Income | Male | Female |
| $2,499 or less | 2 (2.5%) | 14 (26.4%) |
| $2,500 to $4,999 | 0 (0.0%) | 2 (3.8%) |
| $5,000 to $7,499 | 2 (2.5%) | 0 (0.0%) |
| $7,500 to $9,999 | 0 (0.0%) | 0 (0.0%) |
| $10,000 to $12,499 | 0 (0.0%) | 2 (3.8%) |
| $12,500 to $14,999 | 7 (8.9%) | 0 (0.0%) |
| $15,000 to $17,499 | 5 (6.3%) | 2 (3.8%) |
| $17,500 to $19,999 | 0 (0.0%) | 2 (3.8%) |
| $20,000 to $22,499 | 3 (3.8%) | 5 (9.4%) |
| $22,500 to $24,999 | 0 (0.0%) | 1 (1.9%) |
| $25,000 to $29,999 | 0 (0.0%) | 1 (1.9%) |
| $30,000 to $34,999 | 9 (11.4%) | 6 (11.3%) |
| $35,000 to $39,999 | 18 (22.8%) | 3 (5.7%) |
| $40,000 to $44,999 | 12 (15.2%) | 0 (0.0%) |
| $45,000 to $49,999 | 0 (0.0%) | 1 (1.9%) |
| $50,000 to $54,999 | 3 (3.8%) | 9 (17.0%) |
| $55,000 to $64,999 | 1 (1.3%) | 5 (9.4%) |
| $65,000 to $74,999 | 3 (3.8%) | 0 (0.0%) |
| $75,000 to $99,999 | 4 (5.1%) | 0 (0.0%) |
| $100,000+ | 10 (12.7%) | 0 (0.0%) |
| Total | 79 (100.0%) | 53 (100.0%) |
Earnings by Sex by Educational Attainment in Elliston
Average earnings in Elliston are $39,659 for men and $30,625 for women, a difference of 22.8%. Men with an educational attainment of college or associate's degree enjoy the highest average annual earnings of $50,417, while those with college or associate's degree education earn the least with $50,417. Women with an educational attainment of bachelor's degree earn the most with the average annual earnings of $52,750, while those with college or associate's degree education have the smallest earnings of $18,750.
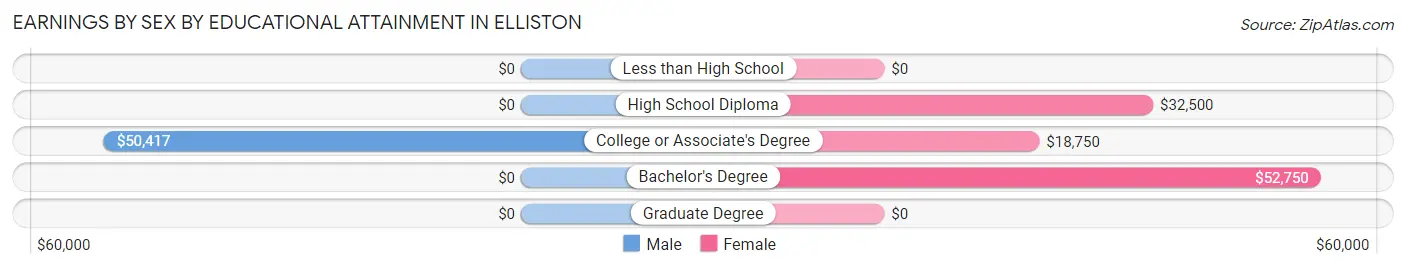
| Educational Attainment | Male Income | Female Income |
| Less than High School | - | - |
| High School Diploma | - | - |
| College or Associate's Degree | $50,417 | $18,750 |
| Bachelor's Degree | - | - |
| Graduate Degree | - | - |
| Total | $39,659 | $30,625 |
Family Income in Elliston
Family Income Brackets in Elliston
According to the Elliston family income data, there are 12 families falling into the $35,000 to $49,999 income range, which is the most common income bracket and makes up 20.0% of all families.
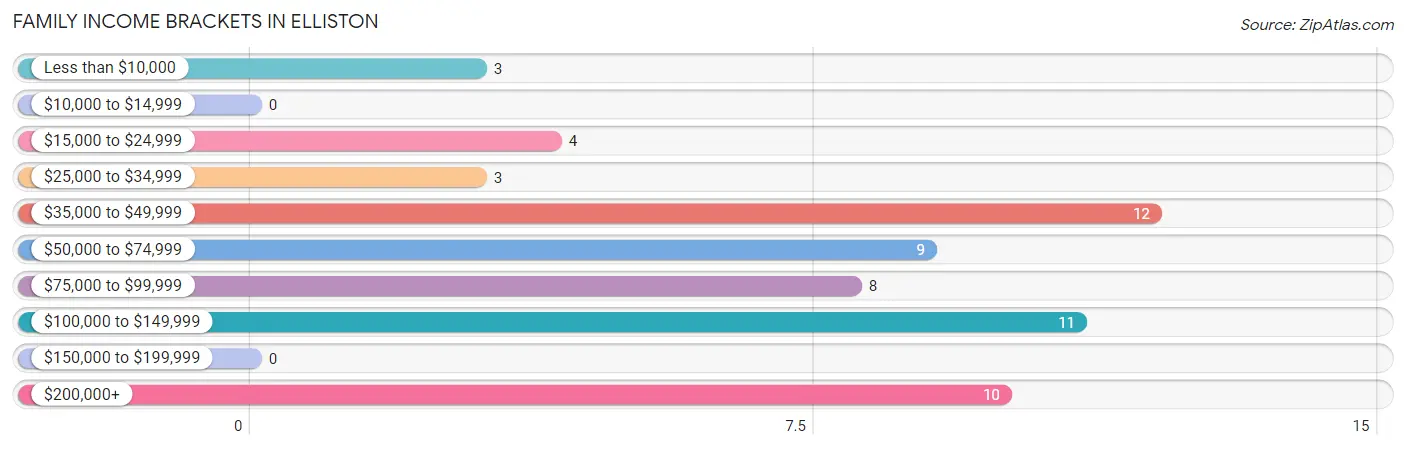
| Income Bracket | # Families | % Families |
| Less than $10,000 | 3 | 5.0% |
| $10,000 to $14,999 | 0 | 0.0% |
| $15,000 to $24,999 | 4 | 6.7% |
| $25,000 to $34,999 | 3 | 5.0% |
| $35,000 to $49,999 | 12 | 20.0% |
| $50,000 to $74,999 | 9 | 15.0% |
| $75,000 to $99,999 | 8 | 13.3% |
| $100,000 to $149,999 | 11 | 18.3% |
| $150,000 to $199,999 | 0 | 0.0% |
| $200,000+ | 10 | 16.7% |
Family Income by Famaliy Size in Elliston
2-person families (40 | 66.7%) account for the highest median family income in Elliston with $86,250 per family, while 2-person families (40 | 66.7%) have the highest median income of $43,125 per family member.
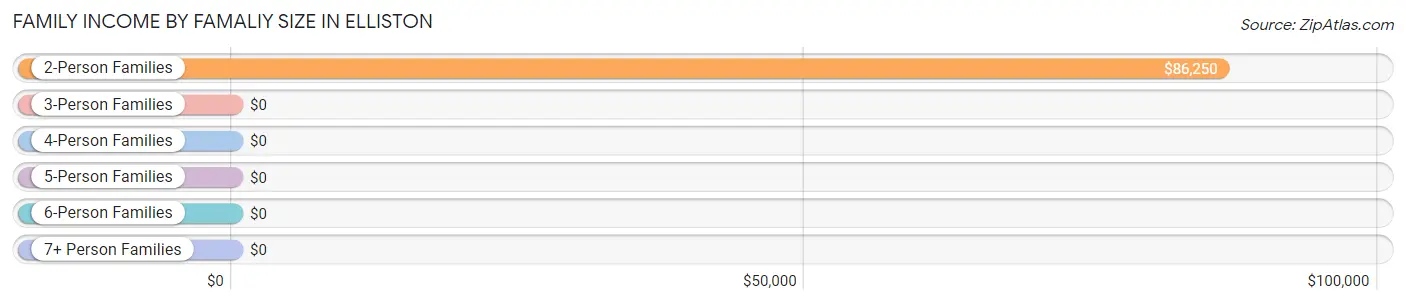
| Income Bracket | # Families | Median Income |
| 2-Person Families | 40 (66.7%) | $86,250 |
| 3-Person Families | 6 (10.0%) | $0 |
| 4-Person Families | 1 (1.7%) | $0 |
| 5-Person Families | 10 (16.7%) | $0 |
| 6-Person Families | 3 (5.0%) | $0 |
| 7+ Person Families | 0 (0.0%) | $0 |
| Total | 60 (100.0%) | $69,375 |
Family Income by Number of Earners in Elliston
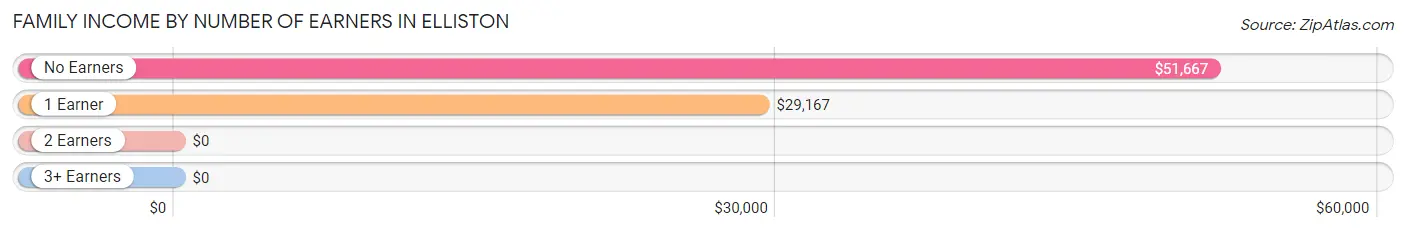
| Number of Earners | # Families | Median Income |
| No Earners | 14 (23.3%) | $51,667 |
| 1 Earner | 10 (16.7%) | $29,167 |
| 2 Earners | 30 (50.0%) | $0 |
| 3+ Earners | 6 (10.0%) | $0 |
| Total | 60 (100.0%) | $69,375 |
Household Income in Elliston
Household Income Brackets in Elliston
With 23 households falling in the category, the $35,000 to $49,999 income range is the most frequent in Elliston, accounting for 22.6% of all households. In contrast, only 4 households (3.9%) fall into the less than $10,000 income bracket, making it the least populous group.
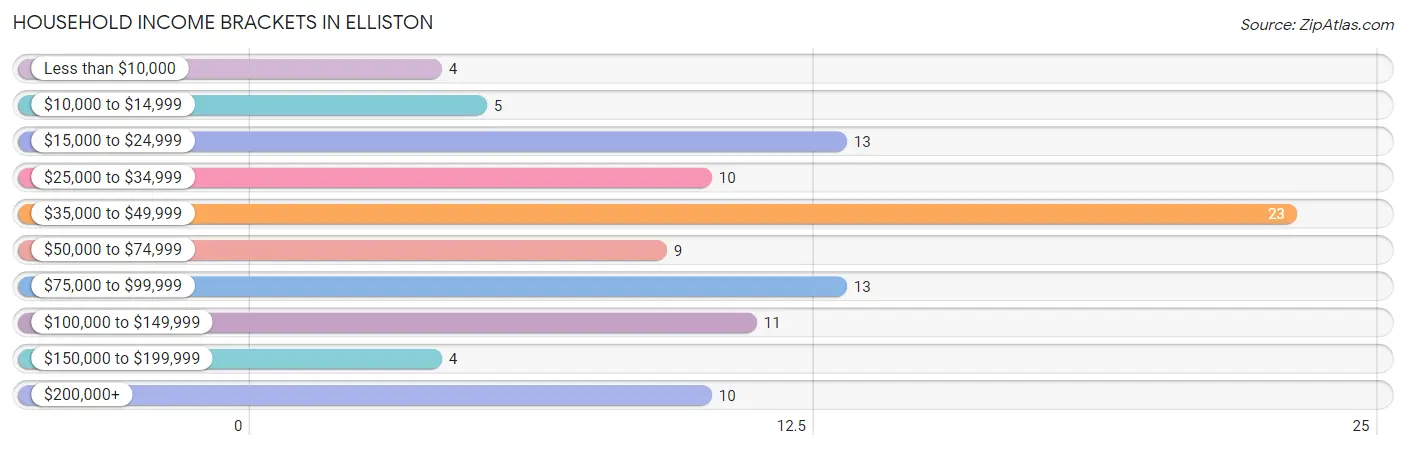
| Income Bracket | # Households | % Households |
| Less than $10,000 | 4 | 3.9% |
| $10,000 to $14,999 | 5 | 4.9% |
| $15,000 to $24,999 | 13 | 12.7% |
| $25,000 to $34,999 | 10 | 9.8% |
| $35,000 to $49,999 | 23 | 22.5% |
| $50,000 to $74,999 | 9 | 8.8% |
| $75,000 to $99,999 | 13 | 12.7% |
| $100,000 to $149,999 | 11 | 10.8% |
| $150,000 to $199,999 | 4 | 3.9% |
| $200,000+ | 10 | 9.8% |
Household Income by Householder Age in Elliston
The median household income in Elliston is $42,000, with the highest median household income of $41,944 found in the 25 to 44 years age bracket for the primary householder. A total of 28 households (27.5%) fall into this category. Meanwhile, the 15 to 24 years age bracket for the primary householder has the lowest median household income of $0, with 5 households (4.9%) in this group.
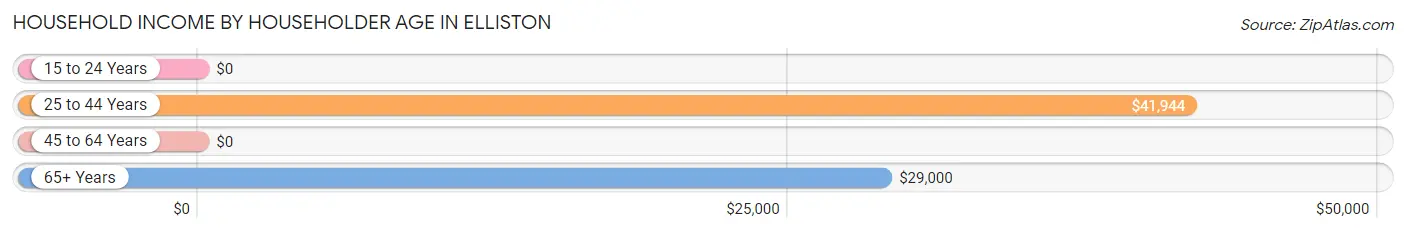
| Income Bracket | # Households | Median Income |
| 15 to 24 Years | 5 (4.9%) | $0 |
| 25 to 44 Years | 28 (27.5%) | $41,944 |
| 45 to 64 Years | 37 (36.3%) | $0 |
| 65+ Years | 32 (31.4%) | $29,000 |
| Total | 102 (100.0%) | $42,000 |
Poverty in Elliston
Income Below Poverty by Sex and Age in Elliston
With 4.2% poverty level for males and 7.8% for females among the residents of Elliston, under 5 year old males and 5 year old females are the most vulnerable to poverty, with 2 males (14.3%) and 1 females (100.0%) in their respective age groups living below the poverty level.
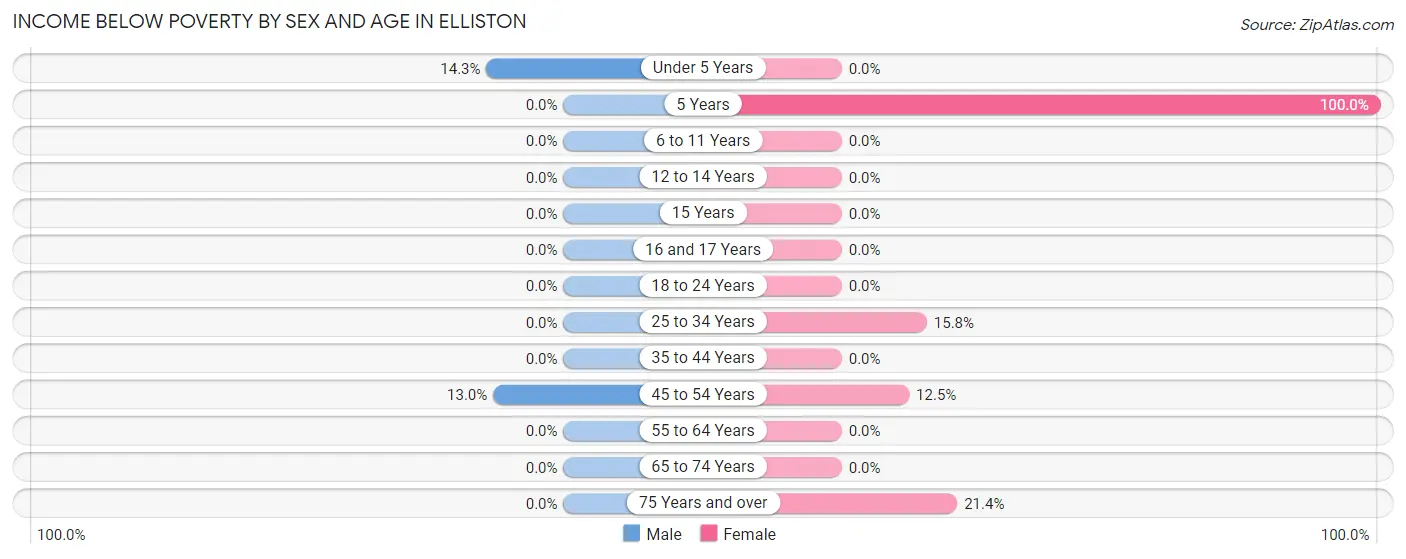
| Age Bracket | Male | Female |
| Under 5 Years | 2 (14.3%) | 0 (0.0%) |
| 5 Years | 0 (0.0%) | 1 (100.0%) |
| 6 to 11 Years | 0 (0.0%) | 0 (0.0%) |
| 12 to 14 Years | 0 (0.0%) | 0 (0.0%) |
| 15 Years | 0 (0.0%) | 0 (0.0%) |
| 16 and 17 Years | 0 (0.0%) | 0 (0.0%) |
| 18 to 24 Years | 0 (0.0%) | 0 (0.0%) |
| 25 to 34 Years | 0 (0.0%) | 3 (15.8%) |
| 35 to 44 Years | 0 (0.0%) | 0 (0.0%) |
| 45 to 54 Years | 3 (13.0%) | 1 (12.5%) |
| 55 to 64 Years | 0 (0.0%) | 0 (0.0%) |
| 65 to 74 Years | 0 (0.0%) | 0 (0.0%) |
| 75 Years and over | 0 (0.0%) | 3 (21.4%) |
| Total | 5 (4.2%) | 8 (7.8%) |
Income Above Poverty by Sex and Age in Elliston
According to the poverty statistics in Elliston, males aged 6 to 11 years and females aged under 5 years are the age groups that are most secure financially, with 100.0% of males and 100.0% of females in these age groups living above the poverty line.
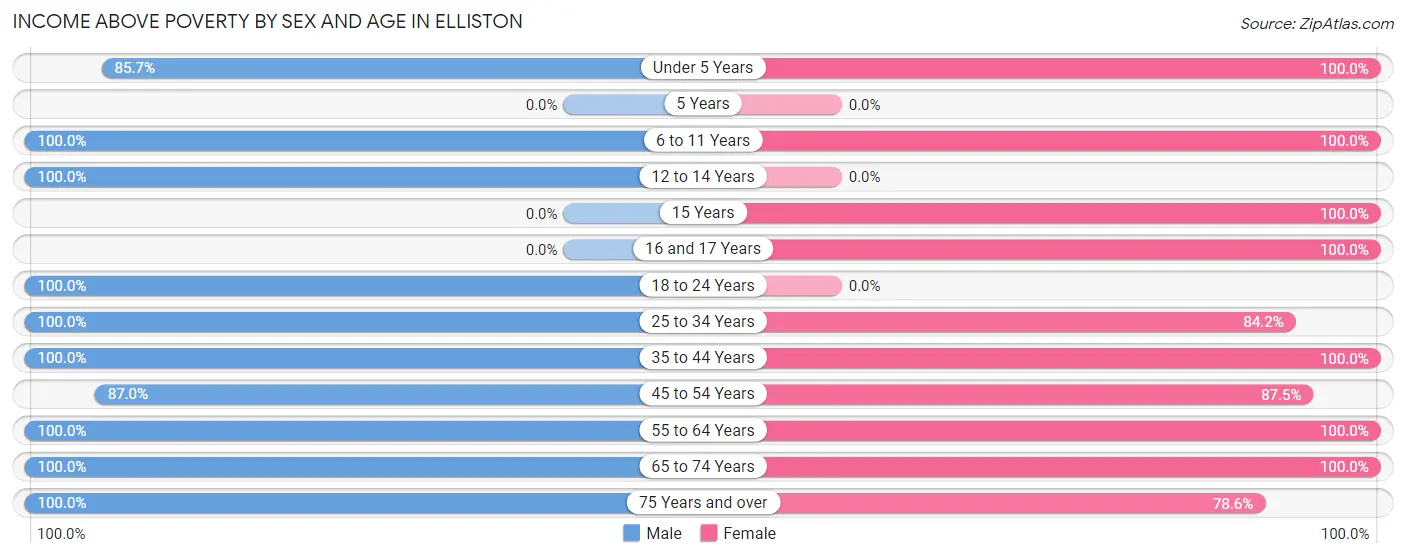
| Age Bracket | Male | Female |
| Under 5 Years | 12 (85.7%) | 8 (100.0%) |
| 5 Years | 0 (0.0%) | 0 (0.0%) |
| 6 to 11 Years | 3 (100.0%) | 2 (100.0%) |
| 12 to 14 Years | 2 (100.0%) | 0 (0.0%) |
| 15 Years | 0 (0.0%) | 10 (100.0%) |
| 16 and 17 Years | 0 (0.0%) | 8 (100.0%) |
| 18 to 24 Years | 10 (100.0%) | 0 (0.0%) |
| 25 to 34 Years | 32 (100.0%) | 16 (84.2%) |
| 35 to 44 Years | 11 (100.0%) | 7 (100.0%) |
| 45 to 54 Years | 20 (87.0%) | 7 (87.5%) |
| 55 to 64 Years | 7 (100.0%) | 12 (100.0%) |
| 65 to 74 Years | 11 (100.0%) | 14 (100.0%) |
| 75 Years and over | 7 (100.0%) | 11 (78.6%) |
| Total | 115 (95.8%) | 95 (92.2%) |
Income Below Poverty Among Married-Couple Families in Elliston
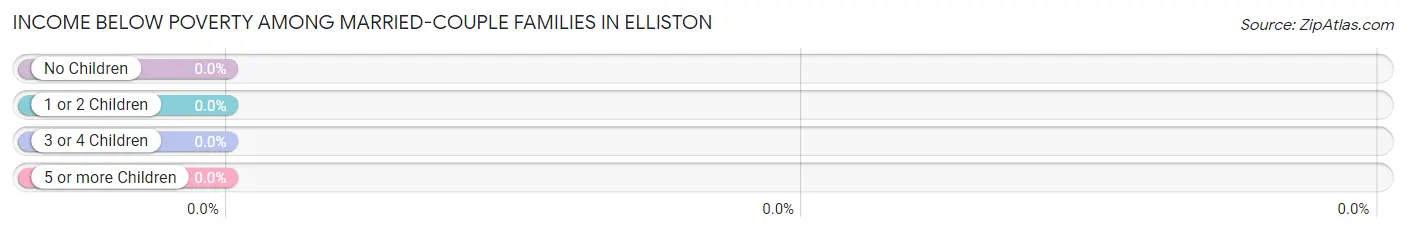
| Children | Above Poverty | Below Poverty |
| No Children | 37 (100.0%) | 0 (0.0%) |
| 1 or 2 Children | 1 (100.0%) | 0 (0.0%) |
| 3 or 4 Children | 13 (100.0%) | 0 (0.0%) |
| 5 or more Children | 0 (0.0%) | 0 (0.0%) |
| Total | 51 (100.0%) | 0 (0.0%) |
Income Below Poverty Among Single-Parent Households in Elliston
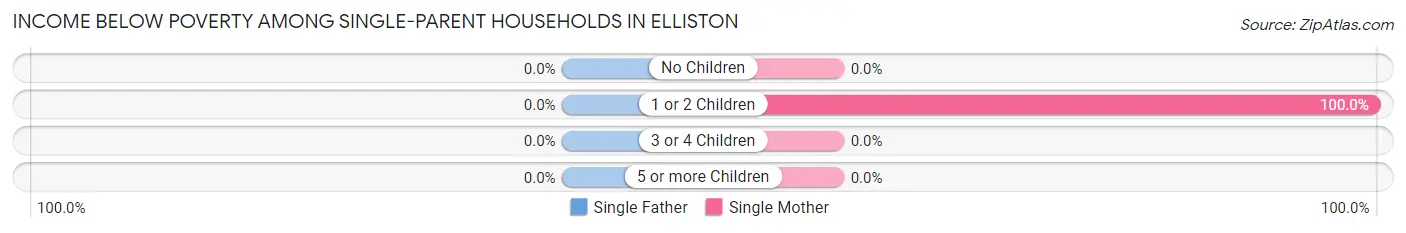
| Children | Single Father | Single Mother |
| No Children | 0 (0.0%) | 0 (0.0%) |
| 1 or 2 Children | 0 (0.0%) | 3 (100.0%) |
| 3 or 4 Children | 0 (0.0%) | 0 (0.0%) |
| 5 or more Children | 0 (0.0%) | 0 (0.0%) |
| Total | 0 (0.0%) | 3 (33.3%) |
Income Below Poverty Among Married-Couple vs Single-Parent Households in Elliston
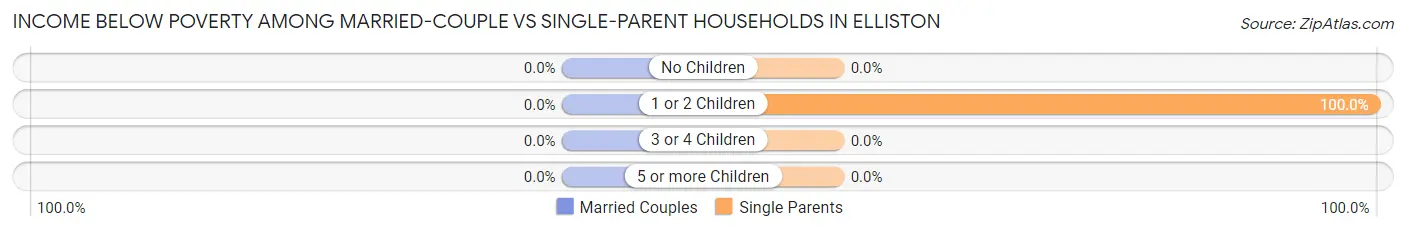
| Children | Married-Couple Families | Single-Parent Households |
| No Children | 0 (0.0%) | 0 (0.0%) |
| 1 or 2 Children | 0 (0.0%) | 3 (100.0%) |
| 3 or 4 Children | 0 (0.0%) | 0 (0.0%) |
| 5 or more Children | 0 (0.0%) | 0 (0.0%) |
| Total | 0 (0.0%) | 3 (33.3%) |
Race in Elliston
The most populous races in Elliston are White / Caucasian (208 | 93.3%), Native / Alaskan (11 | 4.9%), and Two or more Races (4 | 1.8%).
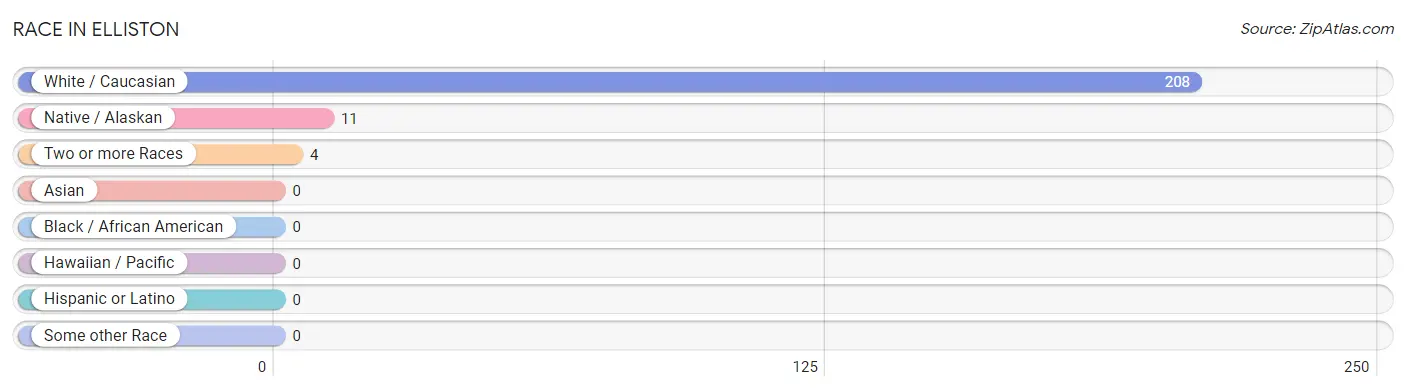
| Race | # Population | % Population |
| Asian | 0 | 0.0% |
| Black / African American | 0 | 0.0% |
| Hawaiian / Pacific | 0 | 0.0% |
| Hispanic or Latino | 0 | 0.0% |
| Native / Alaskan | 11 | 4.9% |
| White / Caucasian | 208 | 93.3% |
| Two or more Races | 4 | 1.8% |
| Some other Race | 0 | 0.0% |
| Total | 223 | 100.0% |
Ancestry in Elliston
The most populous ancestries reported in Elliston are German (112 | 50.2%), Irish (47 | 21.1%), Scottish (37 | 16.6%), English (32 | 14.3%), and Norwegian (25 | 11.2%), together accounting for 113.5% of all Elliston residents.
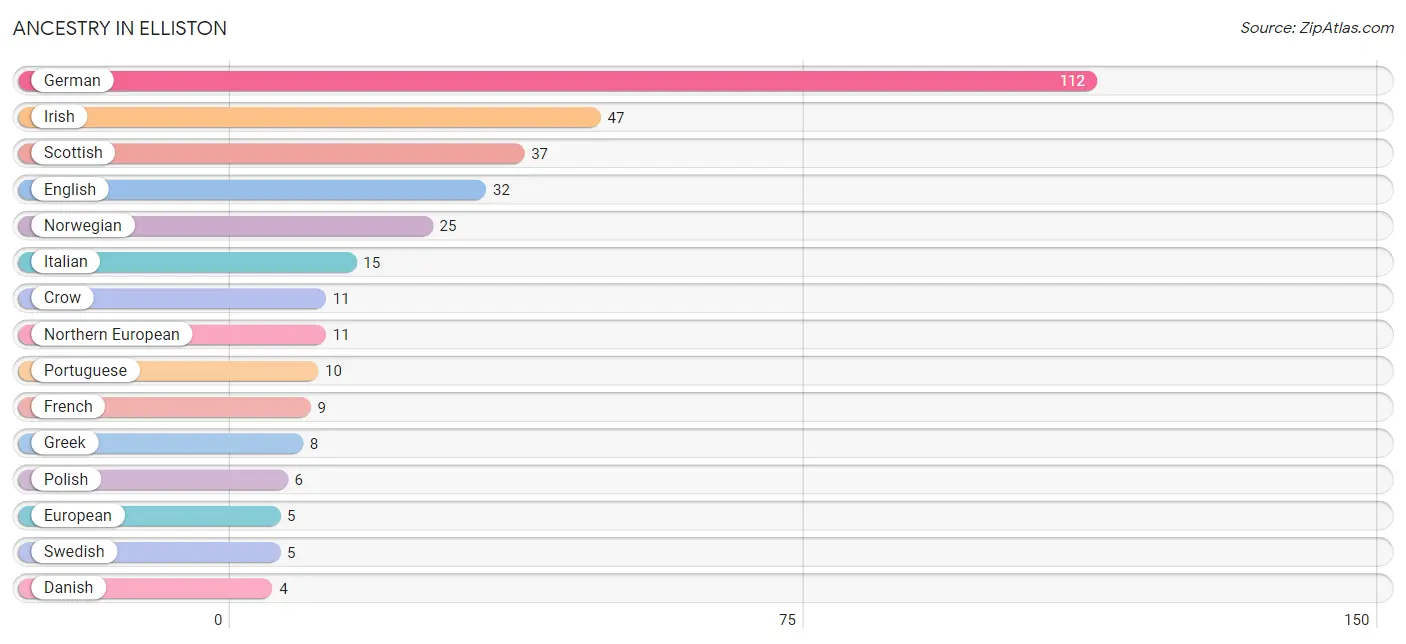
| Ancestry | # Population | % Population |
| Austrian | 2 | 0.9% |
| Cherokee | 1 | 0.4% |
| Crow | 11 | 4.9% |
| Czechoslovakian | 2 | 0.9% |
| Danish | 4 | 1.8% |
| Dutch | 3 | 1.3% |
| English | 32 | 14.3% |
| European | 5 | 2.2% |
| Finnish | 3 | 1.3% |
| French | 9 | 4.0% |
| German | 112 | 50.2% |
| Greek | 8 | 3.6% |
| Irish | 47 | 21.1% |
| Italian | 15 | 6.7% |
| Northern European | 11 | 4.9% |
| Norwegian | 25 | 11.2% |
| Polish | 6 | 2.7% |
| Portuguese | 10 | 4.5% |
| Scandinavian | 3 | 1.3% |
| Scottish | 37 | 16.6% |
| Sioux | 2 | 0.9% |
| Swedish | 5 | 2.2% | View All 22 Rows |
Immigrants in Elliston

| Immigration Origin | # Population | % Population | View All 0 Rows |
Sex and Age in Elliston
Sex and Age in Elliston
The most populous age groups in Elliston are 25 to 29 Years (17 | 14.2%) for men and 15 to 19 Years (18 | 17.5%) for women.
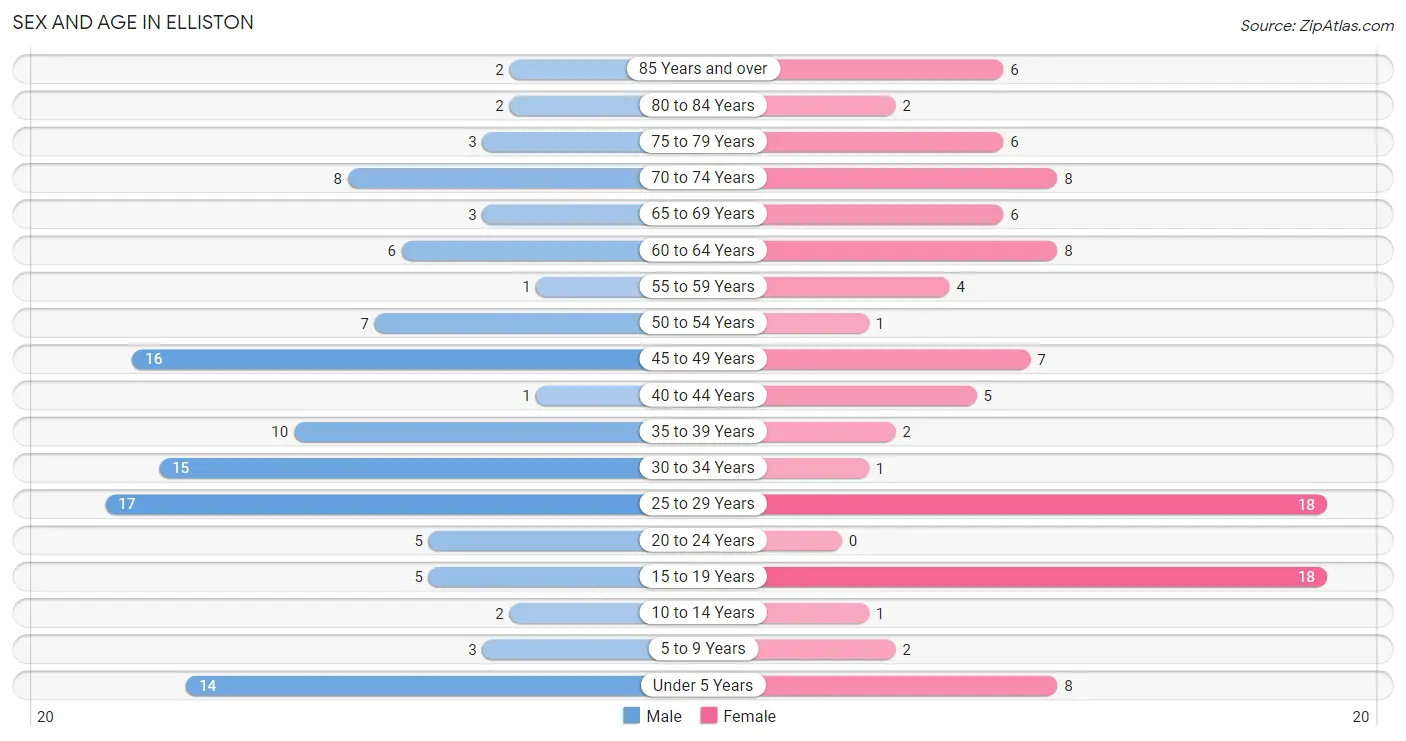
| Age Bracket | Male | Female |
| Under 5 Years | 14 (11.7%) | 8 (7.8%) |
| 5 to 9 Years | 3 (2.5%) | 2 (1.9%) |
| 10 to 14 Years | 2 (1.7%) | 1 (1.0%) |
| 15 to 19 Years | 5 (4.2%) | 18 (17.5%) |
| 20 to 24 Years | 5 (4.2%) | 0 (0.0%) |
| 25 to 29 Years | 17 (14.2%) | 18 (17.5%) |
| 30 to 34 Years | 15 (12.5%) | 1 (1.0%) |
| 35 to 39 Years | 10 (8.3%) | 2 (1.9%) |
| 40 to 44 Years | 1 (0.8%) | 5 (4.9%) |
| 45 to 49 Years | 16 (13.3%) | 7 (6.8%) |
| 50 to 54 Years | 7 (5.8%) | 1 (1.0%) |
| 55 to 59 Years | 1 (0.8%) | 4 (3.9%) |
| 60 to 64 Years | 6 (5.0%) | 8 (7.8%) |
| 65 to 69 Years | 3 (2.5%) | 6 (5.8%) |
| 70 to 74 Years | 8 (6.7%) | 8 (7.8%) |
| 75 to 79 Years | 3 (2.5%) | 6 (5.8%) |
| 80 to 84 Years | 2 (1.7%) | 2 (1.9%) |
| 85 Years and over | 2 (1.7%) | 6 (5.8%) |
| Total | 120 (100.0%) | 103 (100.0%) |
Families and Households in Elliston
Median Family Size in Elliston
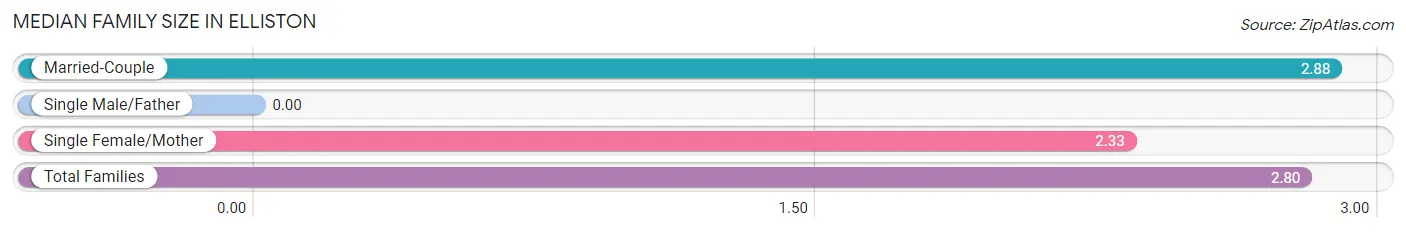
| Family Type | # Families | Family Size |
| Married-Couple | 51 (85.0%) | 2.88 |
| Single Male/Father | 0 (0.0%) | - |
| Single Female/Mother | 9 (15.0%) | 2.33 |
| Total Families | 60 (100.0%) | 2.80 |
Median Household Size in Elliston
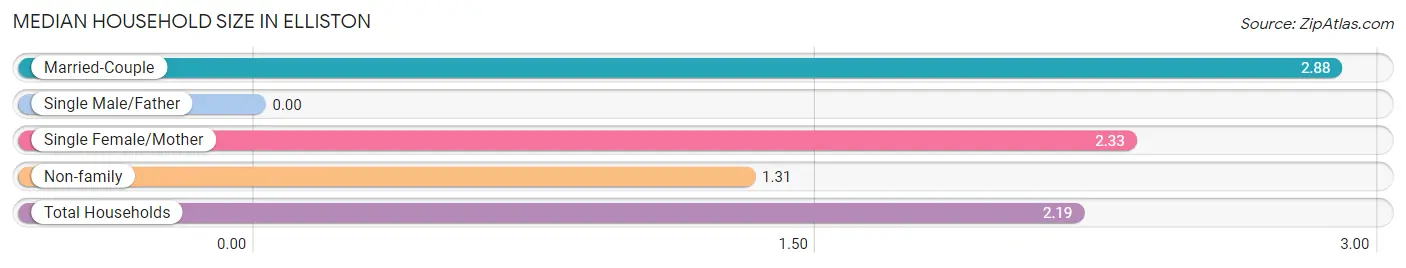
| Household Type | # Households | Household Size |
| Married-Couple | 51 (50.0%) | 2.88 |
| Single Male/Father | 0 (0.0%) | - |
| Single Female/Mother | 9 (8.8%) | 2.33 |
| Non-family | 42 (41.2%) | 1.31 |
| Total Households | 102 (100.0%) | 2.19 |
Household Size by Marriage Status in Elliston
Out of a total of 102 households in Elliston, 60 (58.8%) are family households, while 42 (41.2%) are nonfamily households. The most numerous type of family households are 2-person households, comprising 40, and the most common type of nonfamily households are 1-person households, comprising 33.
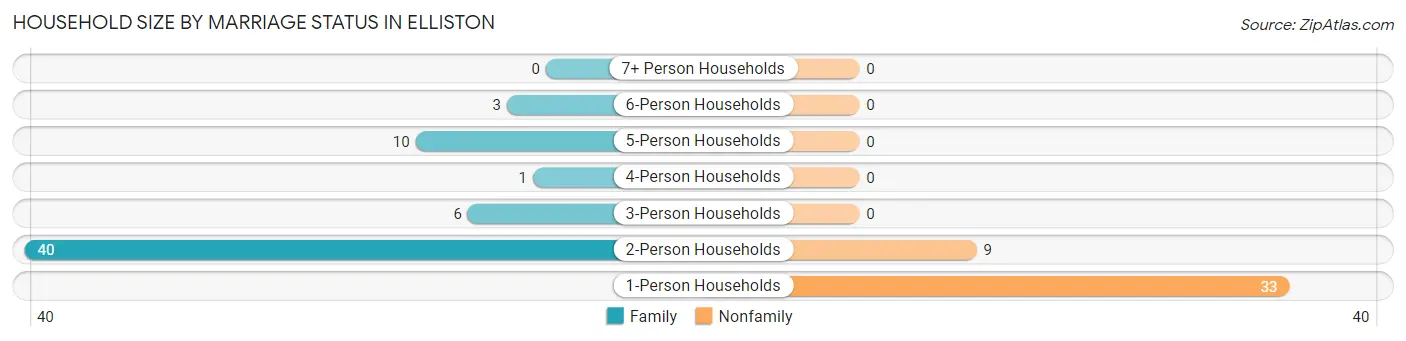
| Household Size | Family Households | Nonfamily Households |
| 1-Person Households | - | 33 (32.4%) |
| 2-Person Households | 40 (39.2%) | 9 (8.8%) |
| 3-Person Households | 6 (5.9%) | 0 (0.0%) |
| 4-Person Households | 1 (1.0%) | 0 (0.0%) |
| 5-Person Households | 10 (9.8%) | 0 (0.0%) |
| 6-Person Households | 3 (2.9%) | 0 (0.0%) |
| 7+ Person Households | 0 (0.0%) | 0 (0.0%) |
| Total | 60 (58.8%) | 42 (41.2%) |
Female Fertility in Elliston
Fertility by Age in Elliston
Average fertility rate in Elliston is 38.0 births per 1,000 women. Women in the age bracket of 35 to 50 years have the highest fertility rate with 133.0 births per 1,000 women. Women in the age bracket of 35 to 50 years acount for 100.0% of all women with births.
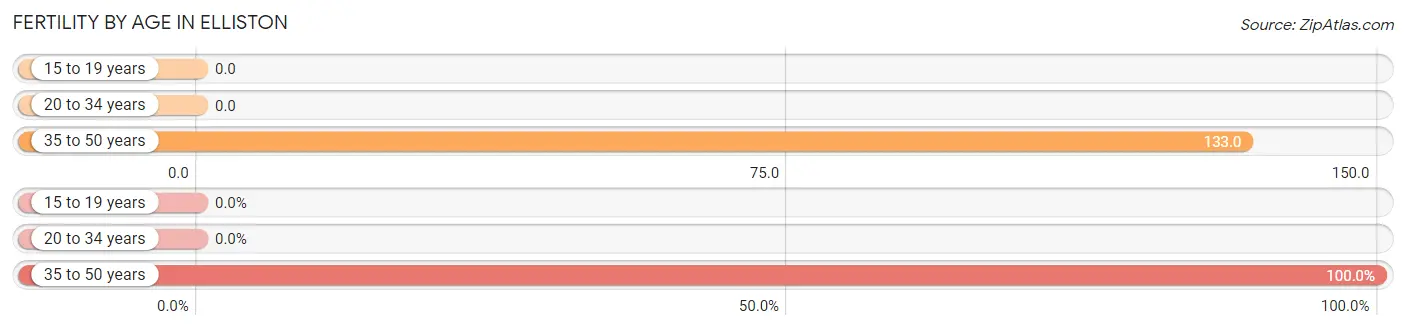
| Age Bracket | Women with Births | Births / 1,000 Women |
| 15 to 19 years | 0 (0.0%) | 0.0 |
| 20 to 34 years | 0 (0.0%) | 0.0 |
| 35 to 50 years | 2 (100.0%) | 133.0 |
| Total | 2 (100.0%) | 38.0 |
Fertility by Age by Marriage Status in Elliston
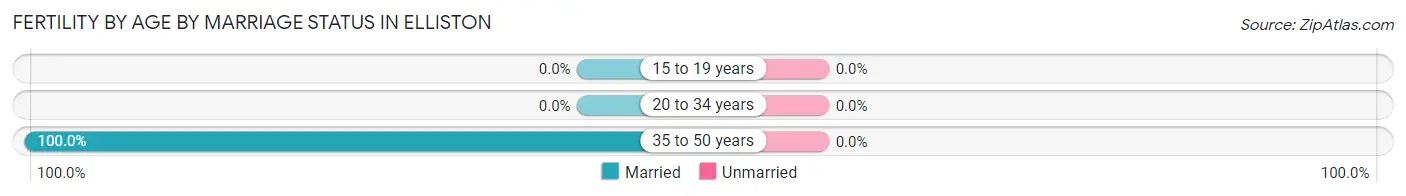
| Age Bracket | Married | Unmarried |
| 15 to 19 years | 0 (0.0%) | 0 (0.0%) |
| 20 to 34 years | 0 (0.0%) | 0 (0.0%) |
| 35 to 50 years | 2 (100.0%) | 0 (0.0%) |
| Total | 2 (100.0%) | 0 (0.0%) |
Fertility by Education in Elliston
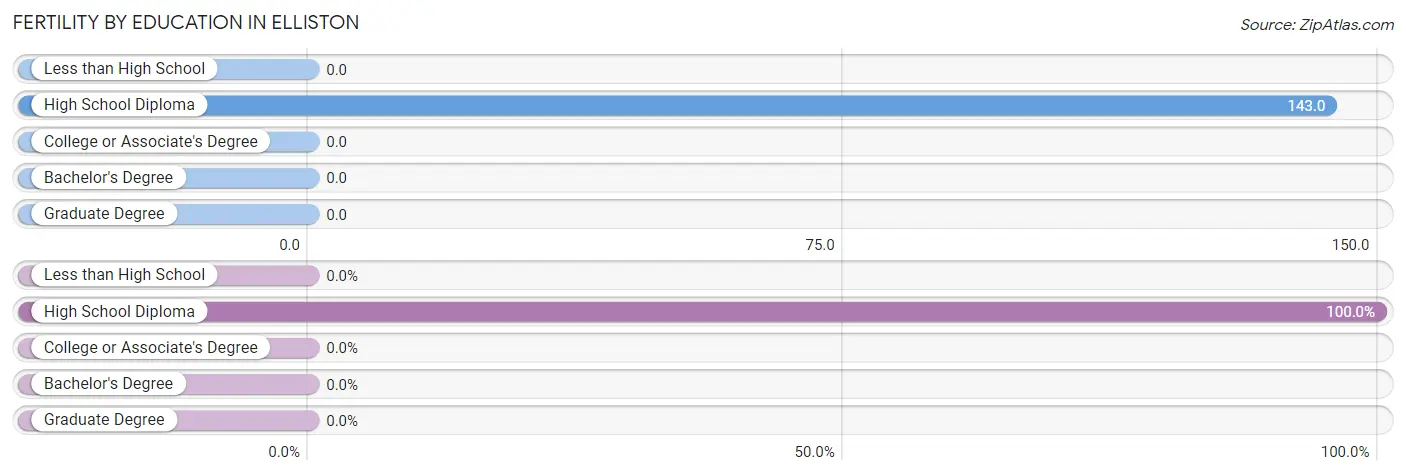
| Educational Attainment | Women with Births | Births / 1,000 Women |
| Less than High School | 0 (0.0%) | 0.0 |
| High School Diploma | 2 (100.0%) | 143.0 |
| College or Associate's Degree | 0 (0.0%) | 0.0 |
| Bachelor's Degree | 0 (0.0%) | 0.0 |
| Graduate Degree | 0 (0.0%) | 0.0 |
| Total | 2 (100.0%) | 38.0 |
Fertility by Education by Marriage Status in Elliston
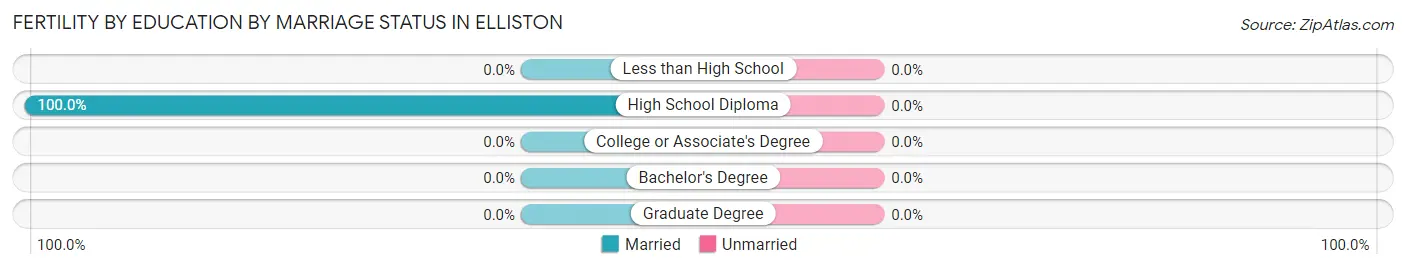
| Educational Attainment | Married | Unmarried |
| Less than High School | 0 (0.0%) | 0 (0.0%) |
| High School Diploma | 2 (100.0%) | 0 (0.0%) |
| College or Associate's Degree | 0 (0.0%) | 0 (0.0%) |
| Bachelor's Degree | 0 (0.0%) | 0 (0.0%) |
| Graduate Degree | 0 (0.0%) | 0 (0.0%) |
| Total | 2 (100.0%) | 0 (0.0%) |
Employment Characteristics in Elliston
Employment by Class of Employer in Elliston
Among the 123 employed individuals in Elliston, private company employees (86 | 69.9%), state government employees (10 | 8.1%), and federal government employees (10 | 8.1%) make up the most common classes of employment.
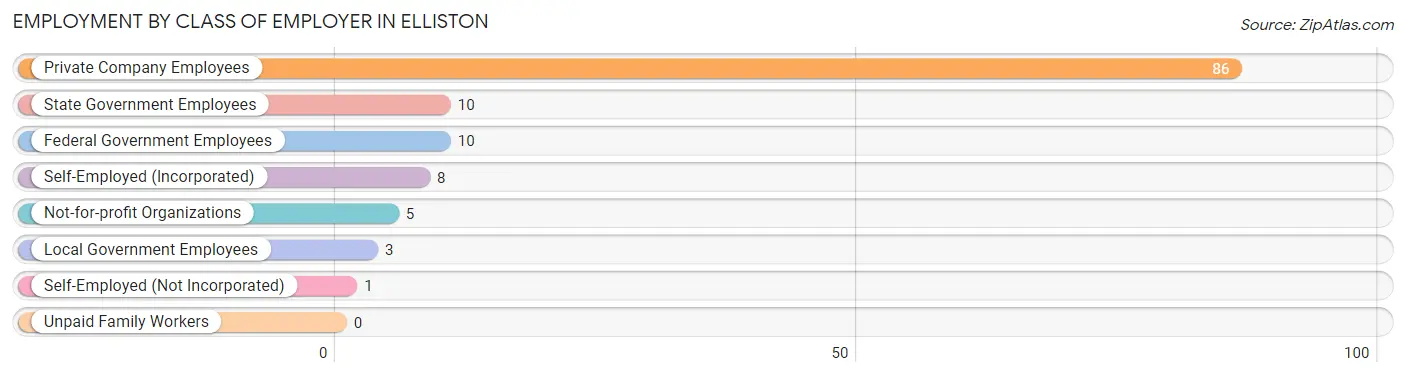
| Employer Class | # Employees | % Employees |
| Private Company Employees | 86 | 69.9% |
| Self-Employed (Incorporated) | 8 | 6.5% |
| Self-Employed (Not Incorporated) | 1 | 0.8% |
| Not-for-profit Organizations | 5 | 4.1% |
| Local Government Employees | 3 | 2.4% |
| State Government Employees | 10 | 8.1% |
| Federal Government Employees | 10 | 8.1% |
| Unpaid Family Workers | 0 | 0.0% |
| Total | 123 | 100.0% |
Employment Status by Age in Elliston
According to the labor force statistics for Elliston, out of the total population over 16 years of age (183), 72.7% or 133 individuals are in the labor force, with 6.1% or 8 of them unemployed. The age group with the highest labor force participation rate is 16 to 19 years, with 100.0% or 13 individuals in the labor force. Within the labor force, the 35 to 44 years age range has the highest percentage of unemployed individuals, with 41.2% or 7 of them being unemployed.
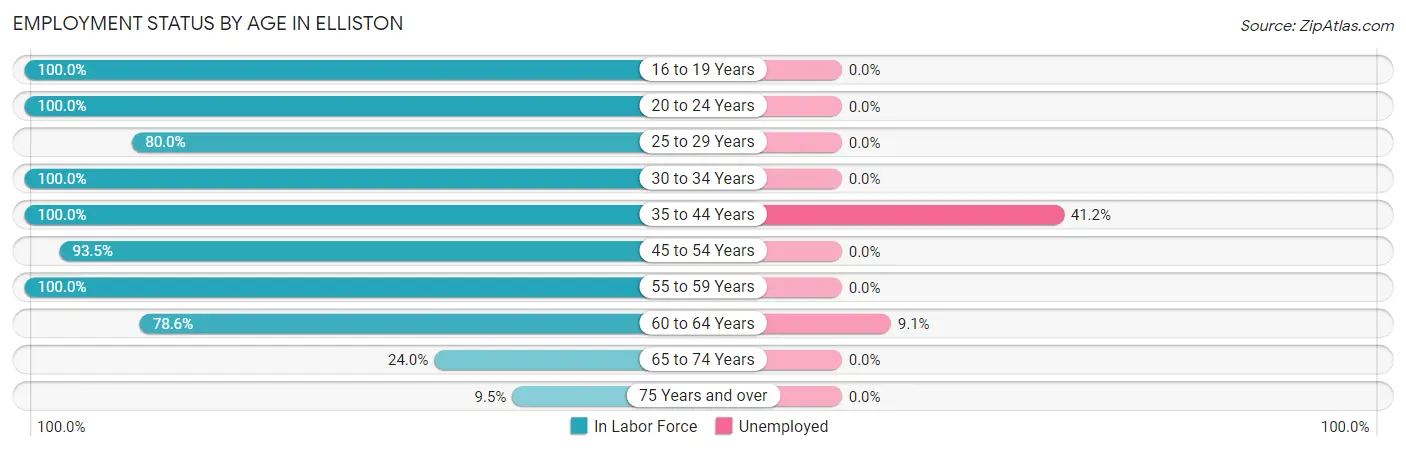
| Age Bracket | In Labor Force | Unemployed |
| 16 to 19 Years | 13 (100.0%) | 0 (0.0%) |
| 20 to 24 Years | 5 (100.0%) | 0 (0.0%) |
| 25 to 29 Years | 28 (80.0%) | 0 (0.0%) |
| 30 to 34 Years | 16 (100.0%) | 0 (0.0%) |
| 35 to 44 Years | 18 (100.0%) | 7 (41.2%) |
| 45 to 54 Years | 29 (93.5%) | 0 (0.0%) |
| 55 to 59 Years | 5 (100.0%) | 0 (0.0%) |
| 60 to 64 Years | 11 (78.6%) | 1 (9.1%) |
| 65 to 74 Years | 6 (24.0%) | 0 (0.0%) |
| 75 Years and over | 2 (9.5%) | 0 (0.0%) |
| Total | 133 (72.7%) | 8 (6.1%) |
Employment Status by Educational Attainment in Elliston
According to labor force statistics for Elliston, 89.9% of individuals (107) out of the total population between 25 and 64 years of age (119) are in the labor force, with 7.5% or 8 of them being unemployed. The group with the highest labor force participation rate are those with the educational attainment of less than high school, with 100.0% or 16 individuals in the labor force. Within the labor force, individuals with less than high school education have the highest percentage of unemployment, with 50.0% or 8 of them being unemployed.
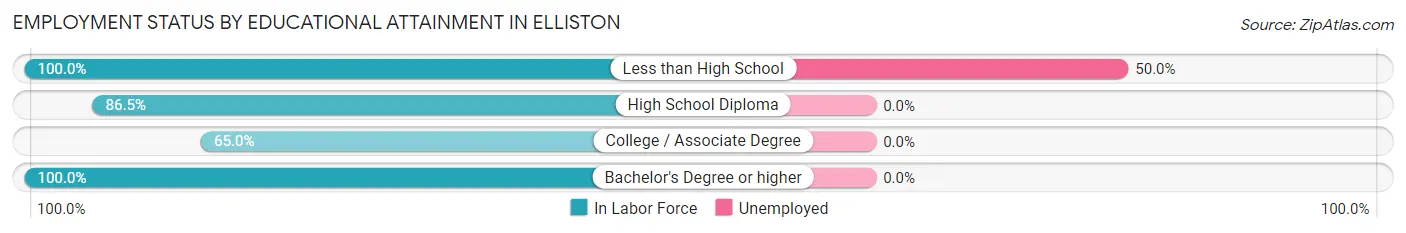
| Educational Attainment | In Labor Force | Unemployed |
| Less than High School | 16 (100.0%) | 8 (50.0%) |
| High School Diploma | 32 (86.5%) | 0 (0.0%) |
| College / Associate Degree | 13 (65.0%) | 0 (0.0%) |
| Bachelor's Degree or higher | 46 (100.0%) | 0 (0.0%) |
| Total | 107 (89.9%) | 9 (7.5%) |
Employment Occupations by Sex in Elliston
Management, Business, Science and Arts Occupations
The most common Management, Business, Science and Arts occupations in Elliston are Management (19 | 15.3%), Business & Financial (5 | 4.0%), Health Diagnosing & Treating (5 | 4.0%), Health Technologists (5 | 4.0%), and Computers, Engineering & Science (4 | 3.2%).
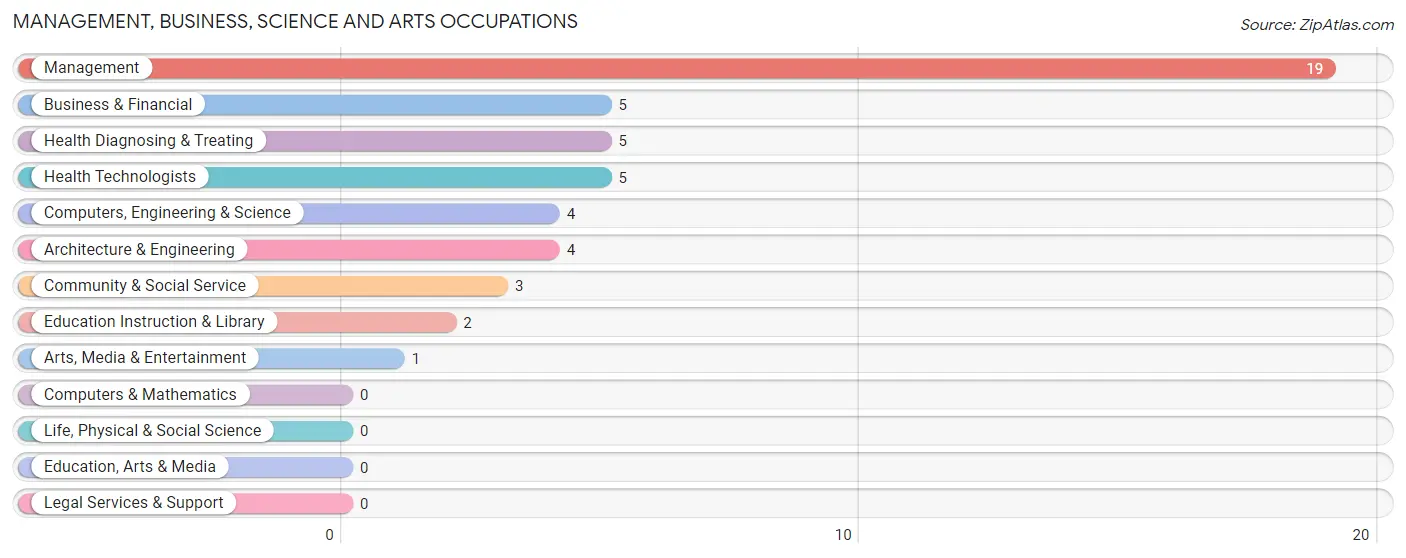
Management, Business, Science and Arts Occupations by Sex
Within the Management, Business, Science and Arts occupations in Elliston, the most male-oriented occupations are Computers, Engineering & Science (100.0%), Architecture & Engineering (100.0%), and Management (73.7%), while the most female-oriented occupations are Business & Financial (100.0%), Community & Social Service (100.0%), and Education Instruction & Library (100.0%).
| Occupation | Male | Female |
| Management | 14 (73.7%) | 5 (26.3%) |
| Business & Financial | 0 (0.0%) | 5 (100.0%) |
| Computers, Engineering & Science | 4 (100.0%) | 0 (0.0%) |
| Computers & Mathematics | 0 (0.0%) | 0 (0.0%) |
| Architecture & Engineering | 4 (100.0%) | 0 (0.0%) |
| Life, Physical & Social Science | 0 (0.0%) | 0 (0.0%) |
| Community & Social Service | 0 (0.0%) | 3 (100.0%) |
| Education, Arts & Media | 0 (0.0%) | 0 (0.0%) |
| Legal Services & Support | 0 (0.0%) | 0 (0.0%) |
| Education Instruction & Library | 0 (0.0%) | 2 (100.0%) |
| Arts, Media & Entertainment | 0 (0.0%) | 1 (100.0%) |
| Health Diagnosing & Treating | 0 (0.0%) | 5 (100.0%) |
| Health Technologists | 0 (0.0%) | 5 (100.0%) |
| Total (Category) | 18 (50.0%) | 18 (50.0%) |
| Total (Overall) | 75 (60.5%) | 49 (39.5%) |
Services Occupations
The most common Services occupations in Elliston are Food Preparation & Serving (21 | 16.9%), Cleaning & Maintenance (4 | 3.2%), and Healthcare Support (2 | 1.6%).
Services Occupations by Sex
Within the Services occupations in Elliston, the most male-oriented occupations are Cleaning & Maintenance (75.0%), and Food Preparation & Serving (61.9%), while the most female-oriented occupations are Healthcare Support (100.0%), Food Preparation & Serving (38.1%), and Cleaning & Maintenance (25.0%).
| Occupation | Male | Female |
| Healthcare Support | 0 (0.0%) | 2 (100.0%) |
| Security & Protection | 0 (0.0%) | 0 (0.0%) |
| Firefighting & Prevention | 0 (0.0%) | 0 (0.0%) |
| Law Enforcement | 0 (0.0%) | 0 (0.0%) |
| Food Preparation & Serving | 13 (61.9%) | 8 (38.1%) |
| Cleaning & Maintenance | 3 (75.0%) | 1 (25.0%) |
| Personal Care & Service | 0 (0.0%) | 0 (0.0%) |
| Total (Category) | 16 (59.3%) | 11 (40.7%) |
| Total (Overall) | 75 (60.5%) | 49 (39.5%) |
Sales and Office Occupations
The most common Sales and Office occupations in Elliston are Office & Administration (18 | 14.5%), and Sales & Related (6 | 4.8%).
Sales and Office Occupations by Sex

| Occupation | Male | Female |
| Sales & Related | 6 (100.0%) | 0 (0.0%) |
| Office & Administration | 7 (38.9%) | 11 (61.1%) |
| Total (Category) | 13 (54.2%) | 11 (45.8%) |
| Total (Overall) | 75 (60.5%) | 49 (39.5%) |
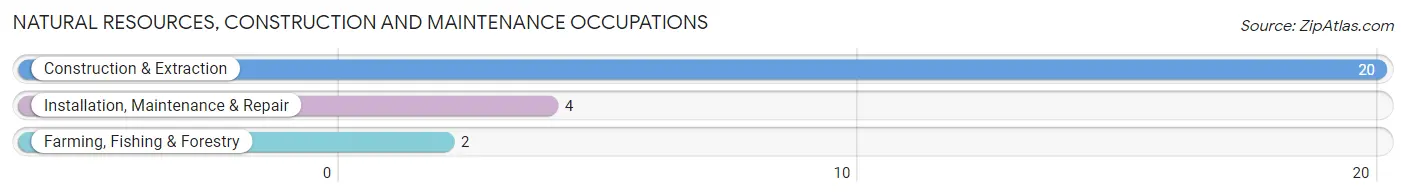
Natural Resources, Construction and Maintenance Occupations
The most common Natural Resources, Construction and Maintenance occupations in Elliston are Construction & Extraction (20 | 16.1%), Installation, Maintenance & Repair (4 | 3.2%), and Farming, Fishing & Forestry (2 | 1.6%).
Natural Resources, Construction and Maintenance Occupations by Sex
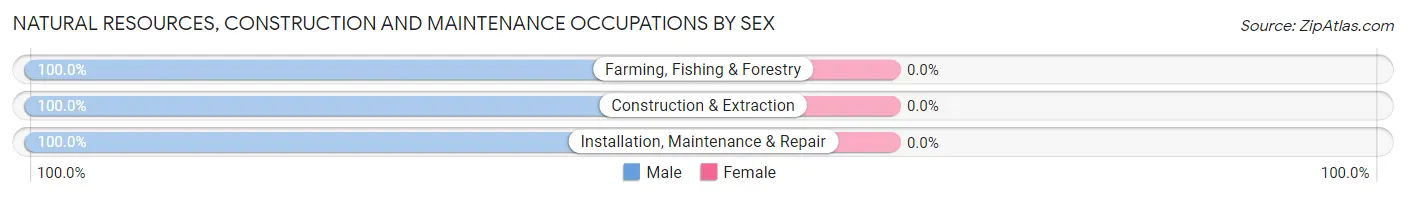
| Occupation | Male | Female |
| Farming, Fishing & Forestry | 2 (100.0%) | 0 (0.0%) |
| Construction & Extraction | 20 (100.0%) | 0 (0.0%) |
| Installation, Maintenance & Repair | 4 (100.0%) | 0 (0.0%) |
| Total (Category) | 26 (100.0%) | 0 (0.0%) |
| Total (Overall) | 75 (60.5%) | 49 (39.5%) |
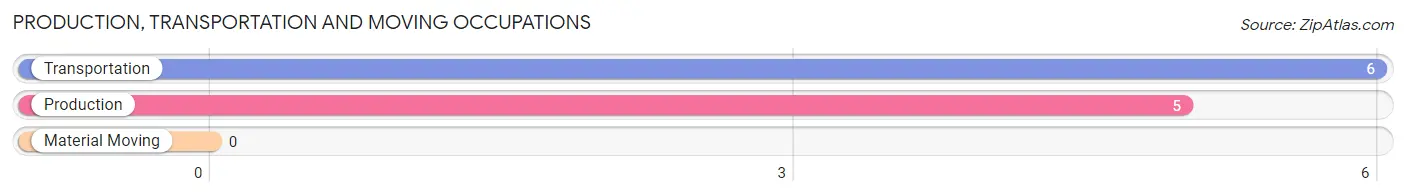
Production, Transportation and Moving Occupations
The most common Production, Transportation and Moving occupations in Elliston are Transportation (6 | 4.8%), and Production (5 | 4.0%).
Production, Transportation and Moving Occupations by Sex
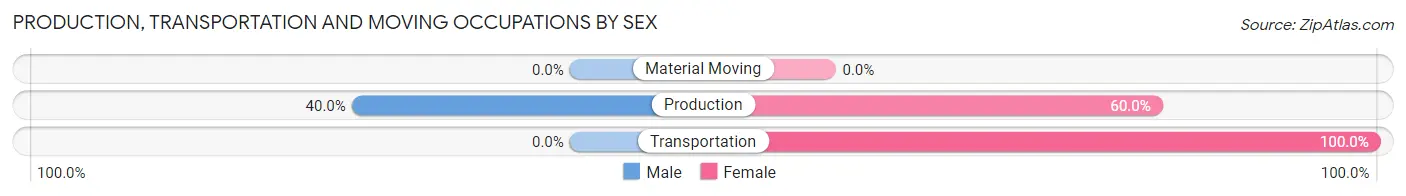
| Occupation | Male | Female |
| Production | 2 (40.0%) | 3 (60.0%) |
| Transportation | 0 (0.0%) | 6 (100.0%) |
| Material Moving | 0 (0.0%) | 0 (0.0%) |
| Total (Category) | 2 (18.2%) | 9 (81.8%) |
| Total (Overall) | 75 (60.5%) | 49 (39.5%) |
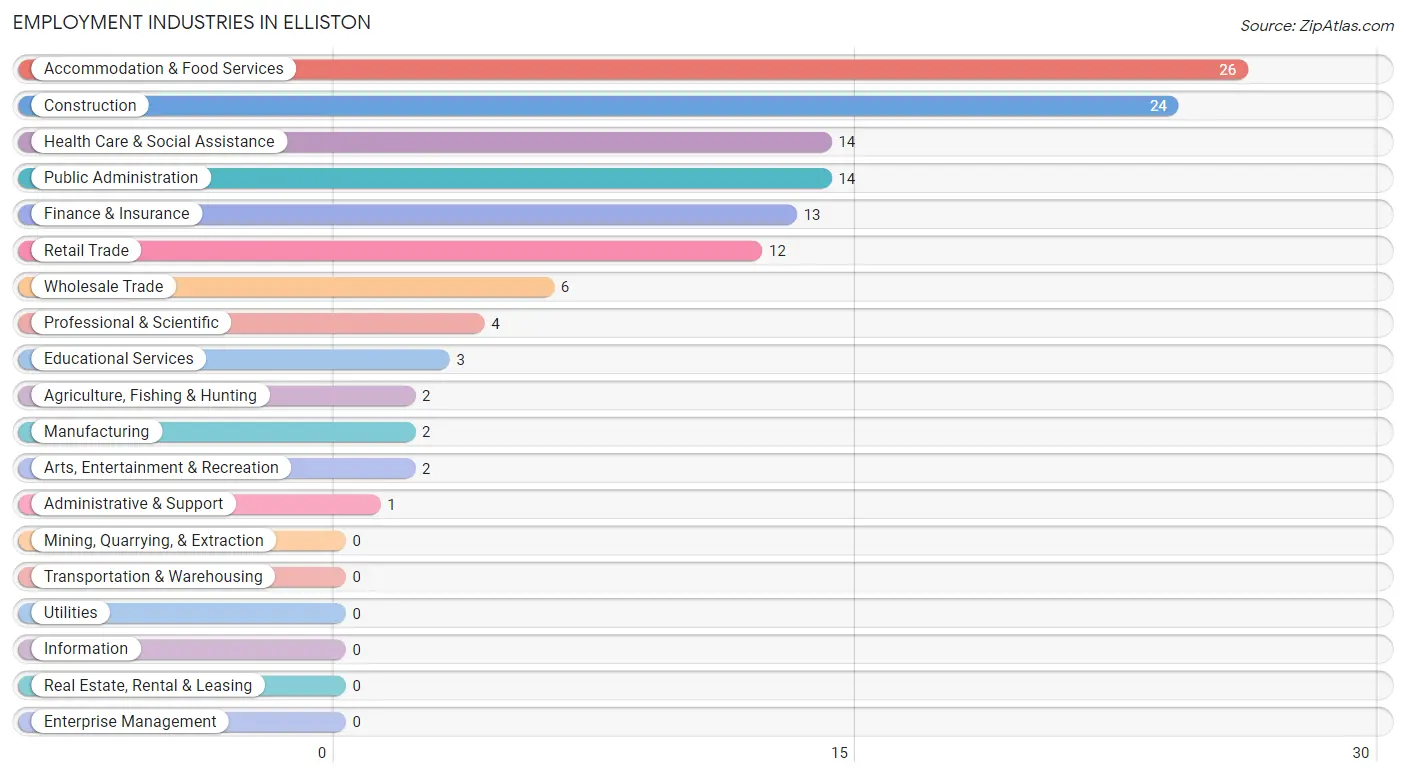
Employment Industries by Sex in Elliston
Employment Industries in Elliston
The major employment industries in Elliston include Accommodation & Food Services (26 | 21.0%), Construction (24 | 19.4%), Health Care & Social Assistance (14 | 11.3%), Public Administration (14 | 11.3%), and Finance & Insurance (13 | 10.5%).
Employment Industries by Sex in Elliston
The Elliston industries that see more men than women are Agriculture, Fishing & Hunting (100.0%), Manufacturing (100.0%), and Professional & Scientific (100.0%), whereas the industries that tend to have a higher number of women are Wholesale Trade (100.0%), Administrative & Support (100.0%), and Educational Services (100.0%).
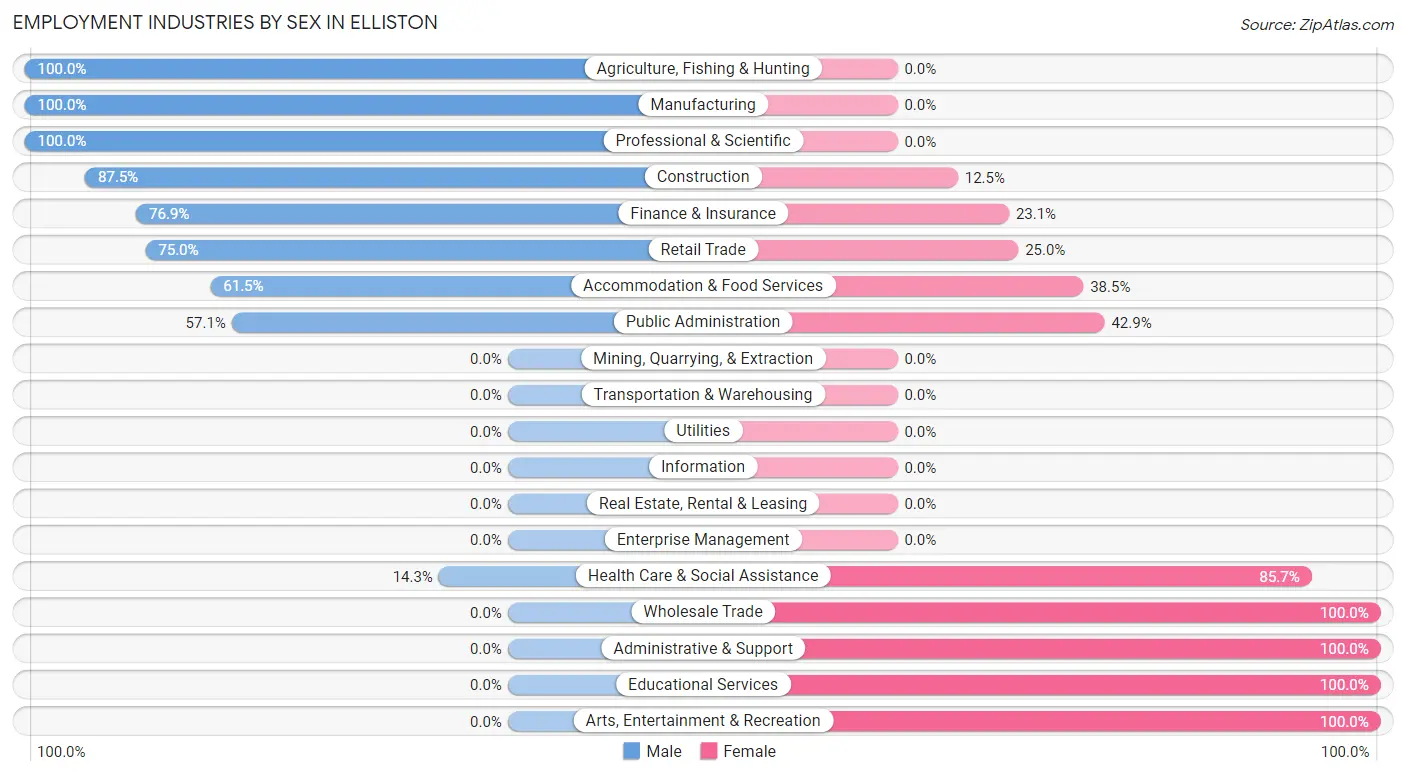
| Industry | Male | Female |
| Agriculture, Fishing & Hunting | 2 (100.0%) | 0 (0.0%) |
| Mining, Quarrying, & Extraction | 0 (0.0%) | 0 (0.0%) |
| Construction | 21 (87.5%) | 3 (12.5%) |
| Manufacturing | 2 (100.0%) | 0 (0.0%) |
| Wholesale Trade | 0 (0.0%) | 6 (100.0%) |
| Retail Trade | 9 (75.0%) | 3 (25.0%) |
| Transportation & Warehousing | 0 (0.0%) | 0 (0.0%) |
| Utilities | 0 (0.0%) | 0 (0.0%) |
| Information | 0 (0.0%) | 0 (0.0%) |
| Finance & Insurance | 10 (76.9%) | 3 (23.1%) |
| Real Estate, Rental & Leasing | 0 (0.0%) | 0 (0.0%) |
| Professional & Scientific | 4 (100.0%) | 0 (0.0%) |
| Enterprise Management | 0 (0.0%) | 0 (0.0%) |
| Administrative & Support | 0 (0.0%) | 1 (100.0%) |
| Educational Services | 0 (0.0%) | 3 (100.0%) |
| Health Care & Social Assistance | 2 (14.3%) | 12 (85.7%) |
| Arts, Entertainment & Recreation | 0 (0.0%) | 2 (100.0%) |
| Accommodation & Food Services | 16 (61.5%) | 10 (38.5%) |
| Public Administration | 8 (57.1%) | 6 (42.9%) |
| Total | 75 (60.5%) | 49 (39.5%) |
Education in Elliston
School Enrollment in Elliston
The most common levels of schooling among the 30 students in Elliston are high school (23 | 76.7%), elementary school (4 | 13.3%), and middle school (3 | 10.0%).
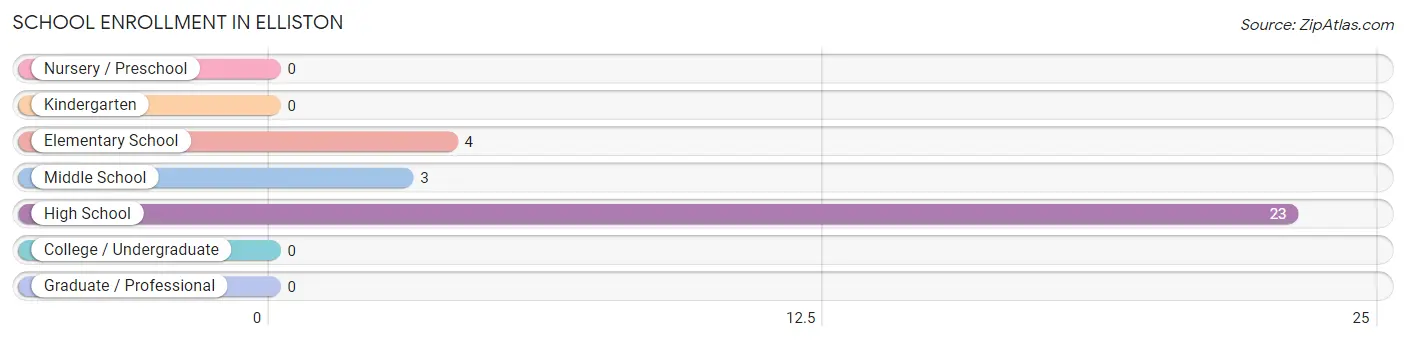
| School Level | # Students | % Students |
| Nursery / Preschool | 0 | 0.0% |
| Kindergarten | 0 | 0.0% |
| Elementary School | 4 | 13.3% |
| Middle School | 3 | 10.0% |
| High School | 23 | 76.7% |
| College / Undergraduate | 0 | 0.0% |
| Graduate / Professional | 0 | 0.0% |
| Total | 30 | 100.0% |
School Enrollment by Age by Funding Source in Elliston
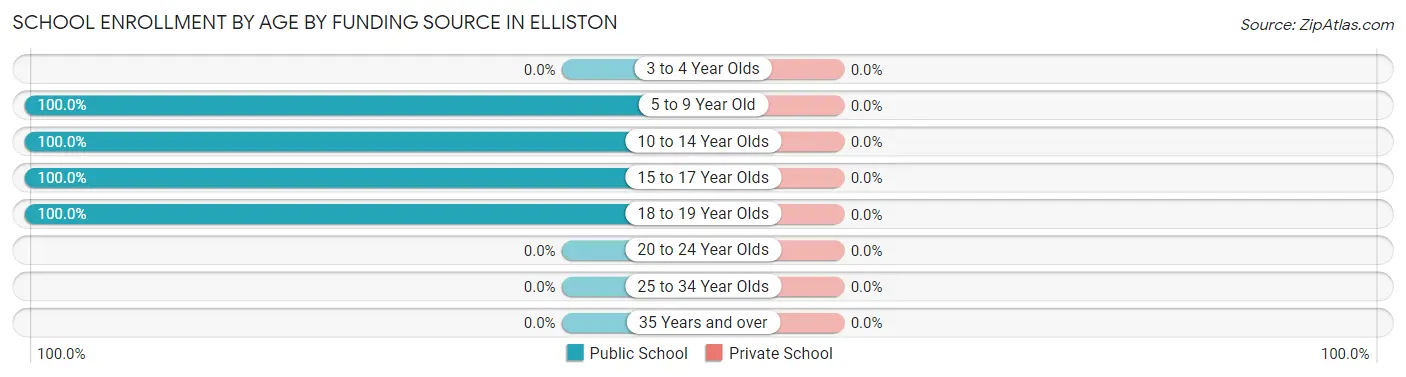
| Age Bracket | Public School | Private School |
| 3 to 4 Year Olds | 0 (0.0%) | 0 (0.0%) |
| 5 to 9 Year Old | 4 (100.0%) | 0 (0.0%) |
| 10 to 14 Year Olds | 3 (100.0%) | 0 (0.0%) |
| 15 to 17 Year Olds | 18 (100.0%) | 0 (0.0%) |
| 18 to 19 Year Olds | 5 (100.0%) | 0 (0.0%) |
| 20 to 24 Year Olds | 0 (0.0%) | 0 (0.0%) |
| 25 to 34 Year Olds | 0 (0.0%) | 0 (0.0%) |
| 35 Years and over | 0 (0.0%) | 0 (0.0%) |
| Total | 30 (100.0%) | 0 (0.0%) |
Educational Attainment by Field of Study in Elliston
Business (16 | 31.4%), science & technology (14 | 27.5%), communications (8 | 15.7%), social sciences (6 | 11.8%), and engineering (4 | 7.8%) are the most common fields of study among 51 individuals in Elliston who have obtained a bachelor's degree or higher.
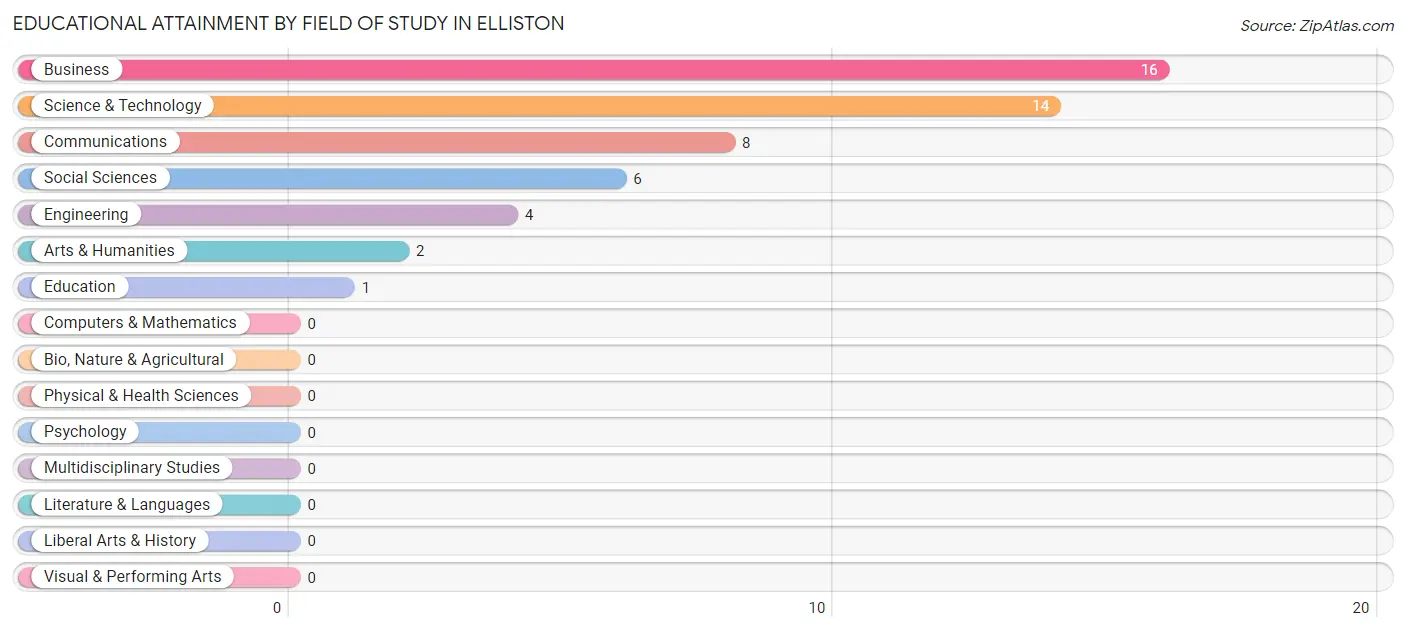
| Field of Study | # Graduates | % Graduates |
| Computers & Mathematics | 0 | 0.0% |
| Bio, Nature & Agricultural | 0 | 0.0% |
| Physical & Health Sciences | 0 | 0.0% |
| Psychology | 0 | 0.0% |
| Social Sciences | 6 | 11.8% |
| Engineering | 4 | 7.8% |
| Multidisciplinary Studies | 0 | 0.0% |
| Science & Technology | 14 | 27.5% |
| Business | 16 | 31.4% |
| Education | 1 | 2.0% |
| Literature & Languages | 0 | 0.0% |
| Liberal Arts & History | 0 | 0.0% |
| Visual & Performing Arts | 0 | 0.0% |
| Communications | 8 | 15.7% |
| Arts & Humanities | 2 | 3.9% |
| Total | 51 | 100.0% |
Transportation & Commute in Elliston
Vehicle Availability by Sex in Elliston
The most prevalent vehicle ownership categories in Elliston are males with 2 vehicles (37, accounting for 48.7%) and females with 2 vehicles (9, making up 78.7%).
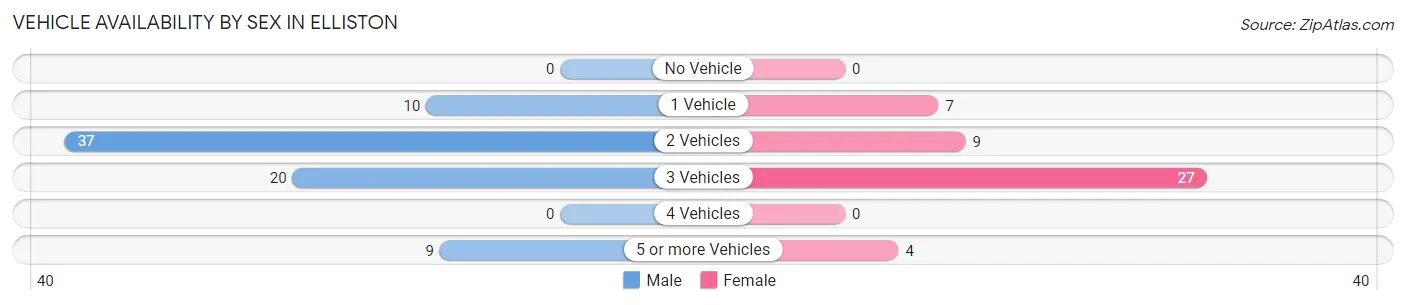
| Vehicles Available | Male | Female |
| No Vehicle | 0 (0.0%) | 0 (0.0%) |
| 1 Vehicle | 10 (13.2%) | 7 (14.9%) |
| 2 Vehicles | 37 (48.7%) | 9 (19.2%) |
| 3 Vehicles | 20 (26.3%) | 27 (57.5%) |
| 4 Vehicles | 0 (0.0%) | 0 (0.0%) |
| 5 or more Vehicles | 9 (11.8%) | 4 (8.5%) |
| Total | 76 (100.0%) | 47 (100.0%) |
Commute Time in Elliston
The most frequently occuring commute durations in Elliston are 30 to 34 minutes (33 commuters, 28.2%), 35 to 39 minutes (18 commuters, 15.4%), and 10 to 14 minutes (13 commuters, 11.1%).
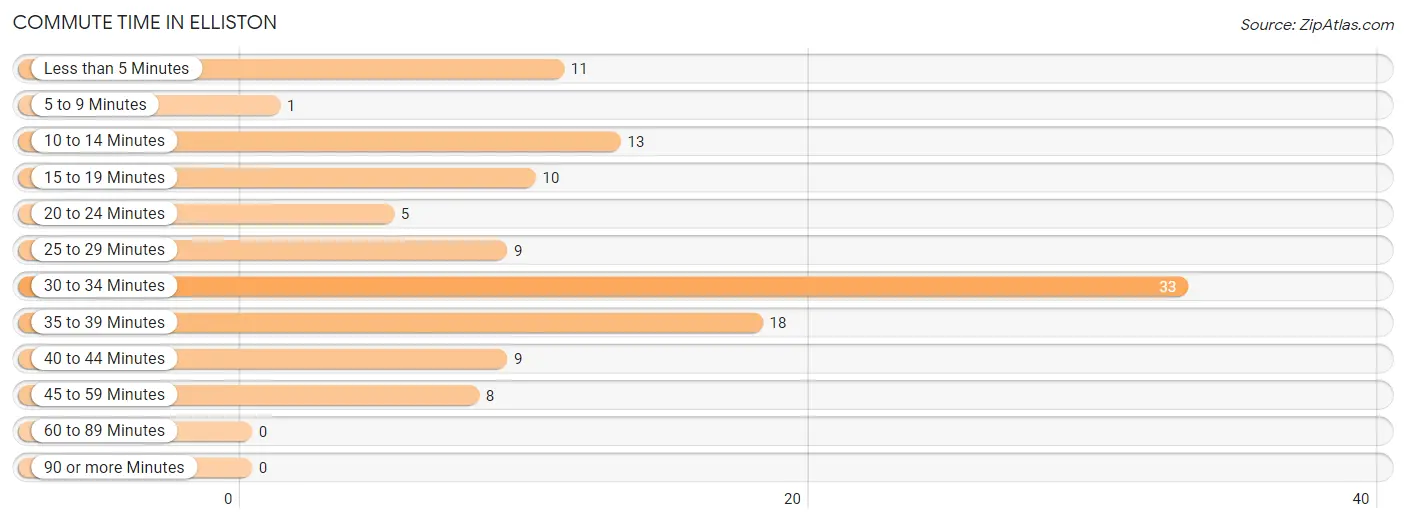
| Commute Time | # Commuters | % Commuters |
| Less than 5 Minutes | 11 | 9.4% |
| 5 to 9 Minutes | 1 | 0.9% |
| 10 to 14 Minutes | 13 | 11.1% |
| 15 to 19 Minutes | 10 | 8.6% |
| 20 to 24 Minutes | 5 | 4.3% |
| 25 to 29 Minutes | 9 | 7.7% |
| 30 to 34 Minutes | 33 | 28.2% |
| 35 to 39 Minutes | 18 | 15.4% |
| 40 to 44 Minutes | 9 | 7.7% |
| 45 to 59 Minutes | 8 | 6.8% |
| 60 to 89 Minutes | 0 | 0.0% |
| 90 or more Minutes | 0 | 0.0% |
Commute Time by Sex in Elliston
The most common commute times in Elliston are 30 to 34 minutes (22 commuters, 30.6%) for males and 30 to 34 minutes (11 commuters, 24.4%) for females.
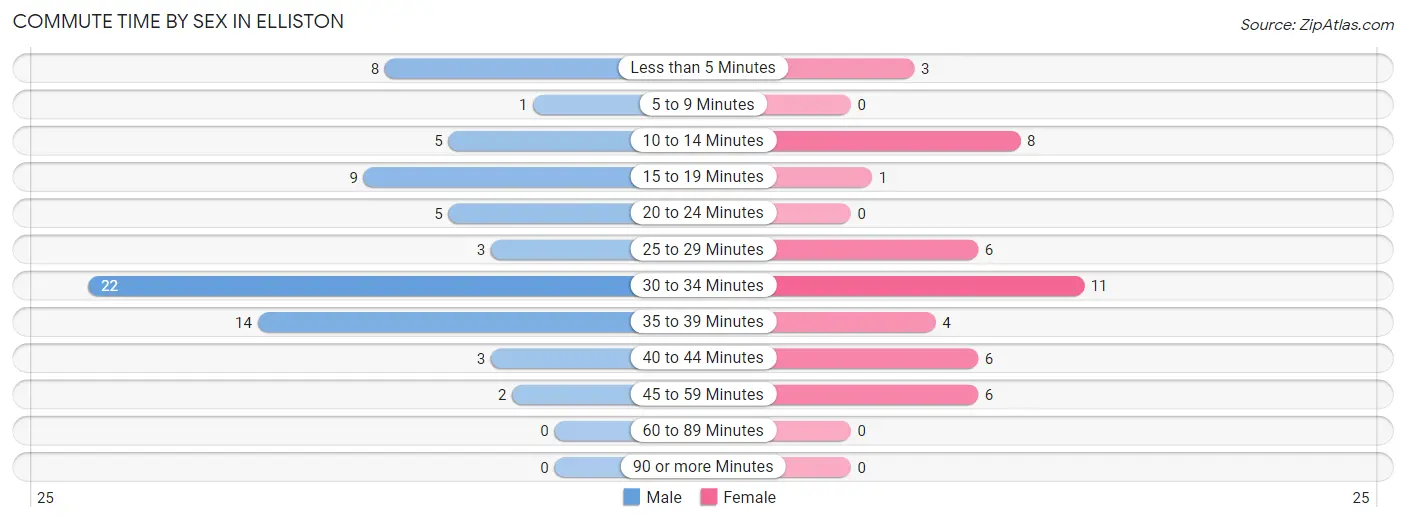
| Commute Time | Male | Female |
| Less than 5 Minutes | 8 (11.1%) | 3 (6.7%) |
| 5 to 9 Minutes | 1 (1.4%) | 0 (0.0%) |
| 10 to 14 Minutes | 5 (6.9%) | 8 (17.8%) |
| 15 to 19 Minutes | 9 (12.5%) | 1 (2.2%) |
| 20 to 24 Minutes | 5 (6.9%) | 0 (0.0%) |
| 25 to 29 Minutes | 3 (4.2%) | 6 (13.3%) |
| 30 to 34 Minutes | 22 (30.6%) | 11 (24.4%) |
| 35 to 39 Minutes | 14 (19.4%) | 4 (8.9%) |
| 40 to 44 Minutes | 3 (4.2%) | 6 (13.3%) |
| 45 to 59 Minutes | 2 (2.8%) | 6 (13.3%) |
| 60 to 89 Minutes | 0 (0.0%) | 0 (0.0%) |
| 90 or more Minutes | 0 (0.0%) | 0 (0.0%) |
Time of Departure to Work by Sex in Elliston
The most frequent times of departure to work in Elliston are 6:30 AM to 6:59 AM (25, 34.7%) for males and 7:00 AM to 7:29 AM (11, 24.4%) for females.
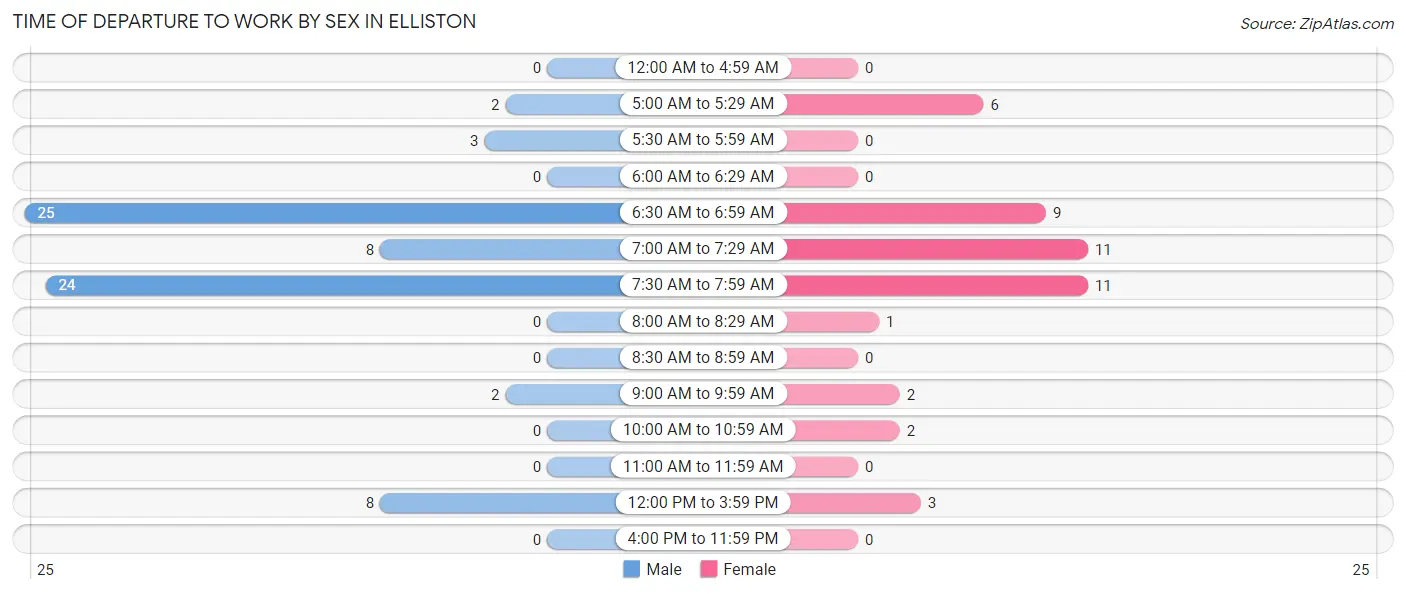
| Time of Departure | Male | Female |
| 12:00 AM to 4:59 AM | 0 (0.0%) | 0 (0.0%) |
| 5:00 AM to 5:29 AM | 2 (2.8%) | 6 (13.3%) |
| 5:30 AM to 5:59 AM | 3 (4.2%) | 0 (0.0%) |
| 6:00 AM to 6:29 AM | 0 (0.0%) | 0 (0.0%) |
| 6:30 AM to 6:59 AM | 25 (34.7%) | 9 (20.0%) |
| 7:00 AM to 7:29 AM | 8 (11.1%) | 11 (24.4%) |
| 7:30 AM to 7:59 AM | 24 (33.3%) | 11 (24.4%) |
| 8:00 AM to 8:29 AM | 0 (0.0%) | 1 (2.2%) |
| 8:30 AM to 8:59 AM | 0 (0.0%) | 0 (0.0%) |
| 9:00 AM to 9:59 AM | 2 (2.8%) | 2 (4.4%) |
| 10:00 AM to 10:59 AM | 0 (0.0%) | 2 (4.4%) |
| 11:00 AM to 11:59 AM | 0 (0.0%) | 0 (0.0%) |
| 12:00 PM to 3:59 PM | 8 (11.1%) | 3 (6.7%) |
| 4:00 PM to 11:59 PM | 0 (0.0%) | 0 (0.0%) |
| Total | 72 (100.0%) | 45 (100.0%) |
Housing Occupancy in Elliston
Occupancy by Ownership in Elliston
Of the total 102 dwellings in Elliston, owner-occupied units account for 67 (65.7%), while renter-occupied units make up 35 (34.3%).
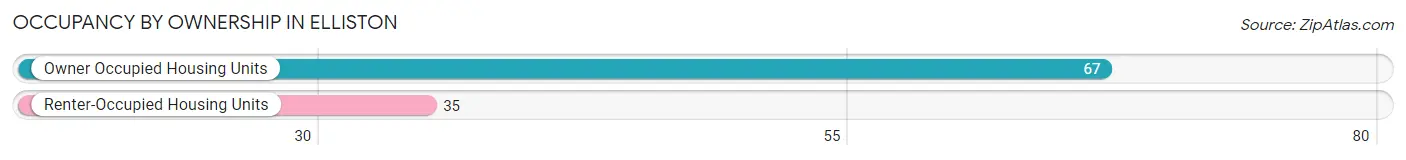
| Occupancy | # Housing Units | % Housing Units |
| Owner Occupied Housing Units | 67 | 65.7% |
| Renter-Occupied Housing Units | 35 | 34.3% |
| Total Occupied Housing Units | 102 | 100.0% |
Occupancy by Household Size in Elliston
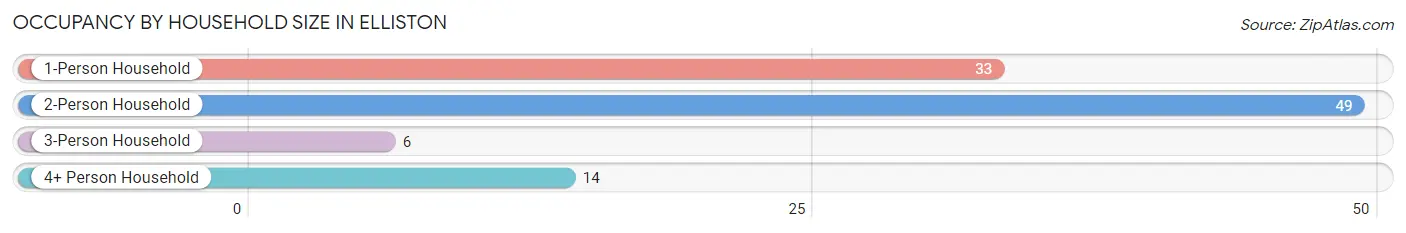
| Household Size | # Housing Units | % Housing Units |
| 1-Person Household | 33 | 32.4% |
| 2-Person Household | 49 | 48.0% |
| 3-Person Household | 6 | 5.9% |
| 4+ Person Household | 14 | 13.7% |
| Total Housing Units | 102 | 100.0% |
Occupancy by Ownership by Household Size in Elliston
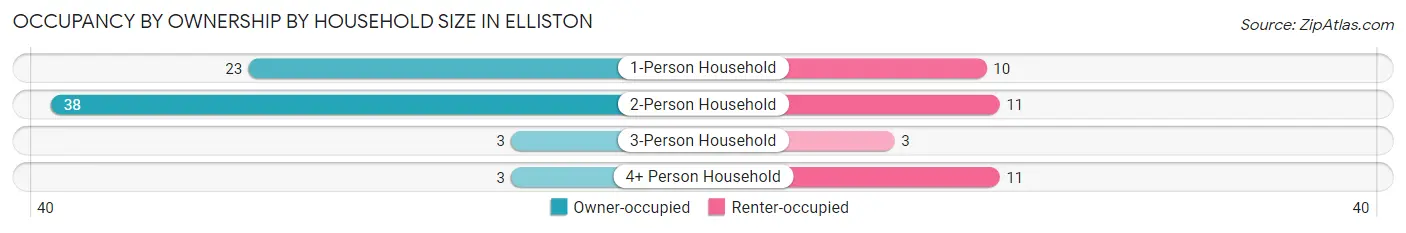
| Household Size | Owner-occupied | Renter-occupied |
| 1-Person Household | 23 (69.7%) | 10 (30.3%) |
| 2-Person Household | 38 (77.5%) | 11 (22.5%) |
| 3-Person Household | 3 (50.0%) | 3 (50.0%) |
| 4+ Person Household | 3 (21.4%) | 11 (78.6%) |
| Total Housing Units | 67 (65.7%) | 35 (34.3%) |
Occupancy by Educational Attainment in Elliston
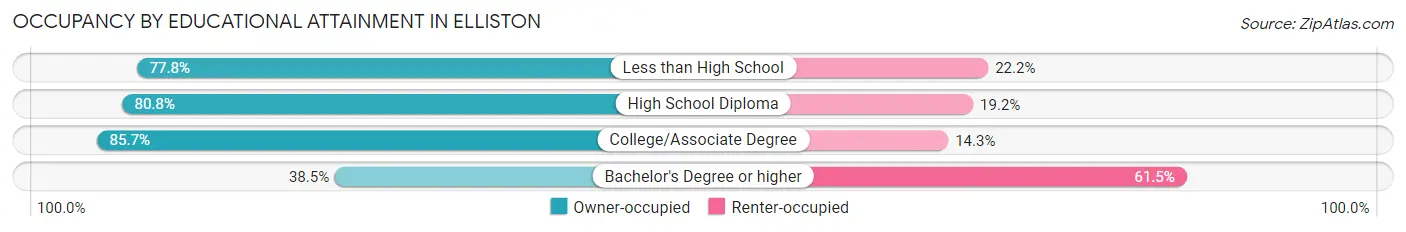
| Household Size | Owner-occupied | Renter-occupied |
| Less than High School | 7 (77.8%) | 2 (22.2%) |
| High School Diploma | 21 (80.8%) | 5 (19.2%) |
| College/Associate Degree | 24 (85.7%) | 4 (14.3%) |
| Bachelor's Degree or higher | 15 (38.5%) | 24 (61.5%) |
Occupancy by Age of Householder in Elliston
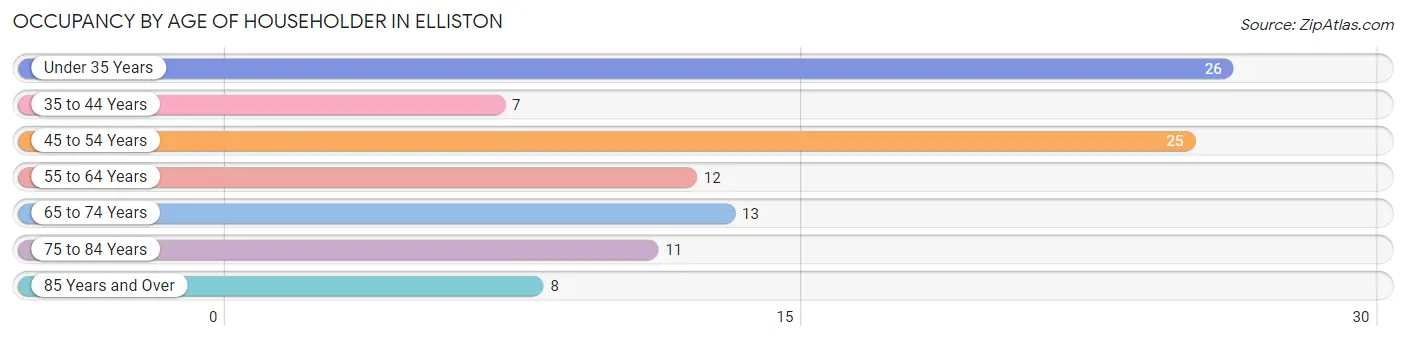
| Age Bracket | # Households | % Households |
| Under 35 Years | 26 | 25.5% |
| 35 to 44 Years | 7 | 6.9% |
| 45 to 54 Years | 25 | 24.5% |
| 55 to 64 Years | 12 | 11.8% |
| 65 to 74 Years | 13 | 12.8% |
| 75 to 84 Years | 11 | 10.8% |
| 85 Years and Over | 8 | 7.8% |
| Total | 102 | 100.0% |
Housing Finances in Elliston
Median Income by Occupancy in Elliston
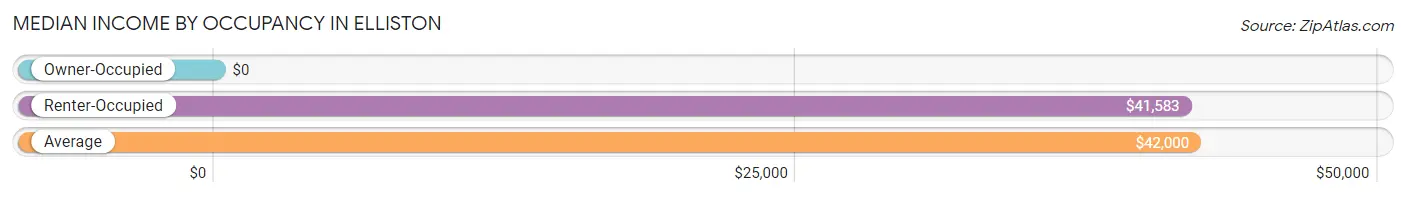
| Occupancy Type | # Households | Median Income |
| Owner-Occupied | 67 (65.7%) | $0 |
| Renter-Occupied | 35 (34.3%) | $41,583 |
| Average | 102 (100.0%) | $42,000 |
Occupancy by Householder Income Bracket in Elliston
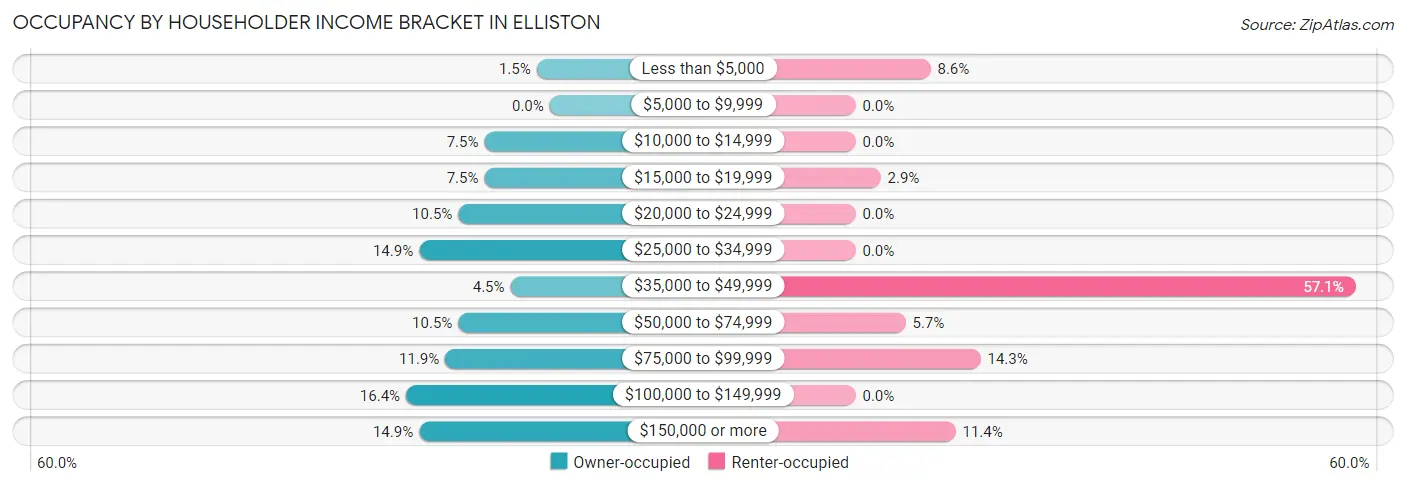
| Income Bracket | Owner-occupied | Renter-occupied |
| Less than $5,000 | 1 (1.5%) | 3 (8.6%) |
| $5,000 to $9,999 | 0 (0.0%) | 0 (0.0%) |
| $10,000 to $14,999 | 5 (7.5%) | 0 (0.0%) |
| $15,000 to $19,999 | 5 (7.5%) | 1 (2.9%) |
| $20,000 to $24,999 | 7 (10.4%) | 0 (0.0%) |
| $25,000 to $34,999 | 10 (14.9%) | 0 (0.0%) |
| $35,000 to $49,999 | 3 (4.5%) | 20 (57.1%) |
| $50,000 to $74,999 | 7 (10.4%) | 2 (5.7%) |
| $75,000 to $99,999 | 8 (11.9%) | 5 (14.3%) |
| $100,000 to $149,999 | 11 (16.4%) | 0 (0.0%) |
| $150,000 or more | 10 (14.9%) | 4 (11.4%) |
| Total | 67 (100.0%) | 35 (100.0%) |
Monthly Housing Cost Tiers in Elliston
| Monthly Cost | Owner-occupied | Renter-occupied |
| Less than $300 | 14 (20.9%) | 0 (0.0%) |
| $300 to $499 | 4 (6.0%) | 0 (0.0%) |
| $500 to $799 | 11 (16.4%) | 17 (48.6%) |
| $800 to $999 | 2 (3.0%) | 8 (22.9%) |
| $1,000 to $1,499 | 18 (26.9%) | 1 (2.9%) |
| $1,500 to $1,999 | 17 (25.4%) | 9 (25.7%) |
| $2,000 to $2,499 | 1 (1.5%) | 0 (0.0%) |
| $2,500 to $2,999 | 0 (0.0%) | 0 (0.0%) |
| $3,000 or more | 0 (0.0%) | 0 (0.0%) |
| Total | 67 (100.0%) | 35 (100.0%) |
Physical Housing Characteristics in Elliston
Housing Structures in Elliston
| Structure Type | # Housing Units | % Housing Units |
| Single Unit, Detached | 91 | 89.2% |
| Single Unit, Attached | 0 | 0.0% |
| 2 Unit Apartments | 0 | 0.0% |
| 3 or 4 Unit Apartments | 0 | 0.0% |
| 5 to 9 Unit Apartments | 0 | 0.0% |
| 10 or more Apartments | 0 | 0.0% |
| Mobile Home / Other | 11 | 10.8% |
| Total | 102 | 100.0% |
Housing Structures by Occupancy in Elliston
| Structure Type | Owner-occupied | Renter-occupied |
| Single Unit, Detached | 64 (70.3%) | 27 (29.7%) |
| Single Unit, Attached | 0 (0.0%) | 0 (0.0%) |
| 2 Unit Apartments | 0 (0.0%) | 0 (0.0%) |
| 3 or 4 Unit Apartments | 0 (0.0%) | 0 (0.0%) |
| 5 to 9 Unit Apartments | 0 (0.0%) | 0 (0.0%) |
| 10 or more Apartments | 0 (0.0%) | 0 (0.0%) |
| Mobile Home / Other | 3 (27.3%) | 8 (72.7%) |
| Total | 67 (65.7%) | 35 (34.3%) |
Housing Structures by Number of Rooms in Elliston
| Number of Rooms | Owner-occupied | Renter-occupied |
| 1 Room | 0 (0.0%) | 0 (0.0%) |
| 2 or 3 Rooms | 6 (9.0%) | 0 (0.0%) |
| 4 or 5 Rooms | 22 (32.8%) | 20 (57.1%) |
| 6 or 7 Rooms | 33 (49.2%) | 6 (17.1%) |
| 8 or more Rooms | 6 (9.0%) | 9 (25.7%) |
| Total | 67 (100.0%) | 35 (100.0%) |
Housing Structure by Heating Type in Elliston
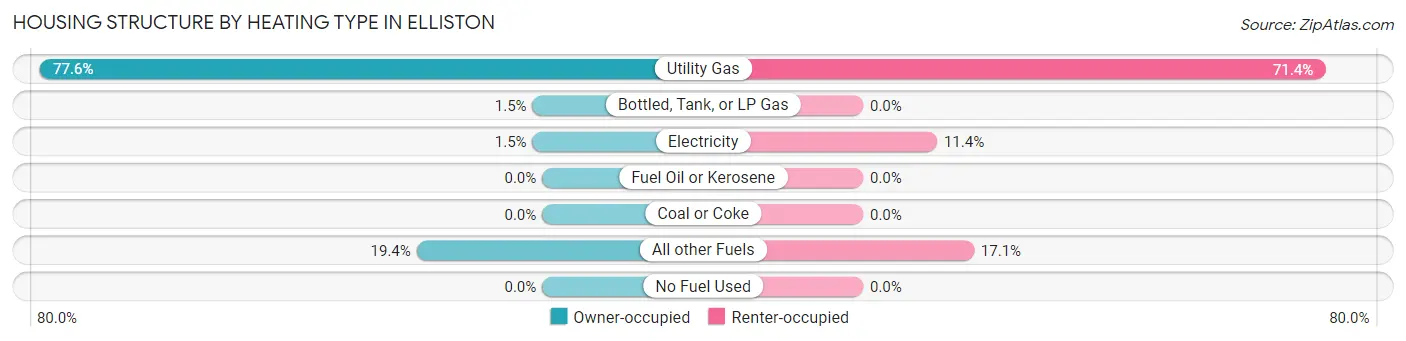
| Heating Type | Owner-occupied | Renter-occupied |
| Utility Gas | 52 (77.6%) | 25 (71.4%) |
| Bottled, Tank, or LP Gas | 1 (1.5%) | 0 (0.0%) |
| Electricity | 1 (1.5%) | 4 (11.4%) |
| Fuel Oil or Kerosene | 0 (0.0%) | 0 (0.0%) |
| Coal or Coke | 0 (0.0%) | 0 (0.0%) |
| All other Fuels | 13 (19.4%) | 6 (17.1%) |
| No Fuel Used | 0 (0.0%) | 0 (0.0%) |
| Total | 67 (100.0%) | 35 (100.0%) |
Household Vehicle Usage in Elliston
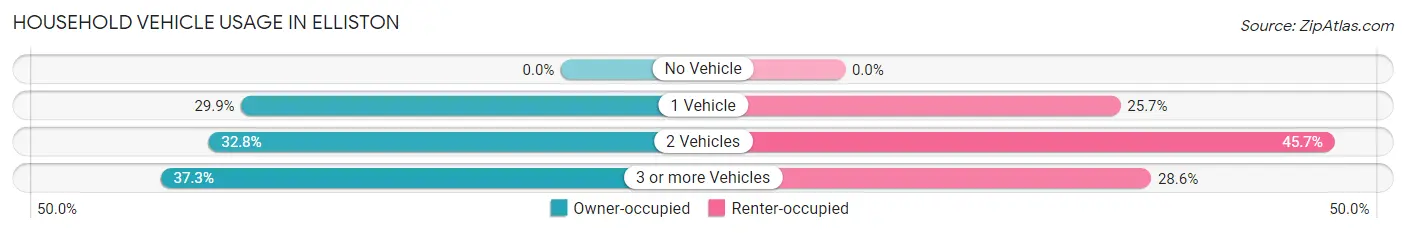
| Vehicles per Household | Owner-occupied | Renter-occupied |
| No Vehicle | 0 (0.0%) | 0 (0.0%) |
| 1 Vehicle | 20 (29.8%) | 9 (25.7%) |
| 2 Vehicles | 22 (32.8%) | 16 (45.7%) |
| 3 or more Vehicles | 25 (37.3%) | 10 (28.6%) |
| Total | 67 (100.0%) | 35 (100.0%) |
Real Estate & Mortgages in Elliston
Real Estate and Mortgage Overview in Elliston
| Characteristic | Without Mortgage | With Mortgage |
| Housing Units | 25 | 42 |
| Median Property Value | - | - |
| Median Household Income | $23,750 | $10 |
| Monthly Housing Costs | $238 | $0 |
| Real Estate Taxes | $780 | $0 |
Property Value by Mortgage Status in Elliston
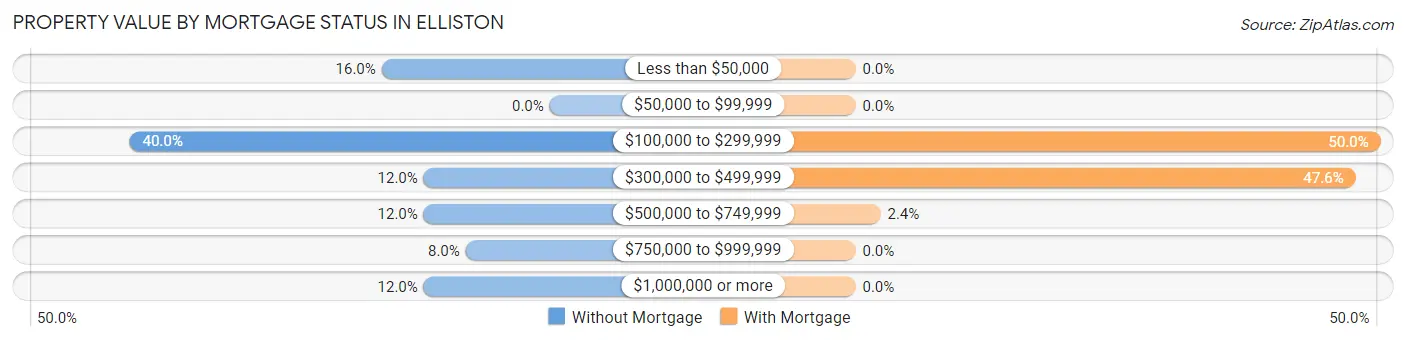
| Property Value | Without Mortgage | With Mortgage |
| Less than $50,000 | 4 (16.0%) | 0 (0.0%) |
| $50,000 to $99,999 | 0 (0.0%) | 0 (0.0%) |
| $100,000 to $299,999 | 10 (40.0%) | 21 (50.0%) |
| $300,000 to $499,999 | 3 (12.0%) | 20 (47.6%) |
| $500,000 to $749,999 | 3 (12.0%) | 1 (2.4%) |
| $750,000 to $999,999 | 2 (8.0%) | 0 (0.0%) |
| $1,000,000 or more | 3 (12.0%) | 0 (0.0%) |
| Total | 25 (100.0%) | 42 (100.0%) |
Household Income by Mortgage Status in Elliston
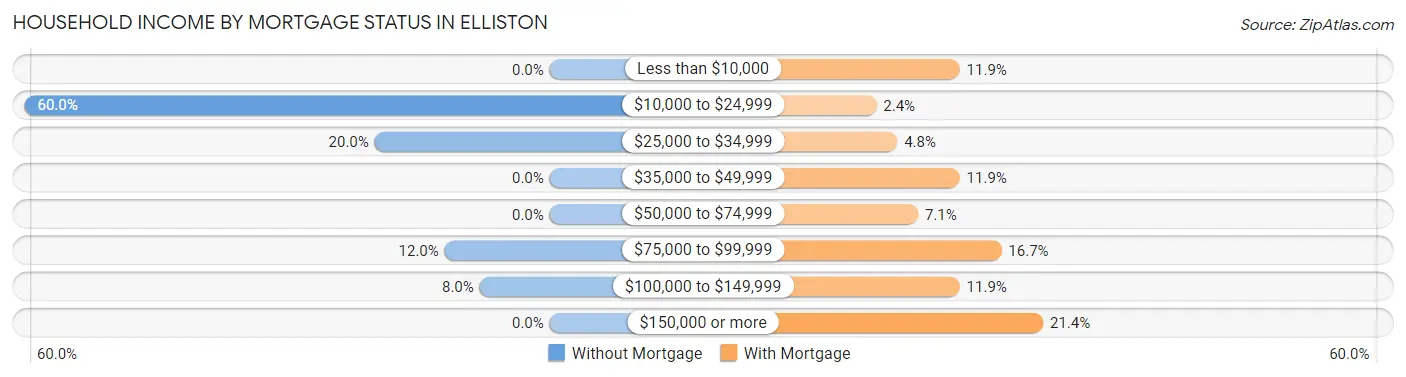
| Household Income | Without Mortgage | With Mortgage |
| Less than $10,000 | 0 (0.0%) | 5 (11.9%) |
| $10,000 to $24,999 | 15 (60.0%) | 1 (2.4%) |
| $25,000 to $34,999 | 5 (20.0%) | 2 (4.8%) |
| $35,000 to $49,999 | 0 (0.0%) | 5 (11.9%) |
| $50,000 to $74,999 | 0 (0.0%) | 3 (7.1%) |
| $75,000 to $99,999 | 3 (12.0%) | 7 (16.7%) |
| $100,000 to $149,999 | 2 (8.0%) | 5 (11.9%) |
| $150,000 or more | 0 (0.0%) | 9 (21.4%) |
| Total | 25 (100.0%) | 42 (100.0%) |
Property Value to Household Income Ratio in Elliston
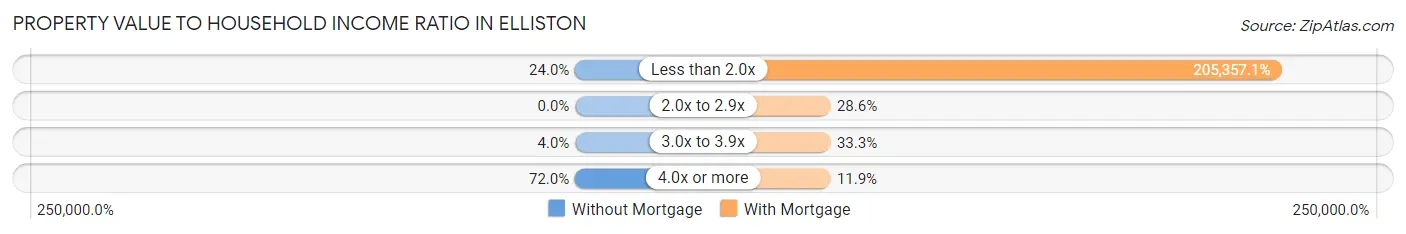
| Value-to-Income Ratio | Without Mortgage | With Mortgage |
| Less than 2.0x | 6 (24.0%) | 86,250 (205,357.1%) |
| 2.0x to 2.9x | 0 (0.0%) | 12 (28.6%) |
| 3.0x to 3.9x | 1 (4.0%) | 14 (33.3%) |
| 4.0x or more | 18 (72.0%) | 5 (11.9%) |
| Total | 25 (100.0%) | 42 (100.0%) |
Real Estate Taxes by Mortgage Status in Elliston
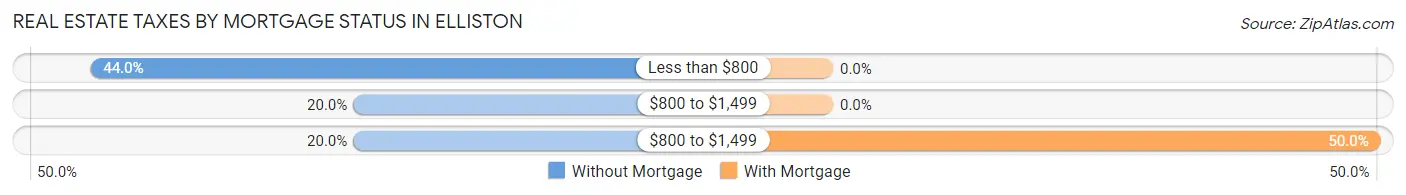
| Property Taxes | Without Mortgage | With Mortgage |
| Less than $800 | 11 (44.0%) | 0 (0.0%) |
| $800 to $1,499 | 5 (20.0%) | 0 (0.0%) |
| $800 to $1,499 | 5 (20.0%) | 21 (50.0%) |
| Total | 25 (100.0%) | 42 (100.0%) |
Health & Disability in Elliston
Health Insurance Coverage by Age in Elliston
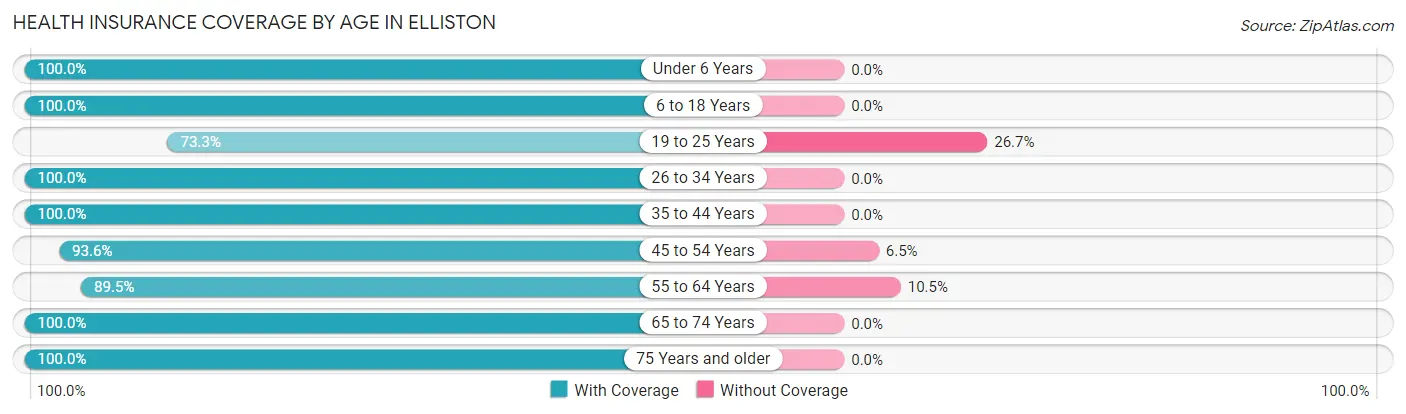
| Age Bracket | With Coverage | Without Coverage |
| Under 6 Years | 23 (100.0%) | 0 (0.0%) |
| 6 to 18 Years | 30 (100.0%) | 0 (0.0%) |
| 19 to 25 Years | 22 (73.3%) | 8 (26.7%) |
| 26 to 34 Years | 26 (100.0%) | 0 (0.0%) |
| 35 to 44 Years | 17 (100.0%) | 0 (0.0%) |
| 45 to 54 Years | 29 (93.5%) | 2 (6.5%) |
| 55 to 64 Years | 17 (89.5%) | 2 (10.5%) |
| 65 to 74 Years | 25 (100.0%) | 0 (0.0%) |
| 75 Years and older | 21 (100.0%) | 0 (0.0%) |
| Total | 210 (94.6%) | 12 (5.4%) |
Health Insurance Coverage by Citizenship Status in Elliston
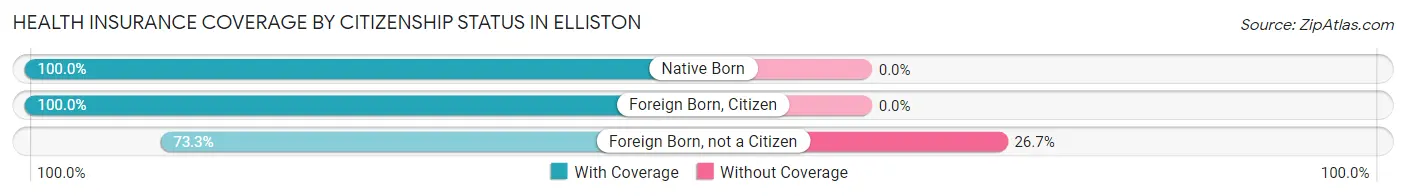
| Citizenship Status | With Coverage | Without Coverage |
| Native Born | 23 (100.0%) | 0 (0.0%) |
| Foreign Born, Citizen | 30 (100.0%) | 0 (0.0%) |
| Foreign Born, not a Citizen | 22 (73.3%) | 8 (26.7%) |
Health Insurance Coverage by Household Income in Elliston
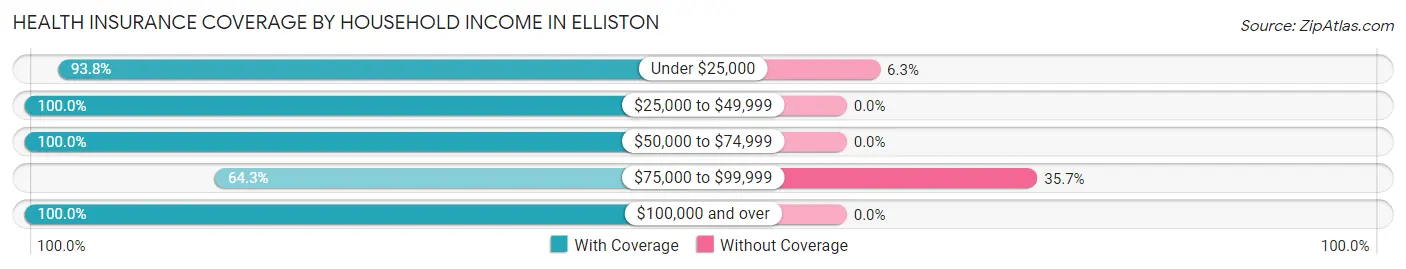
| Household Income | With Coverage | Without Coverage |
| Under $25,000 | 30 (93.8%) | 2 (6.2%) |
| $25,000 to $49,999 | 64 (100.0%) | 0 (0.0%) |
| $50,000 to $74,999 | 22 (100.0%) | 0 (0.0%) |
| $75,000 to $99,999 | 18 (64.3%) | 10 (35.7%) |
| $100,000 and over | 76 (100.0%) | 0 (0.0%) |
Public vs Private Health Insurance Coverage by Age in Elliston
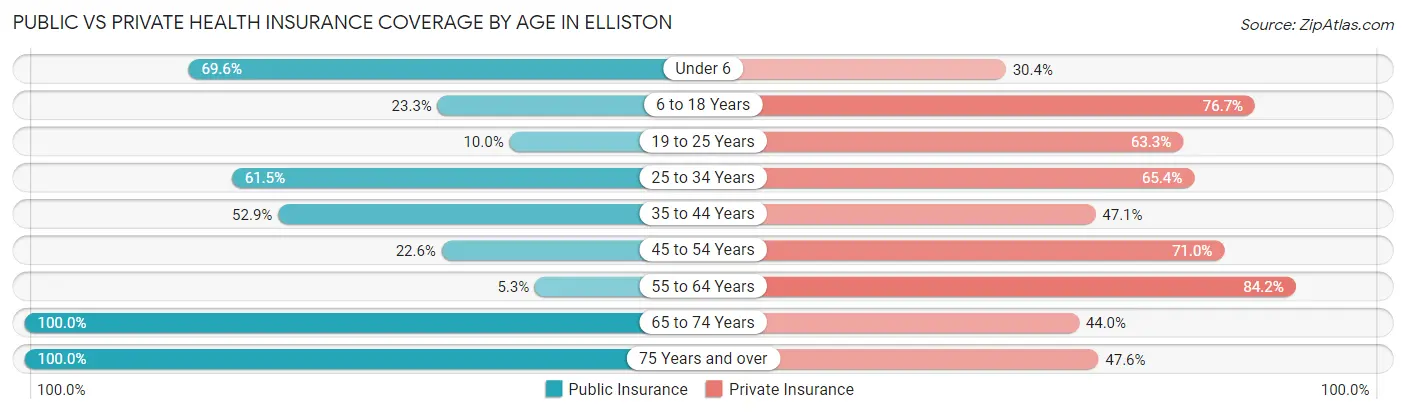
| Age Bracket | Public Insurance | Private Insurance |
| Under 6 | 16 (69.6%) | 7 (30.4%) |
| 6 to 18 Years | 7 (23.3%) | 23 (76.7%) |
| 19 to 25 Years | 3 (10.0%) | 19 (63.3%) |
| 25 to 34 Years | 16 (61.5%) | 17 (65.4%) |
| 35 to 44 Years | 9 (52.9%) | 8 (47.1%) |
| 45 to 54 Years | 7 (22.6%) | 22 (71.0%) |
| 55 to 64 Years | 1 (5.3%) | 16 (84.2%) |
| 65 to 74 Years | 25 (100.0%) | 11 (44.0%) |
| 75 Years and over | 21 (100.0%) | 10 (47.6%) |
| Total | 105 (47.3%) | 133 (59.9%) |
Disability Status by Sex by Age in Elliston
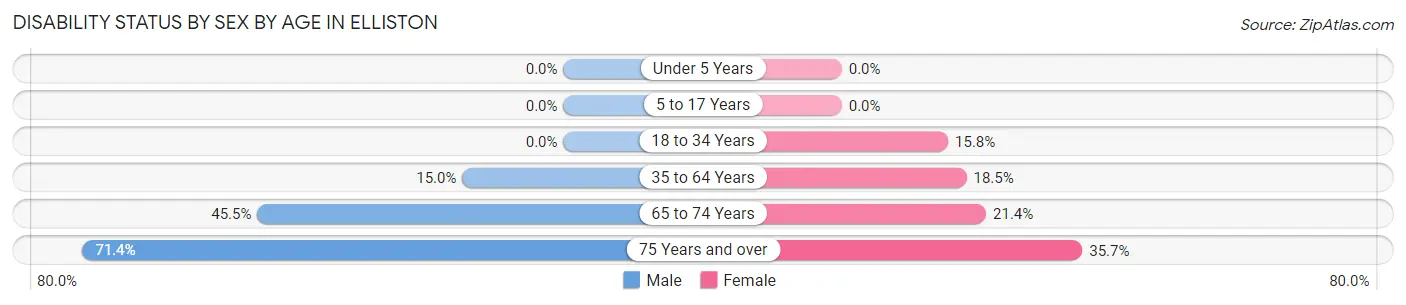
| Age Bracket | Male | Female |
| Under 5 Years | 0 (0.0%) | 0 (0.0%) |
| 5 to 17 Years | 0 (0.0%) | 0 (0.0%) |
| 18 to 34 Years | 0 (0.0%) | 3 (15.8%) |
| 35 to 64 Years | 6 (15.0%) | 5 (18.5%) |
| 65 to 74 Years | 5 (45.5%) | 3 (21.4%) |
| 75 Years and over | 5 (71.4%) | 5 (35.7%) |
Disability Class by Sex by Age in Elliston
Disability Class: Hearing Difficulty
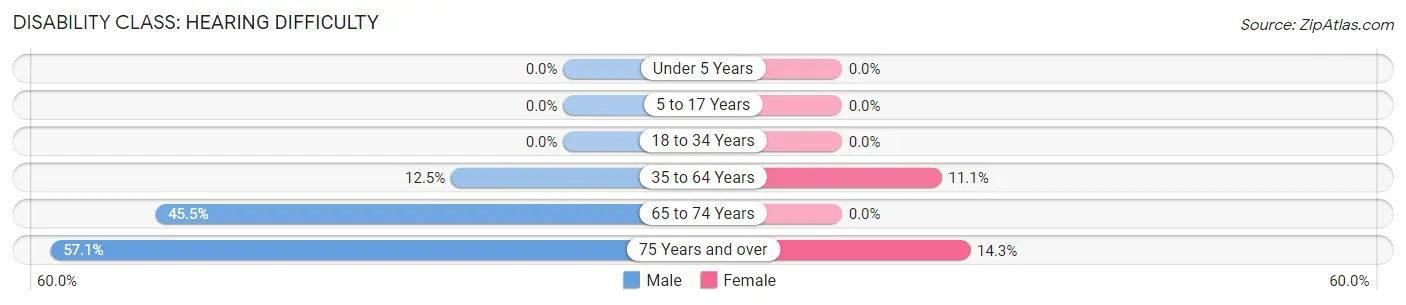
| Age Bracket | Male | Female |
| Under 5 Years | 0 (0.0%) | 0 (0.0%) |
| 5 to 17 Years | 0 (0.0%) | 0 (0.0%) |
| 18 to 34 Years | 0 (0.0%) | 0 (0.0%) |
| 35 to 64 Years | 5 (12.5%) | 3 (11.1%) |
| 65 to 74 Years | 5 (45.5%) | 0 (0.0%) |
| 75 Years and over | 4 (57.1%) | 2 (14.3%) |
Disability Class: Vision Difficulty
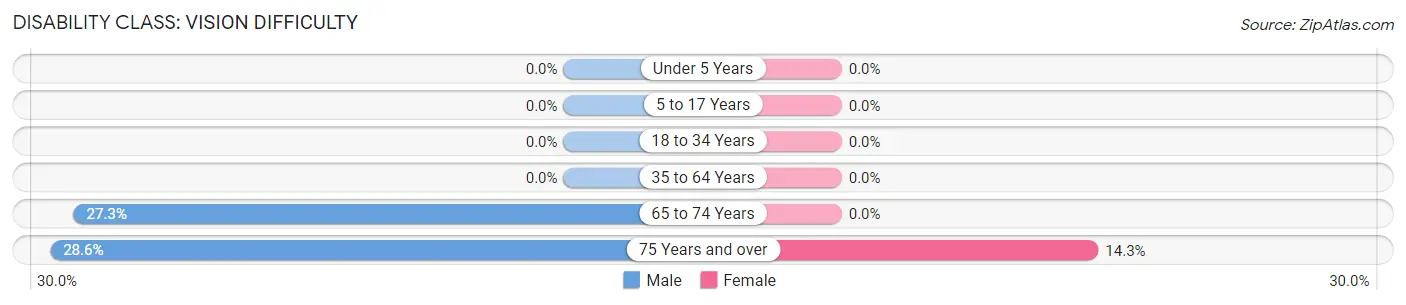
| Age Bracket | Male | Female |
| Under 5 Years | 0 (0.0%) | 0 (0.0%) |
| 5 to 17 Years | 0 (0.0%) | 0 (0.0%) |
| 18 to 34 Years | 0 (0.0%) | 0 (0.0%) |
| 35 to 64 Years | 0 (0.0%) | 0 (0.0%) |
| 65 to 74 Years | 3 (27.3%) | 0 (0.0%) |
| 75 Years and over | 2 (28.6%) | 2 (14.3%) |
Disability Class: Cognitive Difficulty
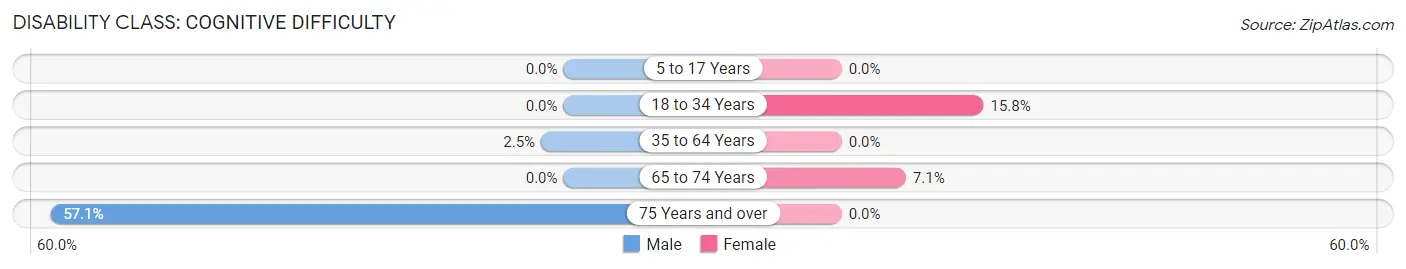
| Age Bracket | Male | Female |
| 5 to 17 Years | 0 (0.0%) | 0 (0.0%) |
| 18 to 34 Years | 0 (0.0%) | 3 (15.8%) |
| 35 to 64 Years | 1 (2.5%) | 0 (0.0%) |
| 65 to 74 Years | 0 (0.0%) | 1 (7.1%) |
| 75 Years and over | 4 (57.1%) | 0 (0.0%) |
Disability Class: Ambulatory Difficulty
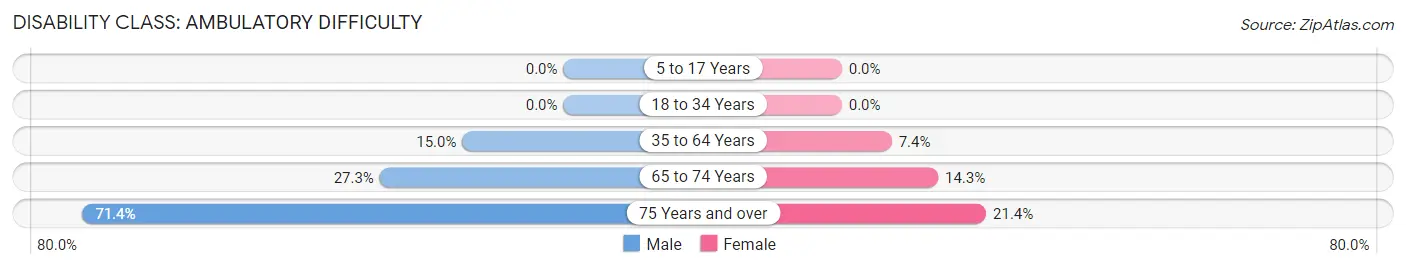
| Age Bracket | Male | Female |
| 5 to 17 Years | 0 (0.0%) | 0 (0.0%) |
| 18 to 34 Years | 0 (0.0%) | 0 (0.0%) |
| 35 to 64 Years | 6 (15.0%) | 2 (7.4%) |
| 65 to 74 Years | 3 (27.3%) | 2 (14.3%) |
| 75 Years and over | 5 (71.4%) | 3 (21.4%) |
Disability Class: Self-Care Difficulty
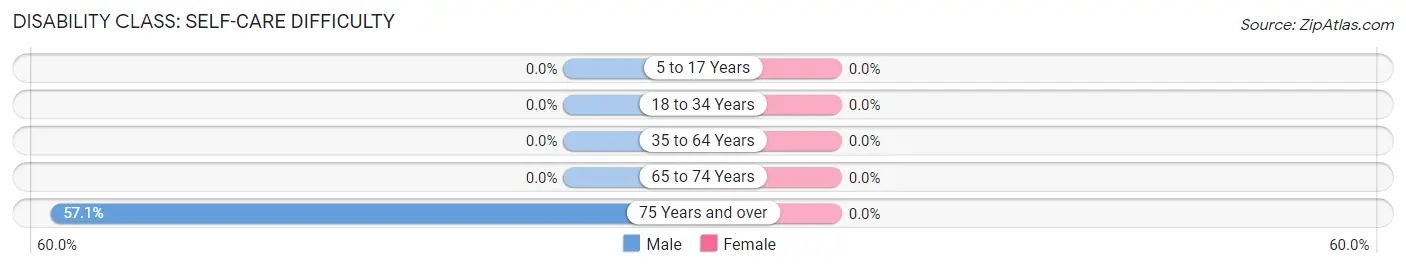
| Age Bracket | Male | Female |
| 5 to 17 Years | 0 (0.0%) | 0 (0.0%) |
| 18 to 34 Years | 0 (0.0%) | 0 (0.0%) |
| 35 to 64 Years | 0 (0.0%) | 0 (0.0%) |
| 65 to 74 Years | 0 (0.0%) | 0 (0.0%) |
| 75 Years and over | 4 (57.1%) | 0 (0.0%) |
Technology Access in Elliston
Computing Device Access in Elliston
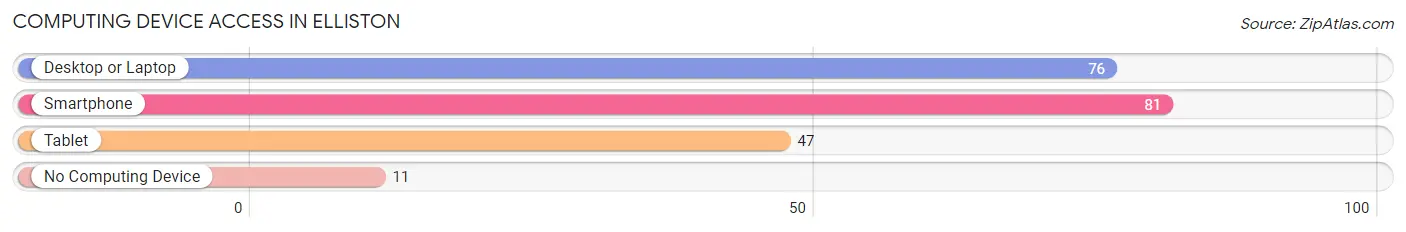
| Device Type | # Households | % Households |
| Desktop or Laptop | 76 | 74.5% |
| Smartphone | 81 | 79.4% |
| Tablet | 47 | 46.1% |
| No Computing Device | 11 | 10.8% |
| Total | 102 | 100.0% |
Internet Access in Elliston
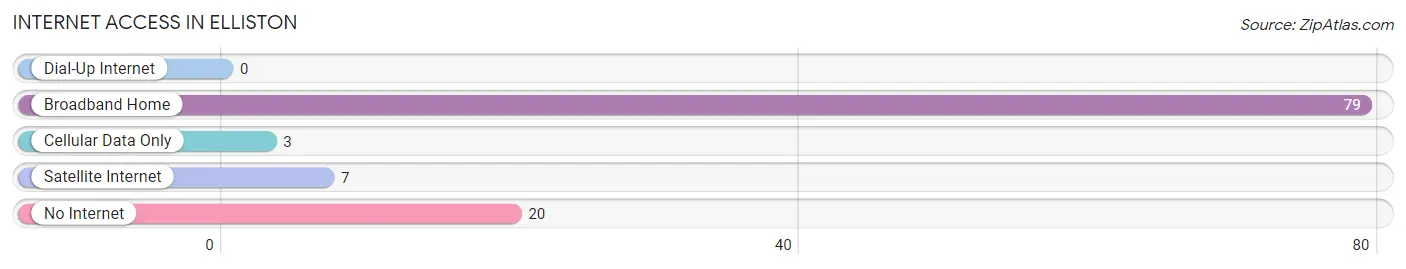
| Internet Type | # Households | % Households |
| Dial-Up Internet | 0 | 0.0% |
| Broadband Home | 79 | 77.4% |
| Cellular Data Only | 3 | 2.9% |
| Satellite Internet | 7 | 6.9% |
| No Internet | 20 | 19.6% |
| Total | 102 | 100.0% |
Elliston Summary
Elliston, Montana is a small town located in the western part of the state, in the foothills of the Rocky Mountains. It is situated in the Madison Valley, about 25 miles south of the city of Bozeman. The town was founded in 1883 by a group of settlers from the Midwest, and was named after the first settler, William Elliston.
The town of Elliston is located at an elevation of 4,890 feet, and has a total area of 0.6 square miles. The climate is semi-arid, with hot summers and cold winters. The average annual temperature is 44.3 degrees Fahrenheit, and the average annual precipitation is 13.3 inches.
The population of Elliston was estimated to be 545 in 2020. The median age of the population is 44.7 years, and the median household income is $45,000. The town is predominantly white, with a small Hispanic population.
The economy of Elliston is largely based on agriculture and tourism. The town is home to several small farms, which produce hay, wheat, barley, and other crops. The town also has a few small businesses, including a grocery store, a hardware store, and a restaurant.
Tourism is an important part of the economy of Elliston. The town is located near several popular outdoor recreation areas, including the Madison River, the Gallatin National Forest, and Yellowstone National Park. The town also hosts several annual events, such as the Elliston Days Festival and the Elliston Rodeo.
The town of Elliston is served by the Madison Valley School District, which includes two elementary schools, a middle school, and a high school. The town also has a public library, a post office, and a volunteer fire department.
Elliston is a small town with a rich history and a vibrant economy. The town is home to a diverse population, and offers a variety of recreational activities and cultural events. The town is a great place to live, work, and play.
Common Questions
What is Per Capita Income in Elliston?
Per Capita income in Elliston is $33,923.
What is the Median Family Income in Elliston?
Median Family Income in Elliston is $69,375.
What is the Median Household income in Elliston?
Median Household Income in Elliston is $42,000.
What is Income or Wage Gap in Elliston?
Income or Wage Gap in Elliston is 42.9%.
Women in Elliston earn 57.1 cents for every dollar earned by a man.
What is Inequality or Gini Index in Elliston?
Inequality or Gini Index in Elliston is 0.48.
What is the Total Population of Elliston?
Total Population of Elliston is 223.
What is the Total Male Population of Elliston?
Total Male Population of Elliston is 120.
What is the Total Female Population of Elliston?
Total Female Population of Elliston is 103.
What is the Ratio of Males per 100 Females in Elliston?
There are 116.50 Males per 100 Females in Elliston.
What is the Ratio of Females per 100 Males in Elliston?
There are 85.83 Females per 100 Males in Elliston.
What is the Median Population Age in Elliston?
Median Population Age in Elliston is 39.1 Years.
What is the Average Family Size in Elliston
Average Family Size in Elliston is 2.8 People.
What is the Average Household Size in Elliston
Average Household Size in Elliston is 2.2 People.
How Large is the Labor Force in Elliston?
There are 133 People in the Labor Forcein in Elliston.
What is the Percentage of People in the Labor Force in Elliston?
72.7% of People are in the Labor Force in Elliston.
What is the Unemployment Rate in Elliston?
Unemployment Rate in Elliston is 6.1%.