Helena, MT Map & Demographics
Helena Map
Helena Overview
$43,016
PER CAPITA INCOME
$90,522
AVG FAMILY INCOME
$64,798
AVG HOUSEHOLD INCOME
23.0%
WAGE / INCOME GAP [ % ]
77.0¢/ $1
WAGE / INCOME GAP [ $ ]
$8,857
FAMILY INCOME DEFICIT
0.46
INEQUALITY / GINI INDEX
32,529
TOTAL POPULATION
15,474
MALE POPULATION
17,055
FEMALE POPULATION
90.73
MALES / 100 FEMALES
110.22
FEMALES / 100 MALES
39.9
MEDIAN AGE
2.8
AVG FAMILY SIZE
2.0
AVG HOUSEHOLD SIZE
17,345
LABOR FORCE [ PEOPLE ]
64.3%
PERCENT IN LABOR FORCE
3.2%
UNEMPLOYMENT RATE
Helena Area Codes
Income in Helena
Income Overview in Helena
Per Capita Income in Helena is $43,016, while median incomes of families and households are $90,522 and $64,798 respectively.
| Characteristic | Number | Measure |
| Per Capita Income | 32,529 | $43,016 |
| Median Family Income | 7,224 | $90,522 |
| Mean Family Income | 7,224 | $117,459 |
| Median Household Income | 15,233 | $64,798 |
| Mean Household Income | 15,233 | $90,089 |
| Income Deficit | 7,224 | $8,857 |
| Wage / Income Gap (%) | 32,529 | 23.00% |
| Wage / Income Gap ($) | 32,529 | 77.00¢ per $1 |
| Gini / Inequality Index | 32,529 | 0.46 |
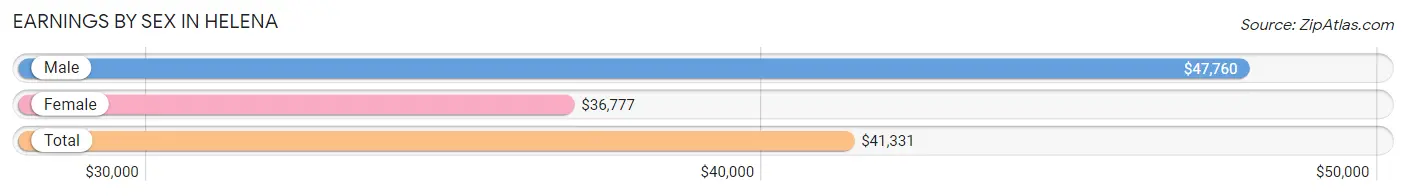
Earnings by Sex in Helena
Average Earnings in Helena are $41,331, $47,760 for men and $36,777 for women, a difference of 23.0%.
| Sex | Number | Average Earnings |
| Male | 9,235 (50.8%) | $47,760 |
| Female | 8,960 (49.2%) | $36,777 |
| Total | 18,195 (100.0%) | $41,331 |
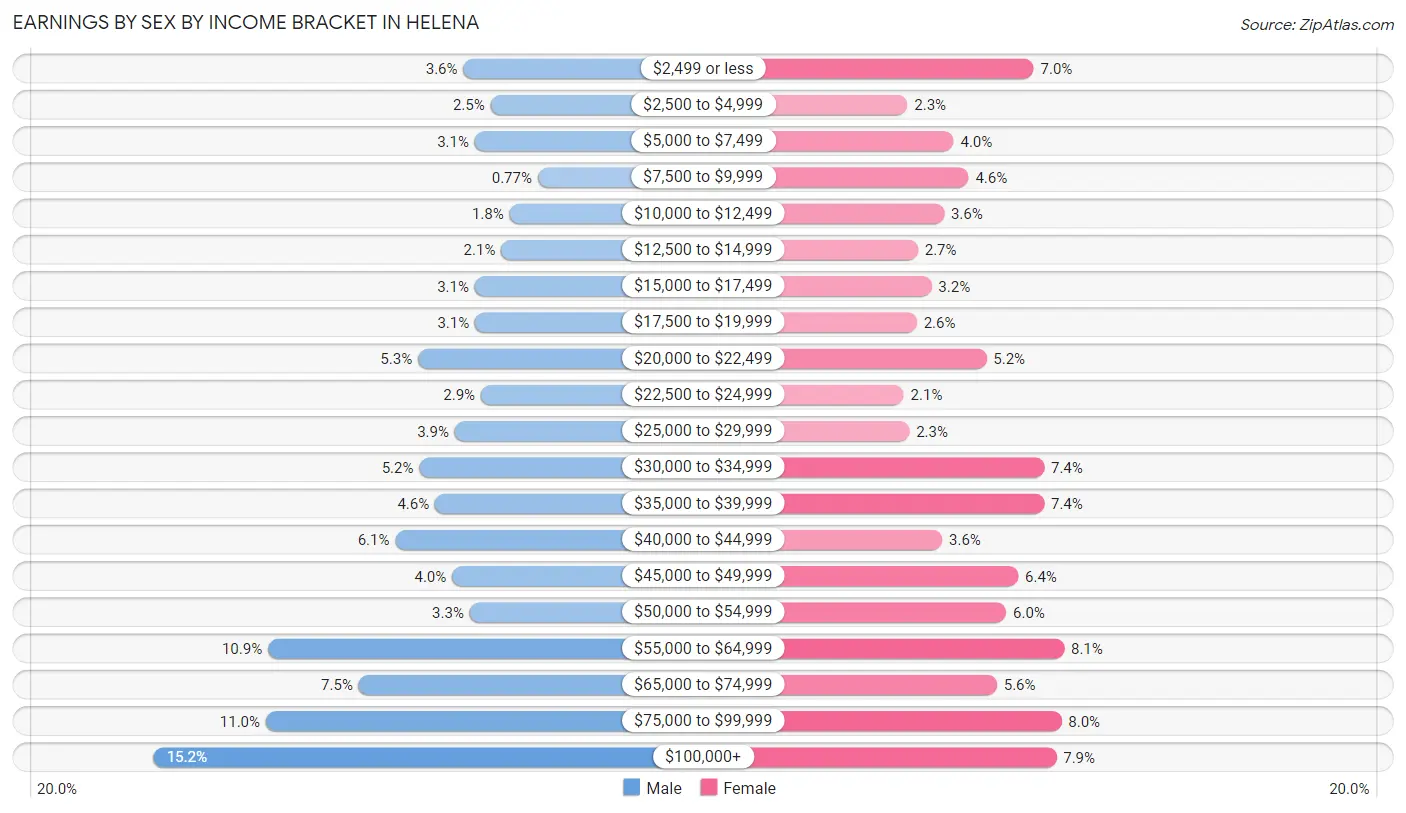
Earnings by Sex by Income Bracket in Helena
The most common earnings brackets in Helena are $100,000+ for men (1,400 | 15.2%) and $55,000 to $64,999 for women (729 | 8.1%).
| Income | Male | Female |
| $2,499 or less | 329 (3.6%) | 627 (7.0%) |
| $2,500 to $4,999 | 235 (2.5%) | 203 (2.3%) |
| $5,000 to $7,499 | 289 (3.1%) | 358 (4.0%) |
| $7,500 to $9,999 | 71 (0.8%) | 409 (4.6%) |
| $10,000 to $12,499 | 169 (1.8%) | 326 (3.6%) |
| $12,500 to $14,999 | 198 (2.1%) | 238 (2.7%) |
| $15,000 to $17,499 | 289 (3.1%) | 284 (3.2%) |
| $17,500 to $19,999 | 288 (3.1%) | 235 (2.6%) |
| $20,000 to $22,499 | 486 (5.3%) | 469 (5.2%) |
| $22,500 to $24,999 | 268 (2.9%) | 191 (2.1%) |
| $25,000 to $29,999 | 358 (3.9%) | 210 (2.3%) |
| $30,000 to $34,999 | 481 (5.2%) | 662 (7.4%) |
| $35,000 to $39,999 | 427 (4.6%) | 662 (7.4%) |
| $40,000 to $44,999 | 564 (6.1%) | 320 (3.6%) |
| $45,000 to $49,999 | 368 (4.0%) | 575 (6.4%) |
| $50,000 to $54,999 | 307 (3.3%) | 535 (6.0%) |
| $55,000 to $64,999 | 1,005 (10.9%) | 729 (8.1%) |
| $65,000 to $74,999 | 691 (7.5%) | 504 (5.6%) |
| $75,000 to $99,999 | 1,012 (11.0%) | 720 (8.0%) |
| $100,000+ | 1,400 (15.2%) | 703 (7.9%) |
| Total | 9,235 (100.0%) | 8,960 (100.0%) |
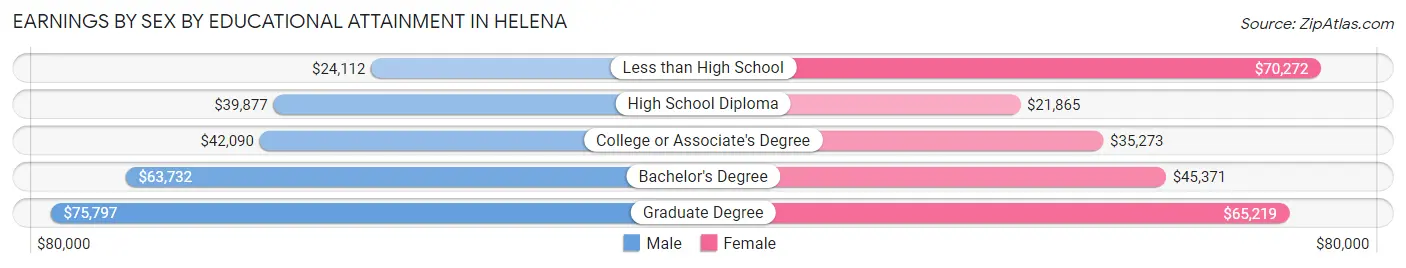
Earnings by Sex by Educational Attainment in Helena
Average earnings in Helena are $55,751 for men and $42,866 for women, a difference of 23.1%. Men with an educational attainment of graduate degree enjoy the highest average annual earnings of $75,797, while those with less than high school education earn the least with $24,112. Women with an educational attainment of less than high school earn the most with the average annual earnings of $70,272, while those with high school diploma education have the smallest earnings of $21,865.
| Educational Attainment | Male Income | Female Income |
| Less than High School | $24,112 | $70,272 |
| High School Diploma | $39,877 | $21,865 |
| College or Associate's Degree | $42,090 | $35,273 |
| Bachelor's Degree | $63,732 | $45,371 |
| Graduate Degree | $75,797 | $65,219 |
| Total | $55,751 | $42,866 |
Family Income in Helena
Family Income Brackets in Helena
According to the Helena family income data, there are 1,582 families falling into the $100,000 to $149,999 income range, which is the most common income bracket and makes up 21.9% of all families. Conversely, the $10,000 to $14,999 income bracket is the least frequent group with only 123 families (1.7%) belonging to this category.
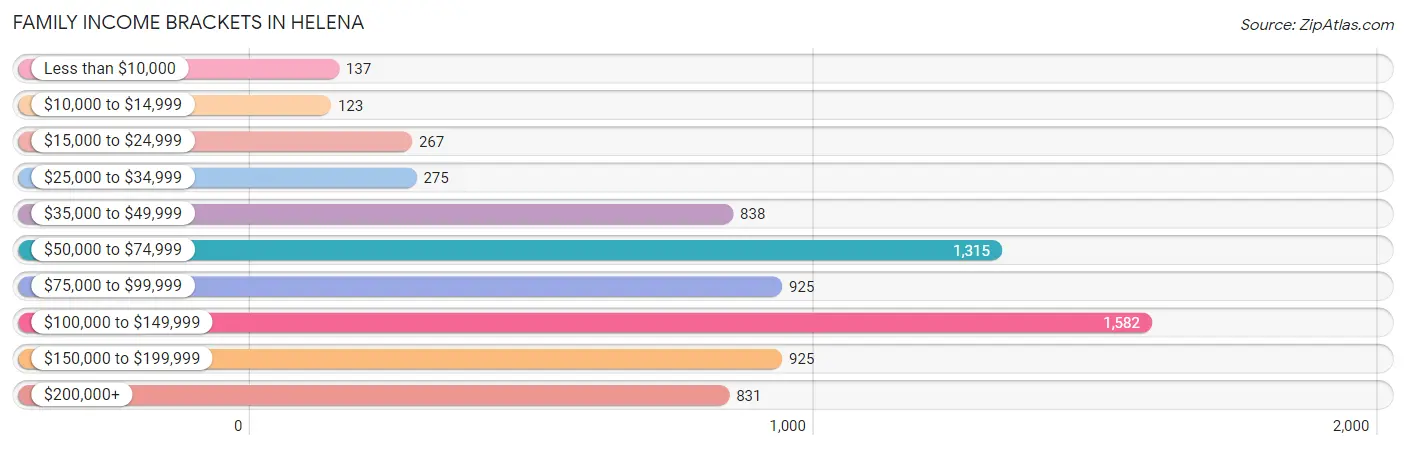
| Income Bracket | # Families | % Families |
| Less than $10,000 | 137 | 1.9% |
| $10,000 to $14,999 | 123 | 1.7% |
| $15,000 to $24,999 | 267 | 3.7% |
| $25,000 to $34,999 | 275 | 3.8% |
| $35,000 to $49,999 | 838 | 11.6% |
| $50,000 to $74,999 | 1,315 | 18.2% |
| $75,000 to $99,999 | 925 | 12.8% |
| $100,000 to $149,999 | 1,582 | 21.9% |
| $150,000 to $199,999 | 925 | 12.8% |
| $200,000+ | 831 | 11.5% |
Family Income by Famaliy Size in Helena
4-person families (1,158 | 16.0%) account for the highest median family income in Helena with $143,235 per family, while 2-person families (4,085 | 56.6%) have the highest median income of $40,643 per family member.
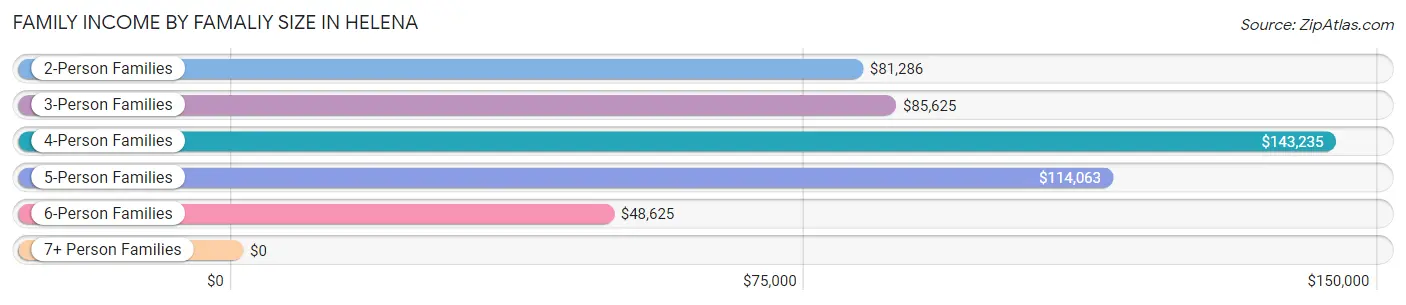
| Income Bracket | # Families | Median Income |
| 2-Person Families | 4,085 (56.6%) | $81,286 |
| 3-Person Families | 1,406 (19.5%) | $85,625 |
| 4-Person Families | 1,158 (16.0%) | $143,235 |
| 5-Person Families | 374 (5.2%) | $114,063 |
| 6-Person Families | 143 (2.0%) | $48,625 |
| 7+ Person Families | 58 (0.8%) | $0 |
| Total | 7,224 (100.0%) | $90,522 |
Family Income by Number of Earners in Helena
The median family income in Helena is $90,522, with families comprising 3+ earners (417) having the highest median family income of $158,083, while families with no earners (1,247) have the lowest median family income of $65,324, accounting for 5.8% and 17.3% of families, respectively.
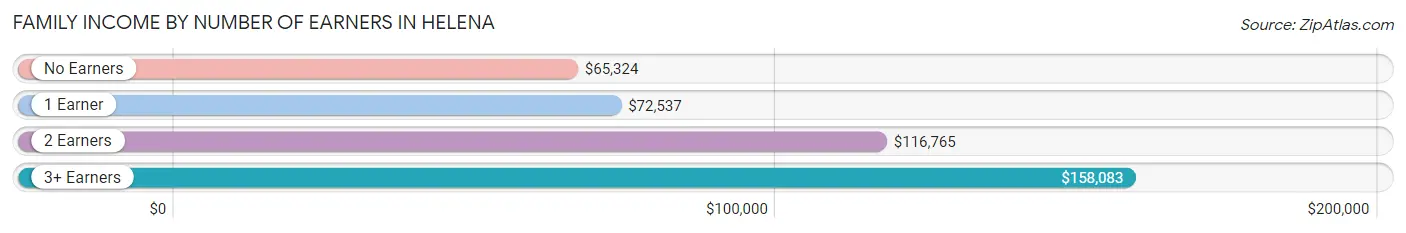
| Number of Earners | # Families | Median Income |
| No Earners | 1,247 (17.3%) | $65,324 |
| 1 Earner | 2,268 (31.4%) | $72,537 |
| 2 Earners | 3,292 (45.6%) | $116,765 |
| 3+ Earners | 417 (5.8%) | $158,083 |
| Total | 7,224 (100.0%) | $90,522 |
Household Income in Helena
Household Income Brackets in Helena
With 3,184 households falling in the category, the $50,000 to $74,999 income range is the most frequent in Helena, accounting for 20.9% of all households. In contrast, only 548 households (3.6%) fall into the $10,000 to $14,999 income bracket, making it the least populous group.
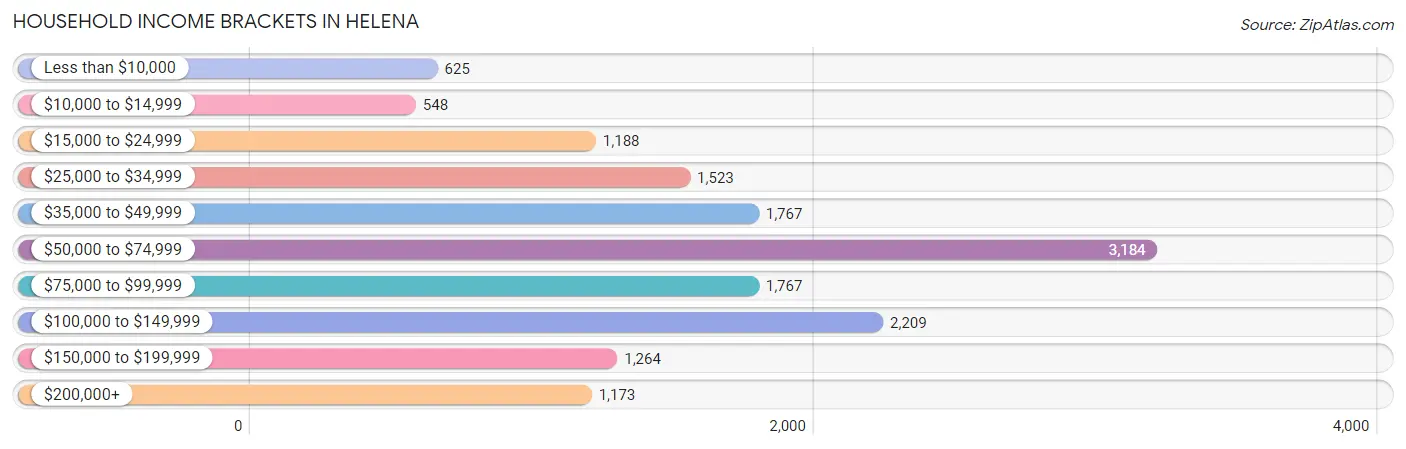
| Income Bracket | # Households | % Households |
| Less than $10,000 | 625 | 4.1% |
| $10,000 to $14,999 | 548 | 3.6% |
| $15,000 to $24,999 | 1,188 | 7.8% |
| $25,000 to $34,999 | 1,523 | 10.0% |
| $35,000 to $49,999 | 1,767 | 11.6% |
| $50,000 to $74,999 | 3,184 | 20.9% |
| $75,000 to $99,999 | 1,767 | 11.6% |
| $100,000 to $149,999 | 2,209 | 14.5% |
| $150,000 to $199,999 | 1,264 | 8.3% |
| $200,000+ | 1,173 | 7.7% |
Household Income by Householder Age in Helena
The median household income in Helena is $64,798, with the highest median household income of $78,848 found in the 25 to 44 years age bracket for the primary householder. A total of 4,856 households (31.9%) fall into this category. Meanwhile, the 15 to 24 years age bracket for the primary householder has the lowest median household income of $44,188, with 887 households (5.8%) in this group.
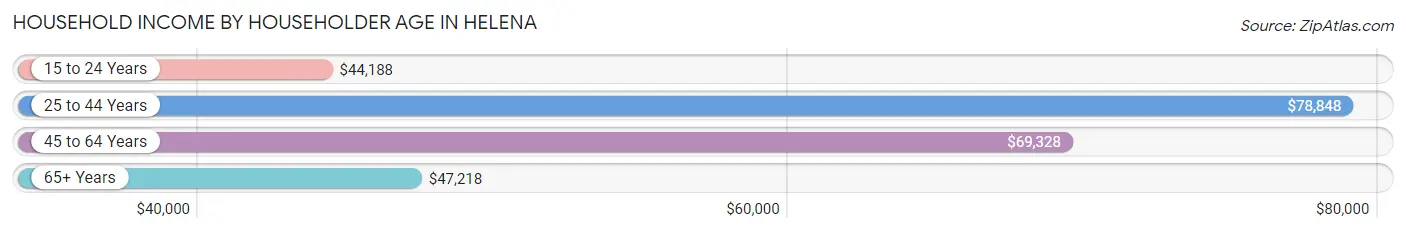
| Income Bracket | # Households | Median Income |
| 15 to 24 Years | 887 (5.8%) | $44,188 |
| 25 to 44 Years | 4,856 (31.9%) | $78,848 |
| 45 to 64 Years | 4,894 (32.1%) | $69,328 |
| 65+ Years | 4,596 (30.2%) | $47,218 |
| Total | 15,233 (100.0%) | $64,798 |
Poverty in Helena
Income Below Poverty by Sex and Age in Helena
With 9.5% poverty level for males and 10.7% for females among the residents of Helena, 5 year old males and 15 year old females are the most vulnerable to poverty, with 74 males (39.8%) and 39 females (49.4%) in their respective age groups living below the poverty level.
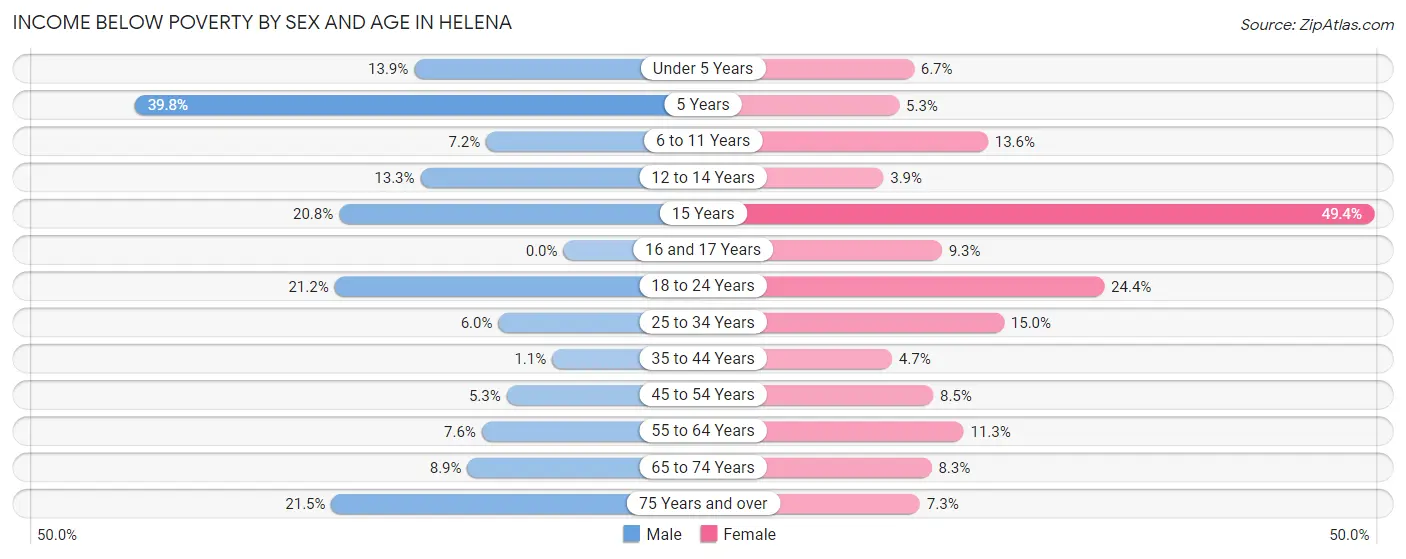
| Age Bracket | Male | Female |
| Under 5 Years | 114 (13.9%) | 50 (6.7%) |
| 5 Years | 74 (39.8%) | 5 (5.3%) |
| 6 to 11 Years | 72 (7.2%) | 139 (13.6%) |
| 12 to 14 Years | 71 (13.3%) | 25 (3.8%) |
| 15 Years | 56 (20.8%) | 39 (49.4%) |
| 16 and 17 Years | 0 (0.0%) | 33 (9.3%) |
| 18 to 24 Years | 268 (21.2%) | 349 (24.3%) |
| 25 to 34 Years | 137 (6.0%) | 318 (15.0%) |
| 35 to 44 Years | 23 (1.1%) | 91 (4.6%) |
| 45 to 54 Years | 83 (5.3%) | 157 (8.5%) |
| 55 to 64 Years | 141 (7.6%) | 252 (11.3%) |
| 65 to 74 Years | 153 (8.9%) | 165 (8.3%) |
| 75 Years and over | 223 (21.5%) | 132 (7.2%) |
| Total | 1,415 (9.5%) | 1,755 (10.7%) |
Income Above Poverty by Sex and Age in Helena
According to the poverty statistics in Helena, males aged 16 and 17 years and females aged 12 to 14 years are the age groups that are most secure financially, with 100.0% of males and 96.2% of females in these age groups living above the poverty line.
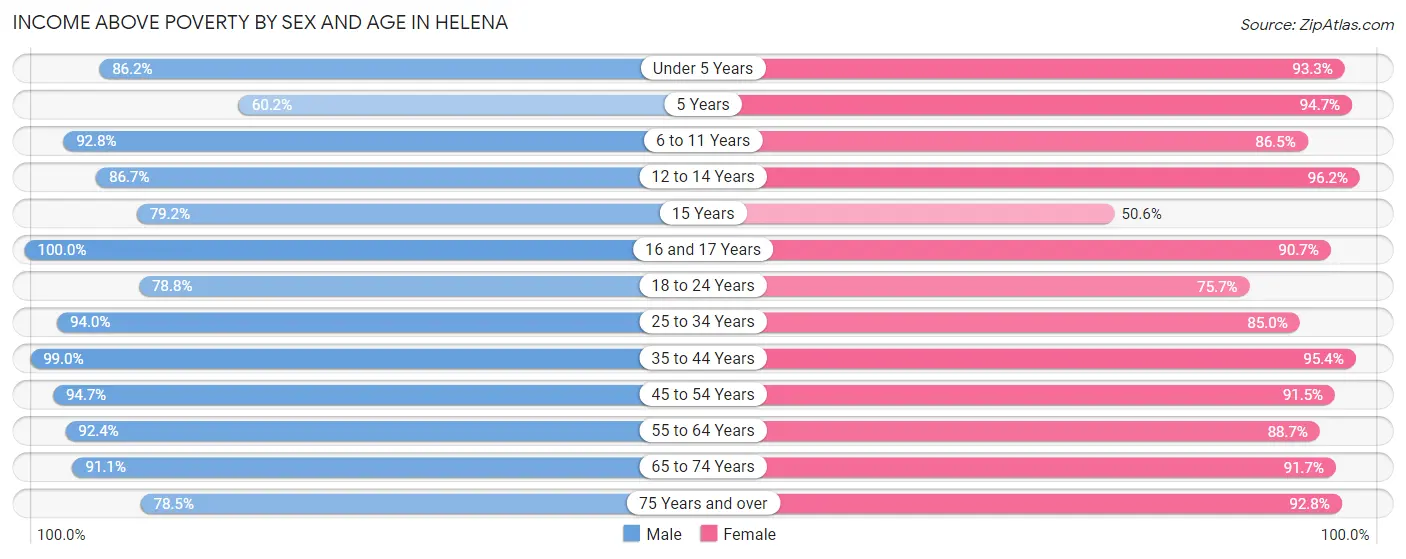
| Age Bracket | Male | Female |
| Under 5 Years | 709 (86.2%) | 698 (93.3%) |
| 5 Years | 112 (60.2%) | 89 (94.7%) |
| 6 to 11 Years | 932 (92.8%) | 887 (86.5%) |
| 12 to 14 Years | 464 (86.7%) | 625 (96.2%) |
| 15 Years | 213 (79.2%) | 40 (50.6%) |
| 16 and 17 Years | 168 (100.0%) | 323 (90.7%) |
| 18 to 24 Years | 994 (78.8%) | 1,084 (75.6%) |
| 25 to 34 Years | 2,132 (94.0%) | 1,796 (85.0%) |
| 35 to 44 Years | 2,173 (99.0%) | 1,865 (95.4%) |
| 45 to 54 Years | 1,493 (94.7%) | 1,697 (91.5%) |
| 55 to 64 Years | 1,720 (92.4%) | 1,979 (88.7%) |
| 65 to 74 Years | 1,564 (91.1%) | 1,819 (91.7%) |
| 75 Years and over | 813 (78.5%) | 1,688 (92.7%) |
| Total | 13,487 (90.5%) | 14,590 (89.3%) |
Income Below Poverty Among Married-Couple Families in Helena
The poverty statistics for married-couple families in Helena show that 3.5% or 192 of the total 5,490 families live below the poverty line. Families with 5 or more children have the highest poverty rate of 43.1%, comprising of 22 families. On the other hand, families with 1 or 2 children have the lowest poverty rate of 0.0%, which includes 0 families.
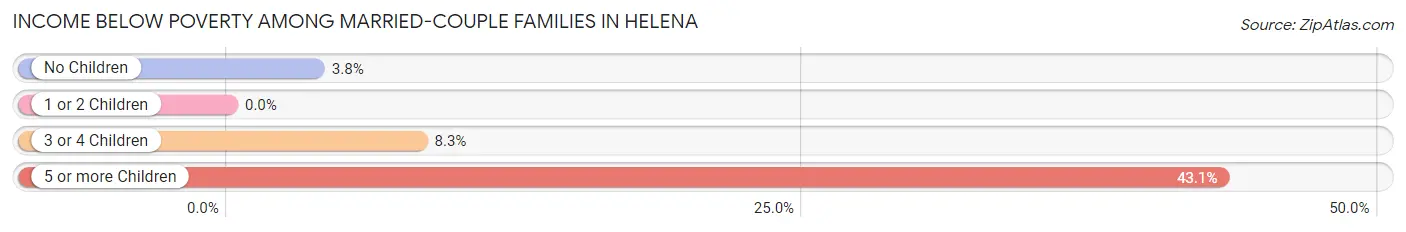
| Children | Above Poverty | Below Poverty |
| No Children | 3,258 (96.2%) | 128 (3.8%) |
| 1 or 2 Children | 1,544 (100.0%) | 0 (0.0%) |
| 3 or 4 Children | 467 (91.7%) | 42 (8.3%) |
| 5 or more Children | 29 (56.9%) | 22 (43.1%) |
| Total | 5,298 (96.5%) | 192 (3.5%) |
Income Below Poverty Among Single-Parent Households in Helena
According to the poverty data in Helena, 5.8% or 27 single-father households and 19.4% or 246 single-mother households are living below the poverty line. Among single-father households, those with 1 or 2 children have the highest poverty rate, with 25 households (9.7%) experiencing poverty. Likewise, among single-mother households, those with 3 or 4 children have the highest poverty rate, with 51 households (31.3%) falling below the poverty line.
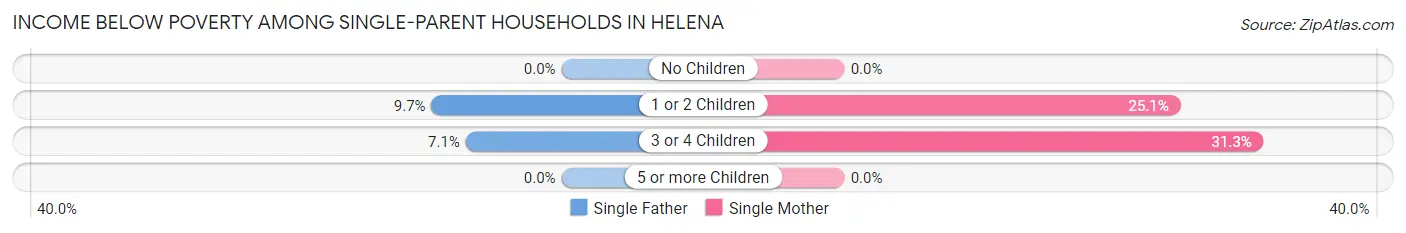
| Children | Single Father | Single Mother |
| No Children | 0 (0.0%) | 0 (0.0%) |
| 1 or 2 Children | 25 (9.7%) | 195 (25.1%) |
| 3 or 4 Children | 2 (7.1%) | 51 (31.3%) |
| 5 or more Children | 0 (0.0%) | 0 (0.0%) |
| Total | 27 (5.8%) | 246 (19.4%) |
Income Below Poverty Among Married-Couple vs Single-Parent Households in Helena
The poverty data for Helena shows that 192 of the married-couple family households (3.5%) and 273 of the single-parent households (15.7%) are living below the poverty level. Within the married-couple family households, those with 5 or more children have the highest poverty rate, with 22 households (43.1%) falling below the poverty line. Among the single-parent households, those with 3 or 4 children have the highest poverty rate, with 53 household (27.8%) living below poverty.
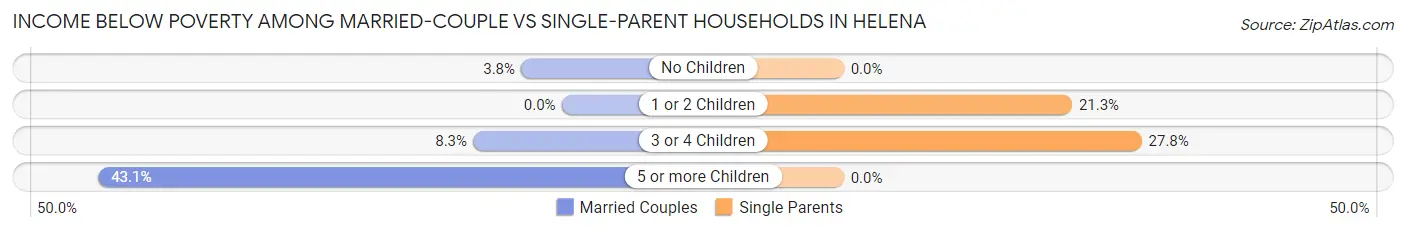
| Children | Married-Couple Families | Single-Parent Households |
| No Children | 128 (3.8%) | 0 (0.0%) |
| 1 or 2 Children | 0 (0.0%) | 220 (21.3%) |
| 3 or 4 Children | 42 (8.3%) | 53 (27.8%) |
| 5 or more Children | 22 (43.1%) | 0 (0.0%) |
| Total | 192 (3.5%) | 273 (15.7%) |
Race in Helena
The most populous races in Helena are White / Caucasian (29,872 | 91.8%), Hispanic or Latino (1,557 | 4.8%), and Two or more Races (1,421 | 4.4%).
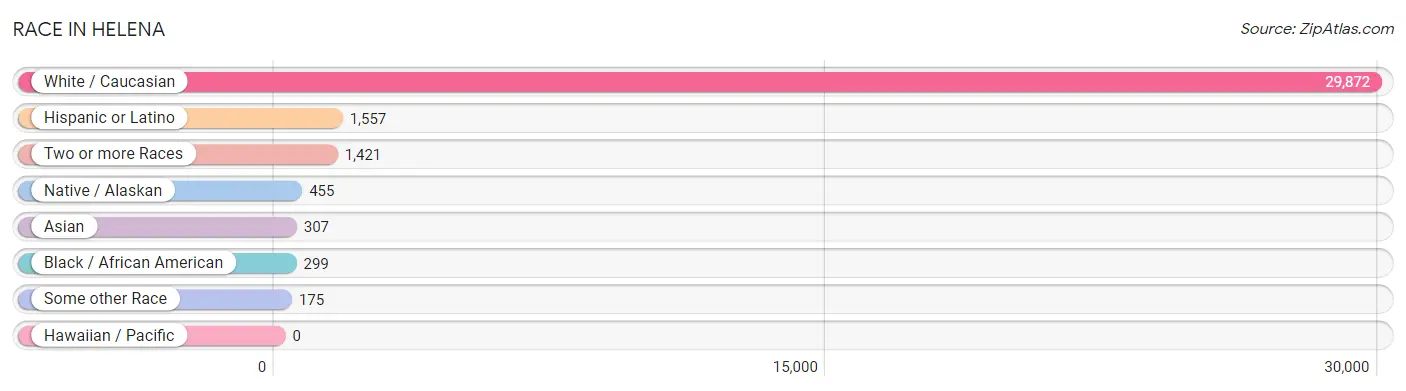
| Race | # Population | % Population |
| Asian | 307 | 0.9% |
| Black / African American | 299 | 0.9% |
| Hawaiian / Pacific | 0 | 0.0% |
| Hispanic or Latino | 1,557 | 4.8% |
| Native / Alaskan | 455 | 1.4% |
| White / Caucasian | 29,872 | 91.8% |
| Two or more Races | 1,421 | 4.4% |
| Some other Race | 175 | 0.5% |
| Total | 32,529 | 100.0% |
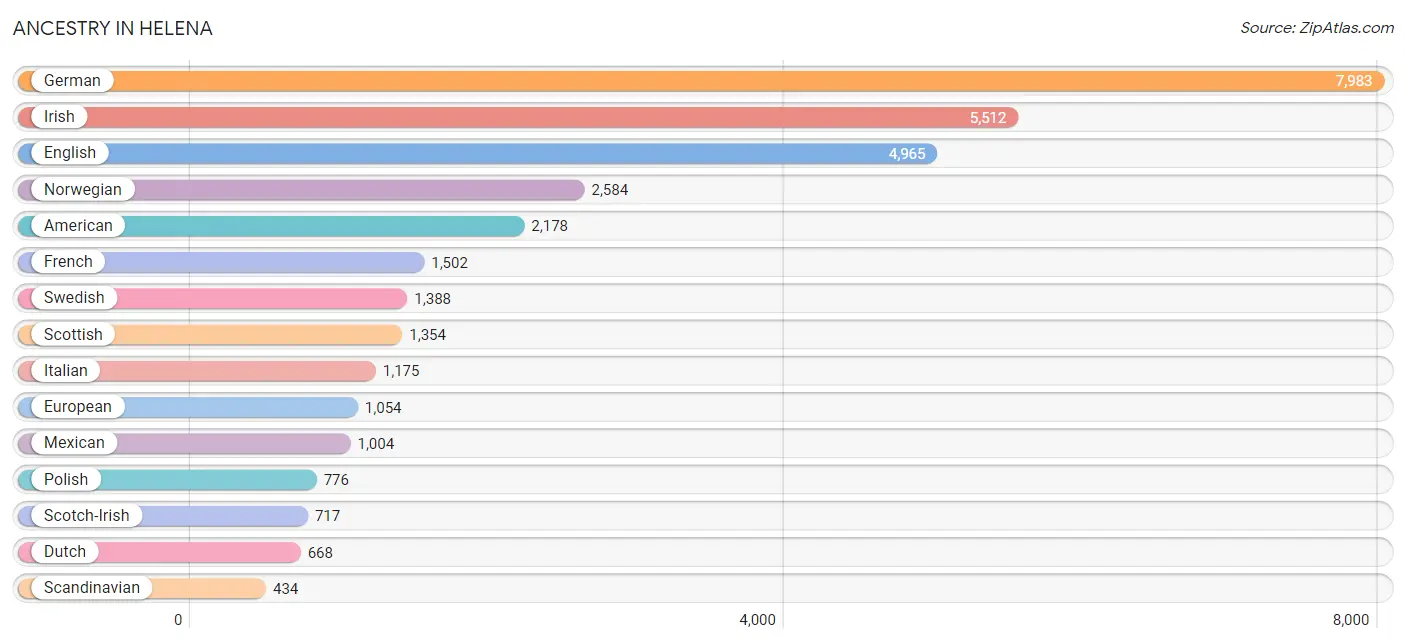
Ancestry in Helena
The most populous ancestries reported in Helena are German (7,983 | 24.5%), Irish (5,512 | 16.9%), English (4,965 | 15.3%), Norwegian (2,584 | 7.9%), and American (2,178 | 6.7%), together accounting for 71.4% of all Helena residents.
| Ancestry | # Population | % Population |
| Alaskan Athabascan | 2 | 0.0% |
| American | 2,178 | 6.7% |
| Arab | 84 | 0.3% |
| Armenian | 44 | 0.1% |
| Austrian | 145 | 0.4% |
| Basque | 104 | 0.3% |
| Belgian | 83 | 0.3% |
| Bhutanese | 96 | 0.3% |
| Blackfeet | 322 | 1.0% |
| Brazilian | 43 | 0.1% |
| British | 366 | 1.1% |
| Bulgarian | 14 | 0.0% |
| Burmese | 137 | 0.4% |
| Canadian | 4 | 0.0% |
| Central American | 22 | 0.1% |
| Central American Indian | 11 | 0.0% |
| Cherokee | 249 | 0.8% |
| Cheyenne | 71 | 0.2% |
| Chippewa | 91 | 0.3% |
| Choctaw | 9 | 0.0% |
| Colombian | 91 | 0.3% |
| Cree | 106 | 0.3% |
| Croatian | 109 | 0.3% |
| Crow | 11 | 0.0% |
| Cuban | 73 | 0.2% |
| Czech | 120 | 0.4% |
| Czechoslovakian | 25 | 0.1% |
| Danish | 262 | 0.8% |
| Dominican | 9 | 0.0% |
| Dutch | 668 | 2.1% |
| Dutch West Indian | 11 | 0.0% |
| Eastern European | 112 | 0.3% |
| Ecuadorian | 4 | 0.0% |
| English | 4,965 | 15.3% |
| Ethiopian | 7 | 0.0% |
| European | 1,054 | 3.2% |
| Finnish | 364 | 1.1% |
| French | 1,502 | 4.6% |
| French Canadian | 144 | 0.4% |
| German | 7,983 | 24.5% |
| Greek | 49 | 0.2% |
| Guatemalan | 22 | 0.1% |
| Hungarian | 160 | 0.5% |
| Icelander | 27 | 0.1% |
| Indian (Asian) | 7 | 0.0% |
| Iranian | 22 | 0.1% |
| Irish | 5,512 | 16.9% |
| Iroquois | 5 | 0.0% |
| Italian | 1,175 | 3.6% |
| Jamaican | 31 | 0.1% |
| Korean | 39 | 0.1% |
| Latvian | 4 | 0.0% |
| Lebanese | 68 | 0.2% |
| Lithuanian | 75 | 0.2% |
| Luxembourger | 15 | 0.1% |
| Macedonian | 11 | 0.0% |
| Mexican | 1,004 | 3.1% |
| Native Hawaiian | 6 | 0.0% |
| Navajo | 11 | 0.0% |
| Northern European | 189 | 0.6% |
| Norwegian | 2,584 | 7.9% |
| Pakistani | 62 | 0.2% |
| Pennsylvania German | 12 | 0.0% |
| Polish | 776 | 2.4% |
| Portuguese | 40 | 0.1% |
| Potawatomi | 26 | 0.1% |
| Puerto Rican | 161 | 0.5% |
| Puget Sound Salish | 10 | 0.0% |
| Romanian | 229 | 0.7% |
| Russian | 340 | 1.1% |
| Scandinavian | 434 | 1.3% |
| Scotch-Irish | 717 | 2.2% |
| Scottish | 1,354 | 4.2% |
| Sioux | 154 | 0.5% |
| Slavic | 30 | 0.1% |
| Slovak | 51 | 0.2% |
| Slovene | 23 | 0.1% |
| South American | 95 | 0.3% |
| Spaniard | 10 | 0.0% |
| Spanish | 165 | 0.5% |
| Subsaharan African | 7 | 0.0% |
| Swedish | 1,388 | 4.3% |
| Swiss | 190 | 0.6% |
| Thai | 114 | 0.4% |
| Tlingit-Haida | 51 | 0.2% |
| Trinidadian and Tobagonian | 16 | 0.1% |
| Ukrainian | 164 | 0.5% |
| Welsh | 245 | 0.7% |
| West Indian | 67 | 0.2% |
| Yugoslavian | 20 | 0.1% | View All 90 Rows |
Immigrants in Helena
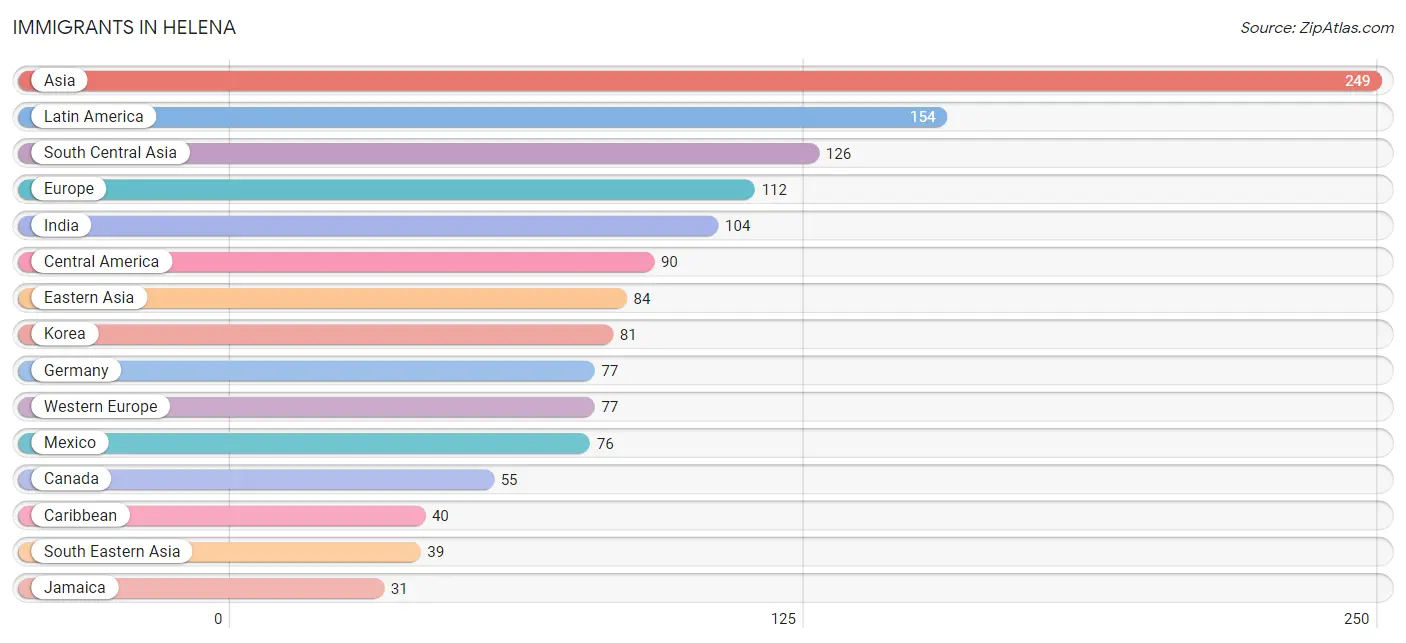
The most numerous immigrant groups reported in Helena came from Asia (249 | 0.8%), Latin America (154 | 0.5%), South Central Asia (126 | 0.4%), Europe (112 | 0.3%), and India (104 | 0.3%), together accounting for 2.3% of all Helena residents.
| Immigration Origin | # Population | % Population |
| Asia | 249 | 0.8% |
| Australia | 9 | 0.0% |
| Brazil | 15 | 0.1% |
| Canada | 55 | 0.2% |
| Caribbean | 40 | 0.1% |
| Central America | 90 | 0.3% |
| Colombia | 9 | 0.0% |
| Dominican Republic | 9 | 0.0% |
| Eastern Asia | 84 | 0.3% |
| Eastern Europe | 12 | 0.0% |
| Europe | 112 | 0.3% |
| Germany | 77 | 0.2% |
| Guatemala | 14 | 0.0% |
| India | 104 | 0.3% |
| Iran | 22 | 0.1% |
| Italy | 9 | 0.0% |
| Jamaica | 31 | 0.1% |
| Japan | 3 | 0.0% |
| Korea | 81 | 0.3% |
| Latin America | 154 | 0.5% |
| Mexico | 76 | 0.2% |
| Northern Europe | 6 | 0.0% |
| Oceania | 9 | 0.0% |
| Portugal | 8 | 0.0% |
| Russia | 12 | 0.0% |
| South America | 24 | 0.1% |
| South Central Asia | 126 | 0.4% |
| South Eastern Asia | 39 | 0.1% |
| Southern Europe | 17 | 0.1% |
| Thailand | 25 | 0.1% |
| Vietnam | 14 | 0.0% |
| Western Europe | 77 | 0.2% | View All 32 Rows |
Sex and Age in Helena
Sex and Age in Helena
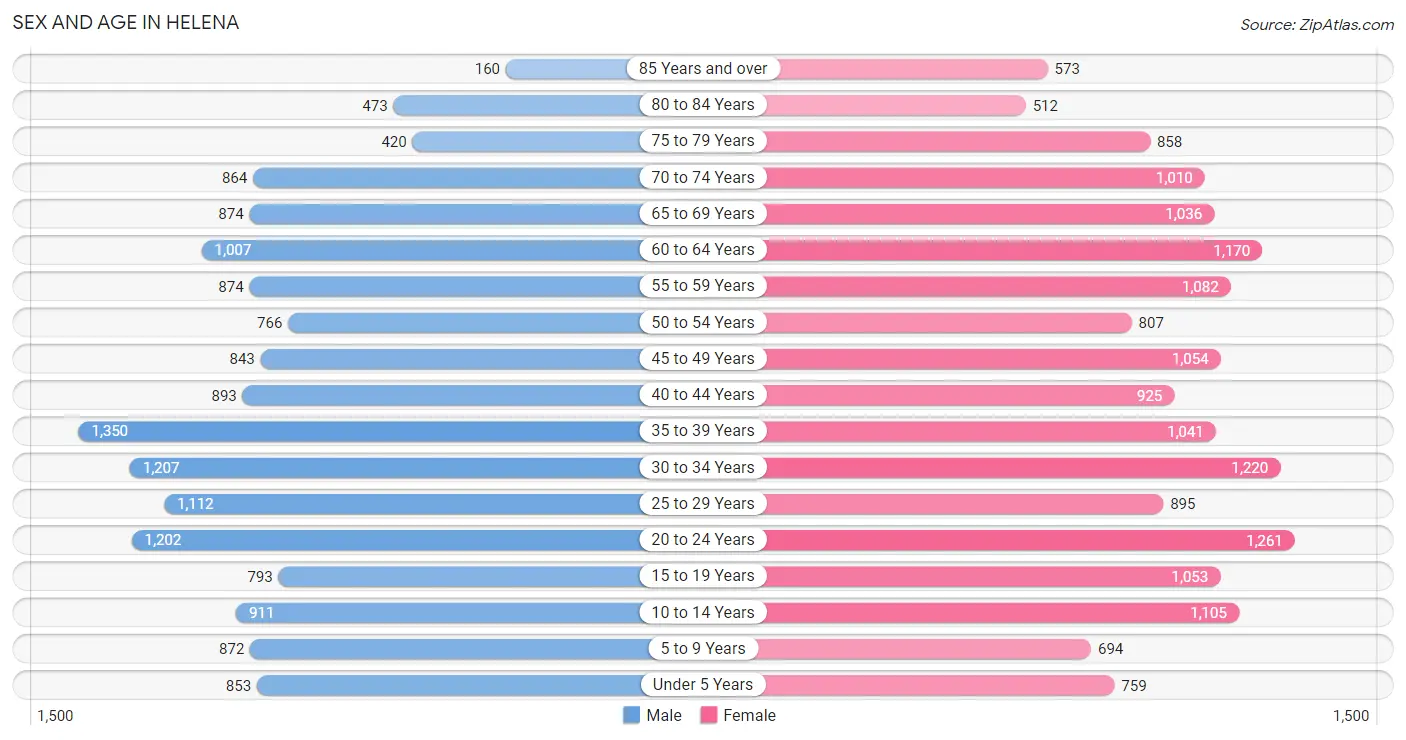
The most populous age groups in Helena are 35 to 39 Years (1,350 | 8.7%) for men and 20 to 24 Years (1,261 | 7.4%) for women.
| Age Bracket | Male | Female |
| Under 5 Years | 853 (5.5%) | 759 (4.4%) |
| 5 to 9 Years | 872 (5.6%) | 694 (4.1%) |
| 10 to 14 Years | 911 (5.9%) | 1,105 (6.5%) |
| 15 to 19 Years | 793 (5.1%) | 1,053 (6.2%) |
| 20 to 24 Years | 1,202 (7.8%) | 1,261 (7.4%) |
| 25 to 29 Years | 1,112 (7.2%) | 895 (5.2%) |
| 30 to 34 Years | 1,207 (7.8%) | 1,220 (7.1%) |
| 35 to 39 Years | 1,350 (8.7%) | 1,041 (6.1%) |
| 40 to 44 Years | 893 (5.8%) | 925 (5.4%) |
| 45 to 49 Years | 843 (5.4%) | 1,054 (6.2%) |
| 50 to 54 Years | 766 (5.0%) | 807 (4.7%) |
| 55 to 59 Years | 874 (5.7%) | 1,082 (6.3%) |
| 60 to 64 Years | 1,007 (6.5%) | 1,170 (6.9%) |
| 65 to 69 Years | 874 (5.7%) | 1,036 (6.1%) |
| 70 to 74 Years | 864 (5.6%) | 1,010 (5.9%) |
| 75 to 79 Years | 420 (2.7%) | 858 (5.0%) |
| 80 to 84 Years | 473 (3.1%) | 512 (3.0%) |
| 85 Years and over | 160 (1.0%) | 573 (3.4%) |
| Total | 15,474 (100.0%) | 17,055 (100.0%) |
Families and Households in Helena
Median Family Size in Helena
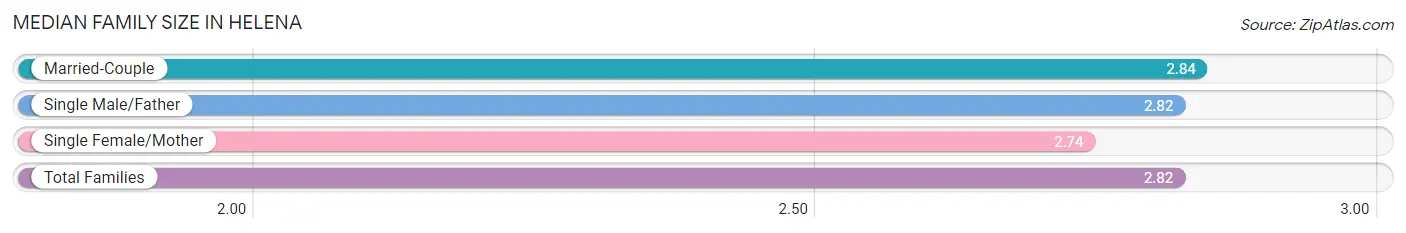
The median family size in Helena is 2.82 persons per family, with married-couple families (5,490 | 76.0%) accounting for the largest median family size of 2.84 persons per family. On the other hand, single female/mother families (1,268 | 17.5%) represent the smallest median family size with 2.74 persons per family.
| Family Type | # Families | Family Size |
| Married-Couple | 5,490 (76.0%) | 2.84 |
| Single Male/Father | 466 (6.5%) | 2.82 |
| Single Female/Mother | 1,268 (17.5%) | 2.74 |
| Total Families | 7,224 (100.0%) | 2.82 |
Median Household Size in Helena
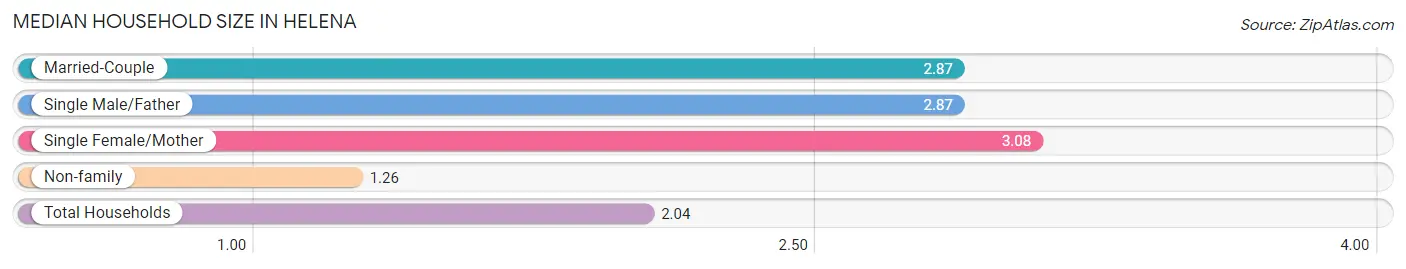
The median household size in Helena is 2.04 persons per household, with single female/mother households (1,268 | 8.3%) accounting for the largest median household size of 3.08 persons per household. non-family households (8,009 | 52.6%) represent the smallest median household size with 1.26 persons per household.
| Household Type | # Households | Household Size |
| Married-Couple | 5,490 (36.0%) | 2.87 |
| Single Male/Father | 466 (3.1%) | 2.87 |
| Single Female/Mother | 1,268 (8.3%) | 3.08 |
| Non-family | 8,009 (52.6%) | 1.26 |
| Total Households | 15,233 (100.0%) | 2.04 |
Household Size by Marriage Status in Helena
Out of a total of 15,233 households in Helena, 7,224 (47.4%) are family households, while 8,009 (52.6%) are nonfamily households. The most numerous type of family households are 2-person households, comprising 3,853, and the most common type of nonfamily households are 1-person households, comprising 6,607.
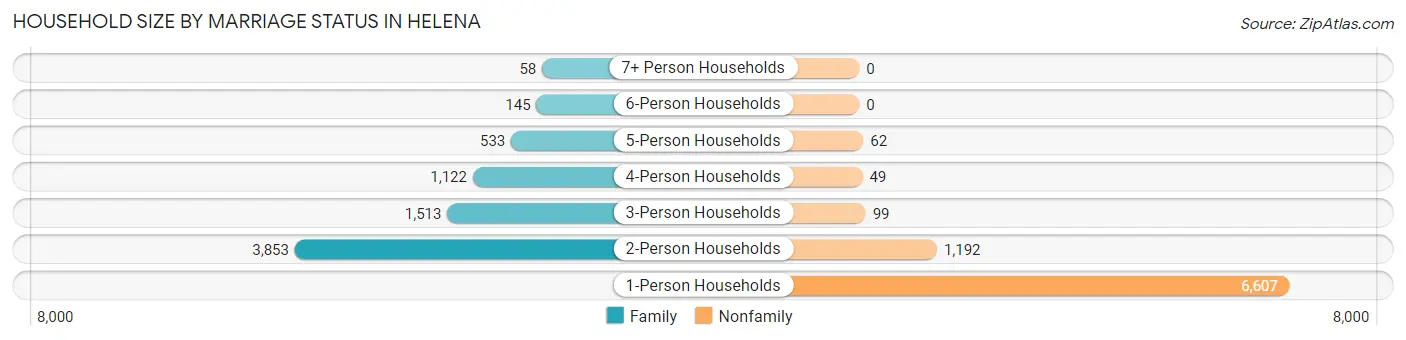
| Household Size | Family Households | Nonfamily Households |
| 1-Person Households | - | 6,607 (43.4%) |
| 2-Person Households | 3,853 (25.3%) | 1,192 (7.8%) |
| 3-Person Households | 1,513 (9.9%) | 99 (0.6%) |
| 4-Person Households | 1,122 (7.4%) | 49 (0.3%) |
| 5-Person Households | 533 (3.5%) | 62 (0.4%) |
| 6-Person Households | 145 (0.9%) | 0 (0.0%) |
| 7+ Person Households | 58 (0.4%) | 0 (0.0%) |
| Total | 7,224 (47.4%) | 8,009 (52.6%) |
Female Fertility in Helena
Fertility by Age in Helena
Average fertility rate in Helena is 47.0 births per 1,000 women. Women in the age bracket of 20 to 34 years have the highest fertility rate with 74.0 births per 1,000 women. Women in the age bracket of 20 to 34 years acount for 69.8% of all women with births.
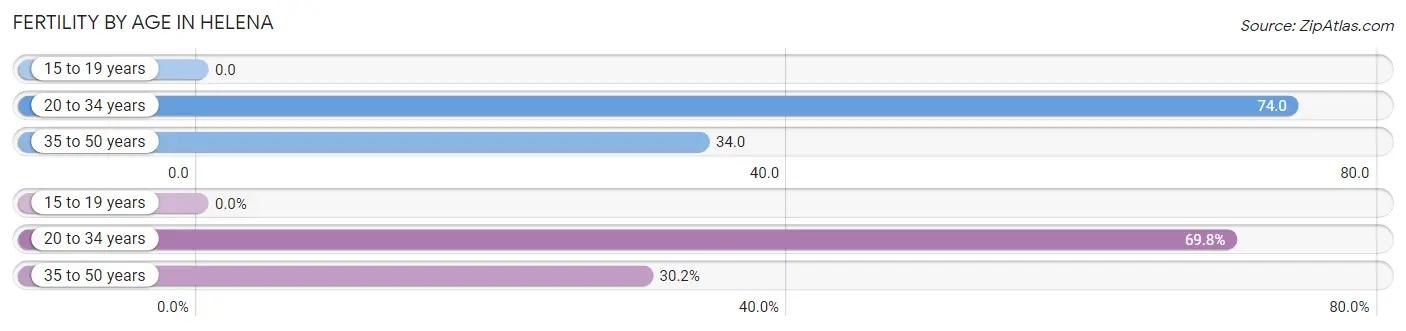
| Age Bracket | Women with Births | Births / 1,000 Women |
| 15 to 19 years | 0 (0.0%) | 0.0 |
| 20 to 34 years | 250 (69.8%) | 74.0 |
| 35 to 50 years | 108 (30.2%) | 34.0 |
| Total | 358 (100.0%) | 47.0 |
Fertility by Age by Marriage Status in Helena
90.8% of women with births (358) in Helena are married. The highest percentage of unmarried women with births falls into 35 to 50 years age bracket with 28.7% of them unmarried at the time of birth, while the lowest percentage of unmarried women with births belong to 20 to 34 years age bracket with 0.8% of them unmarried.
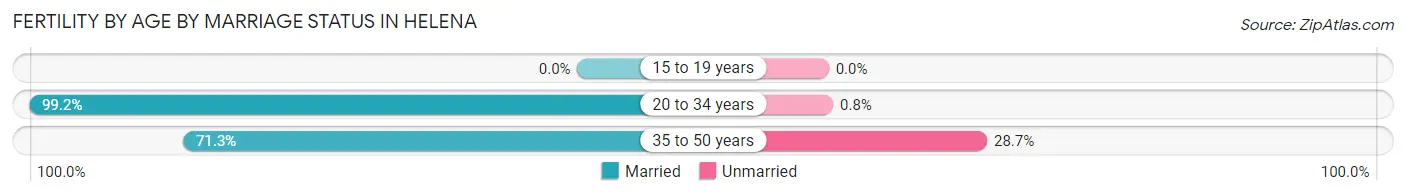
| Age Bracket | Married | Unmarried |
| 15 to 19 years | 0 (0.0%) | 0 (0.0%) |
| 20 to 34 years | 248 (99.2%) | 2 (0.8%) |
| 35 to 50 years | 77 (71.3%) | 31 (28.7%) |
| Total | 325 (90.8%) | 33 (9.2%) |
Fertility by Education in Helena
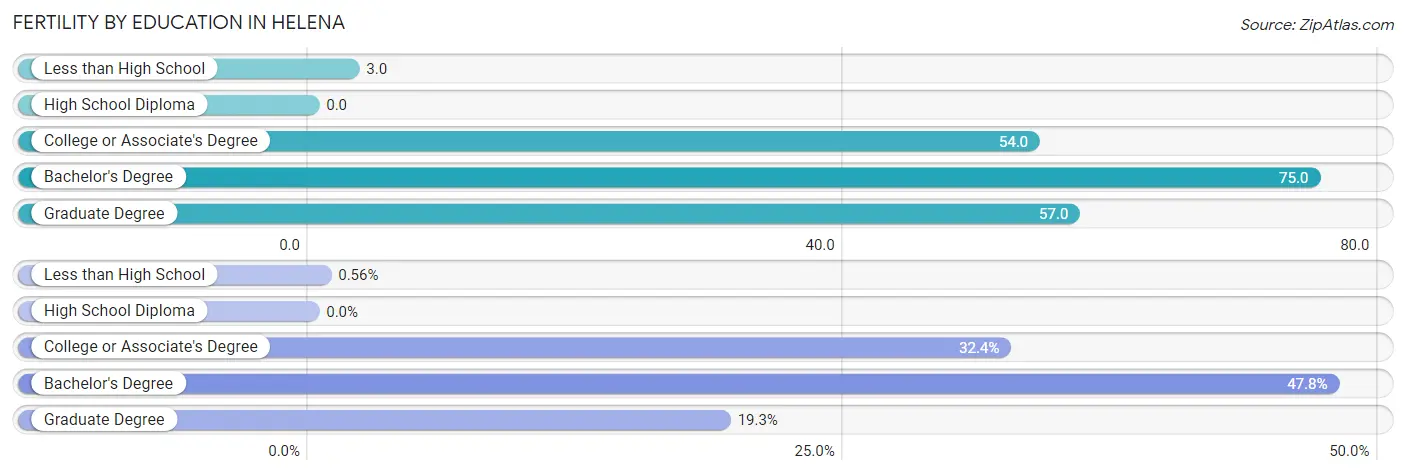
| Educational Attainment | Women with Births | Births / 1,000 Women |
| Less than High School | 2 (0.6%) | 3.0 |
| High School Diploma | 0 (0.0%) | 0.0 |
| College or Associate's Degree | 116 (32.4%) | 54.0 |
| Bachelor's Degree | 171 (47.8%) | 75.0 |
| Graduate Degree | 69 (19.3%) | 57.0 |
| Total | 358 (100.0%) | 47.0 |
Fertility by Education by Marriage Status in Helena
9.2% of women with births in Helena are unmarried. Women with the educational attainment of bachelor's degree are most likely to be married with 100.0% of them married at childbirth, while women with the educational attainment of less than high school are least likely to be married with 100.0% of them unmarried at childbirth.
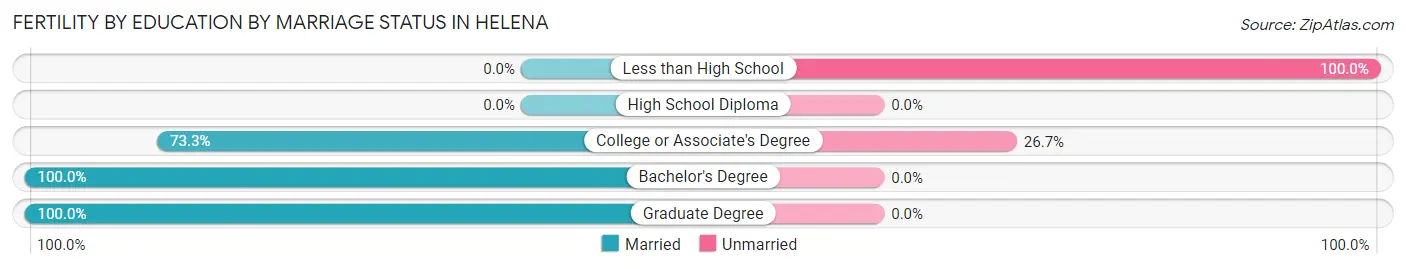
| Educational Attainment | Married | Unmarried |
| Less than High School | 0 (0.0%) | 2 (100.0%) |
| High School Diploma | 0 (0.0%) | 0 (0.0%) |
| College or Associate's Degree | 85 (73.3%) | 31 (26.7%) |
| Bachelor's Degree | 171 (100.0%) | 0 (0.0%) |
| Graduate Degree | 69 (100.0%) | 0 (0.0%) |
| Total | 325 (90.8%) | 33 (9.2%) |
Employment Characteristics in Helena
Employment by Class of Employer in Helena
Among the 16,544 employed individuals in Helena, private company employees (7,822 | 47.3%), state government employees (2,736 | 16.5%), and not-for-profit organizations (2,548 | 15.4%) make up the most common classes of employment.
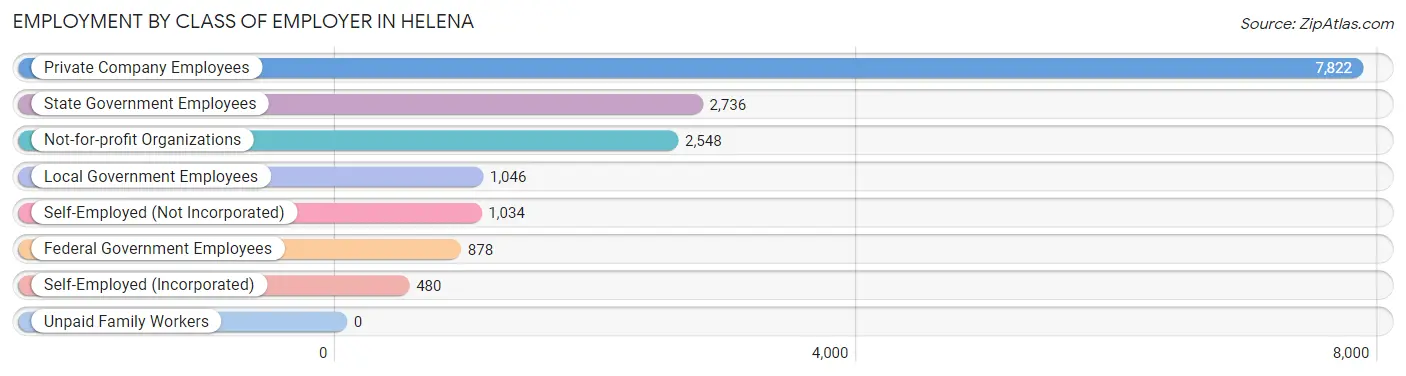
| Employer Class | # Employees | % Employees |
| Private Company Employees | 7,822 | 47.3% |
| Self-Employed (Incorporated) | 480 | 2.9% |
| Self-Employed (Not Incorporated) | 1,034 | 6.2% |
| Not-for-profit Organizations | 2,548 | 15.4% |
| Local Government Employees | 1,046 | 6.3% |
| State Government Employees | 2,736 | 16.5% |
| Federal Government Employees | 878 | 5.3% |
| Unpaid Family Workers | 0 | 0.0% |
| Total | 16,544 | 100.0% |
Employment Status by Age in Helena
According to the labor force statistics for Helena, out of the total population over 16 years of age (26,975), 64.3% or 17,345 individuals are in the labor force, with 3.2% or 555 of them unemployed. The age group with the highest labor force participation rate is 25 to 29 years, with 92.2% or 1,850 individuals in the labor force. Within the labor force, the 16 to 19 years age range has the highest percentage of unemployed individuals, with 27.3% or 180 of them being unemployed.
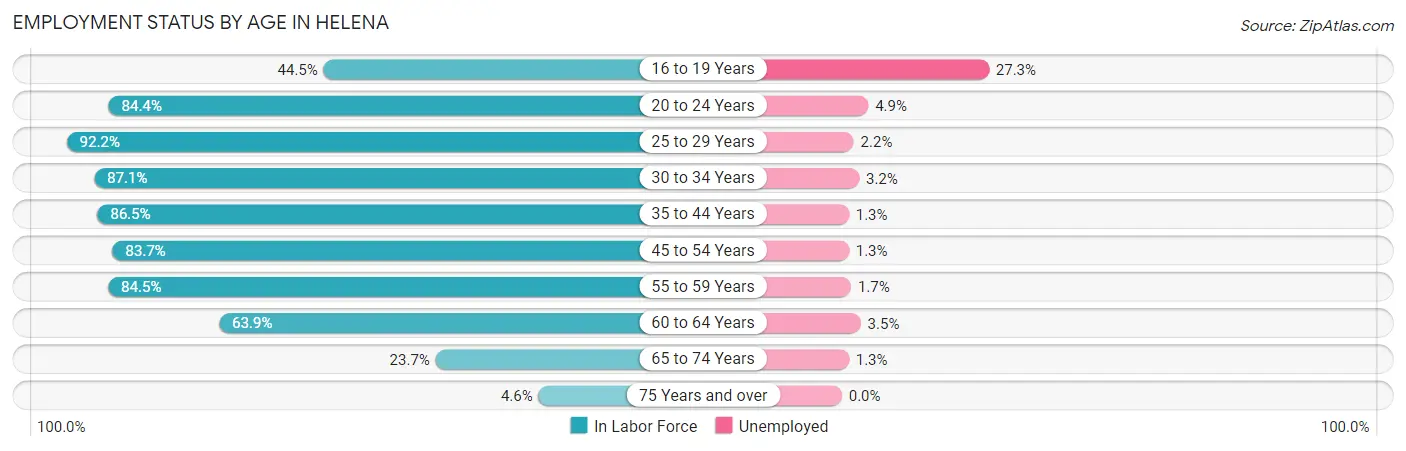
| Age Bracket | In Labor Force | Unemployed |
| 16 to 19 Years | 661 (44.5%) | 180 (27.3%) |
| 20 to 24 Years | 2,079 (84.4%) | 102 (4.9%) |
| 25 to 29 Years | 1,850 (92.2%) | 41 (2.2%) |
| 30 to 34 Years | 2,114 (87.1%) | 68 (3.2%) |
| 35 to 44 Years | 3,641 (86.5%) | 47 (1.3%) |
| 45 to 54 Years | 2,904 (83.7%) | 38 (1.3%) |
| 55 to 59 Years | 1,653 (84.5%) | 28 (1.7%) |
| 60 to 64 Years | 1,391 (63.9%) | 49 (3.5%) |
| 65 to 74 Years | 897 (23.7%) | 12 (1.3%) |
| 75 Years and over | 138 (4.6%) | 0 (0.0%) |
| Total | 17,345 (64.3%) | 555 (3.2%) |
Employment Status by Educational Attainment in Helena
According to labor force statistics for Helena, 83.5% of individuals (13,565) out of the total population between 25 and 64 years of age (16,246) are in the labor force, with 2.0% or 271 of them being unemployed. The group with the highest labor force participation rate are those with the educational attainment of bachelor's degree or higher, with 90.1% or 7,842 individuals in the labor force. Within the labor force, individuals with high school diploma education have the highest percentage of unemployment, with 3.4% or 69 of them being unemployed.
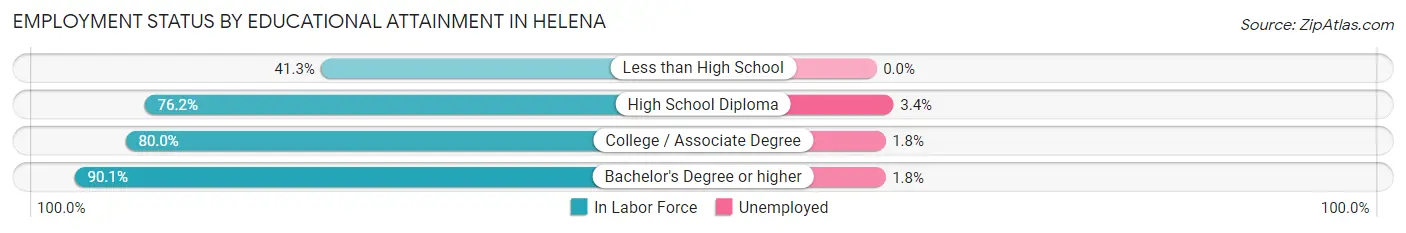
| Educational Attainment | In Labor Force | Unemployed |
| Less than High School | 231 (41.3%) | 0 (0.0%) |
| High School Diploma | 2,020 (76.2%) | 90 (3.4%) |
| College / Associate Degree | 3,466 (80.0%) | 78 (1.8%) |
| Bachelor's Degree or higher | 7,842 (90.1%) | 157 (1.8%) |
| Total | 13,565 (83.5%) | 325 (2.0%) |
Employment Occupations by Sex in Helena
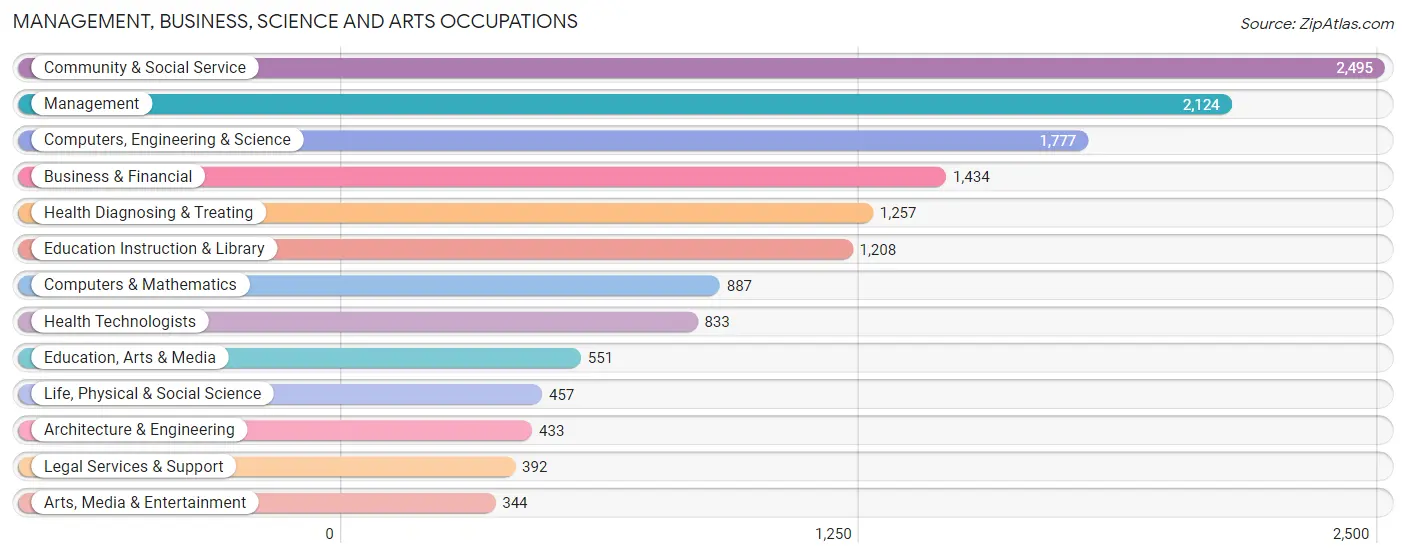
Management, Business, Science and Arts Occupations
The most common Management, Business, Science and Arts occupations in Helena are Community & Social Service (2,495 | 15.0%), Management (2,124 | 12.7%), Computers, Engineering & Science (1,777 | 10.7%), Business & Financial (1,434 | 8.6%), and Health Diagnosing & Treating (1,257 | 7.5%).
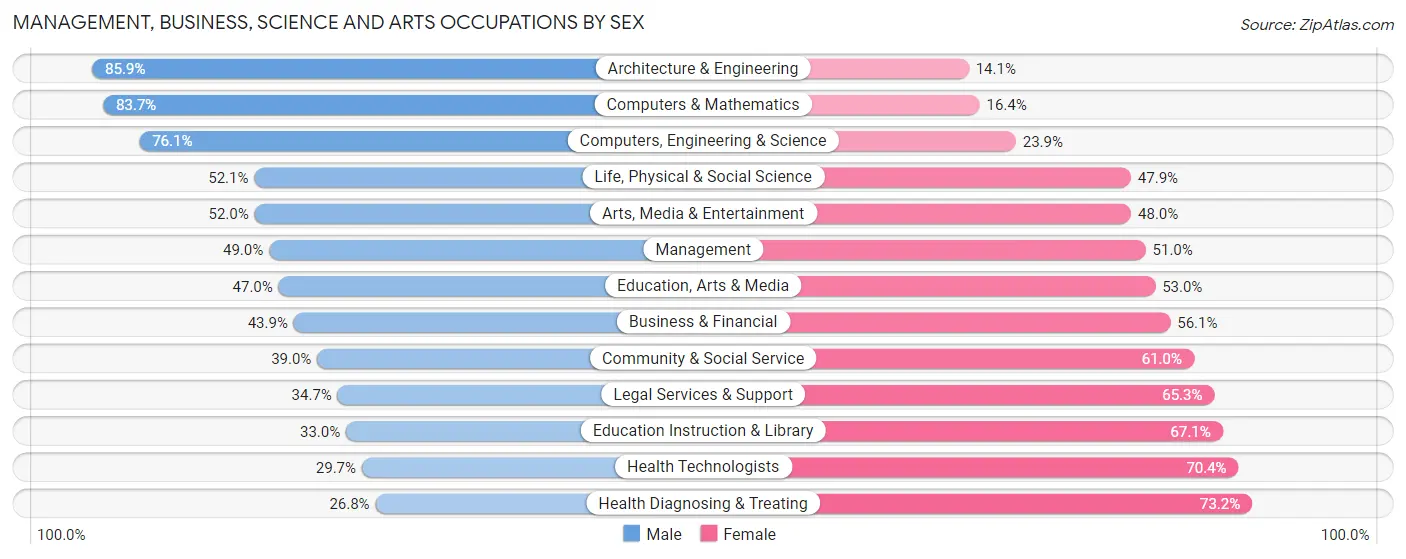
Management, Business, Science and Arts Occupations by Sex
Within the Management, Business, Science and Arts occupations in Helena, the most male-oriented occupations are Architecture & Engineering (85.9%), Computers & Mathematics (83.7%), and Computers, Engineering & Science (76.1%), while the most female-oriented occupations are Health Diagnosing & Treating (73.2%), Health Technologists (70.4%), and Education Instruction & Library (67.0%).
| Occupation | Male | Female |
| Management | 1,041 (49.0%) | 1,083 (51.0%) |
| Business & Financial | 629 (43.9%) | 805 (56.1%) |
| Computers, Engineering & Science | 1,352 (76.1%) | 425 (23.9%) |
| Computers & Mathematics | 742 (83.7%) | 145 (16.4%) |
| Architecture & Engineering | 372 (85.9%) | 61 (14.1%) |
| Life, Physical & Social Science | 238 (52.1%) | 219 (47.9%) |
| Community & Social Service | 972 (39.0%) | 1,523 (61.0%) |
| Education, Arts & Media | 259 (47.0%) | 292 (53.0%) |
| Legal Services & Support | 136 (34.7%) | 256 (65.3%) |
| Education Instruction & Library | 398 (33.0%) | 810 (67.0%) |
| Arts, Media & Entertainment | 179 (52.0%) | 165 (48.0%) |
| Health Diagnosing & Treating | 337 (26.8%) | 920 (73.2%) |
| Health Technologists | 247 (29.6%) | 586 (70.4%) |
| Total (Category) | 4,331 (47.7%) | 4,756 (52.3%) |
| Total (Overall) | 8,549 (51.3%) | 8,125 (48.7%) |
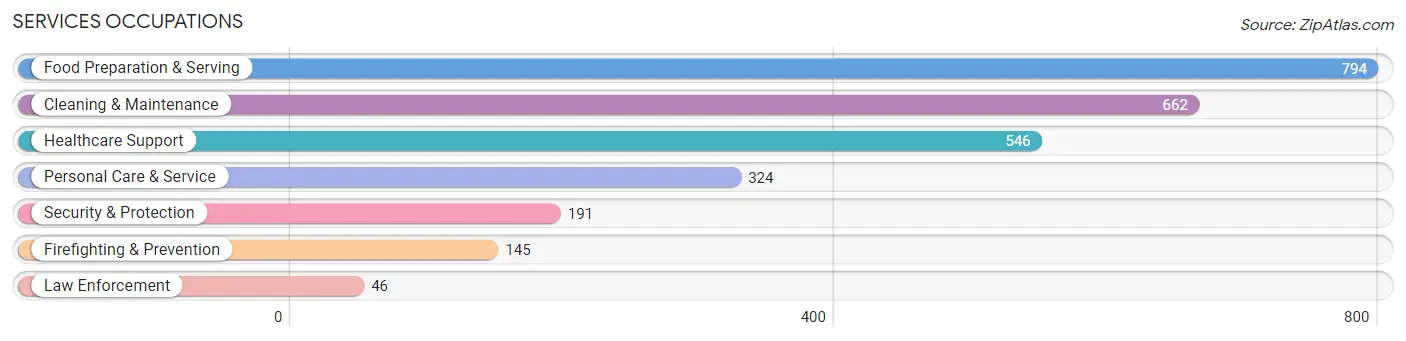
Services Occupations
The most common Services occupations in Helena are Food Preparation & Serving (794 | 4.8%), Cleaning & Maintenance (662 | 4.0%), Healthcare Support (546 | 3.3%), Personal Care & Service (324 | 1.9%), and Security & Protection (191 | 1.1%).
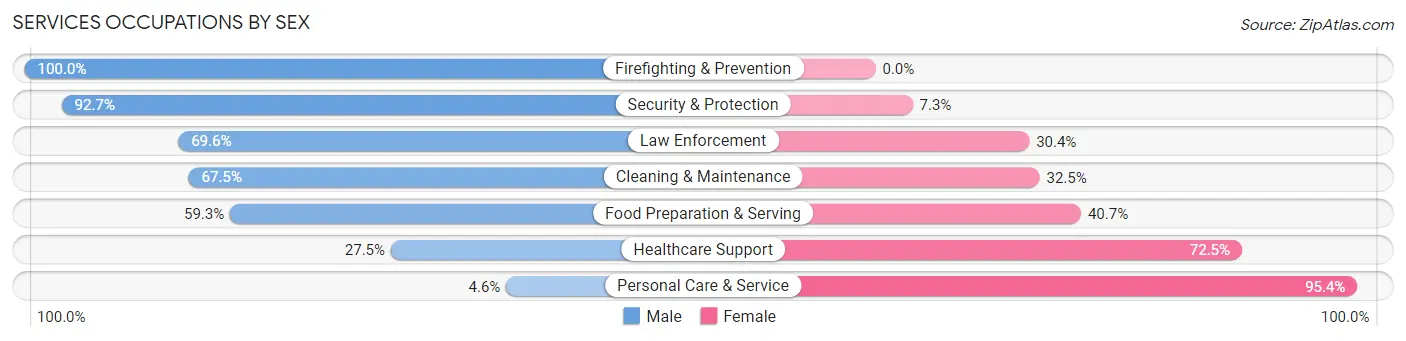
Services Occupations by Sex
Within the Services occupations in Helena, the most male-oriented occupations are Firefighting & Prevention (100.0%), Security & Protection (92.7%), and Law Enforcement (69.6%), while the most female-oriented occupations are Personal Care & Service (95.4%), Healthcare Support (72.5%), and Food Preparation & Serving (40.7%).
| Occupation | Male | Female |
| Healthcare Support | 150 (27.5%) | 396 (72.5%) |
| Security & Protection | 177 (92.7%) | 14 (7.3%) |
| Firefighting & Prevention | 145 (100.0%) | 0 (0.0%) |
| Law Enforcement | 32 (69.6%) | 14 (30.4%) |
| Food Preparation & Serving | 471 (59.3%) | 323 (40.7%) |
| Cleaning & Maintenance | 447 (67.5%) | 215 (32.5%) |
| Personal Care & Service | 15 (4.6%) | 309 (95.4%) |
| Total (Category) | 1,260 (50.1%) | 1,257 (49.9%) |
| Total (Overall) | 8,549 (51.3%) | 8,125 (48.7%) |
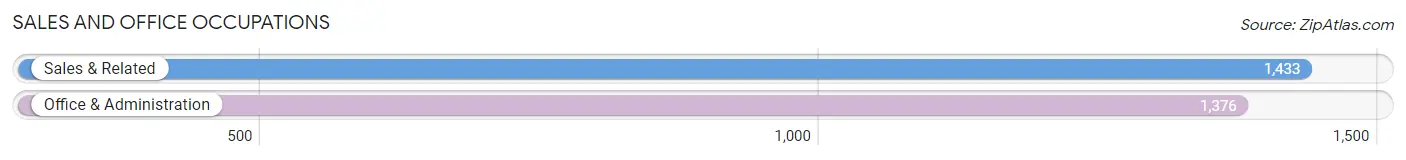
Sales and Office Occupations
The most common Sales and Office occupations in Helena are Sales & Related (1,433 | 8.6%), and Office & Administration (1,376 | 8.3%).
Sales and Office Occupations by Sex
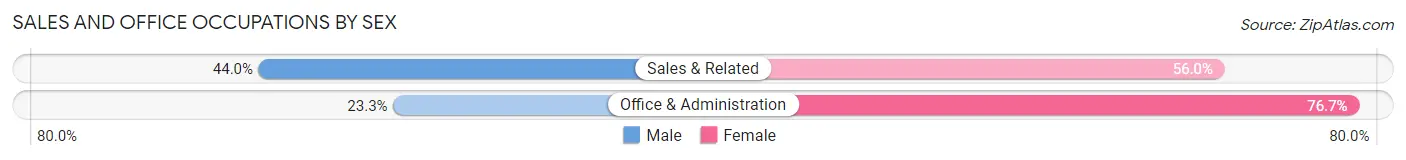
| Occupation | Male | Female |
| Sales & Related | 630 (44.0%) | 803 (56.0%) |
| Office & Administration | 320 (23.3%) | 1,056 (76.7%) |
| Total (Category) | 950 (33.8%) | 1,859 (66.2%) |
| Total (Overall) | 8,549 (51.3%) | 8,125 (48.7%) |
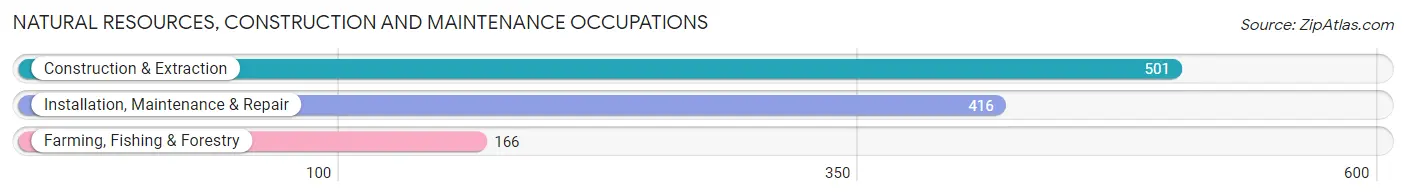
Natural Resources, Construction and Maintenance Occupations
The most common Natural Resources, Construction and Maintenance occupations in Helena are Construction & Extraction (501 | 3.0%), Installation, Maintenance & Repair (416 | 2.5%), and Farming, Fishing & Forestry (166 | 1.0%).
Natural Resources, Construction and Maintenance Occupations by Sex
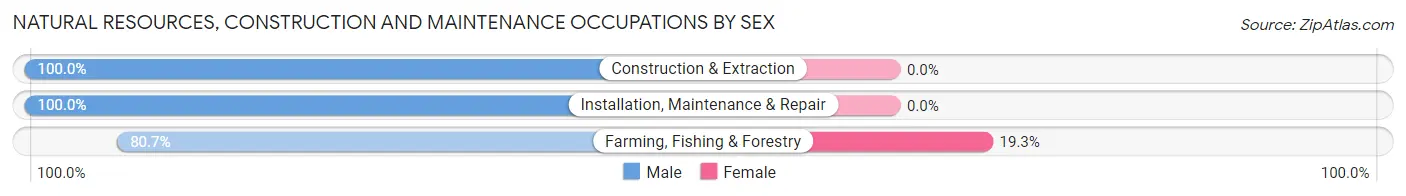
| Occupation | Male | Female |
| Farming, Fishing & Forestry | 134 (80.7%) | 32 (19.3%) |
| Construction & Extraction | 501 (100.0%) | 0 (0.0%) |
| Installation, Maintenance & Repair | 416 (100.0%) | 0 (0.0%) |
| Total (Category) | 1,051 (97.1%) | 32 (2.9%) |
| Total (Overall) | 8,549 (51.3%) | 8,125 (48.7%) |
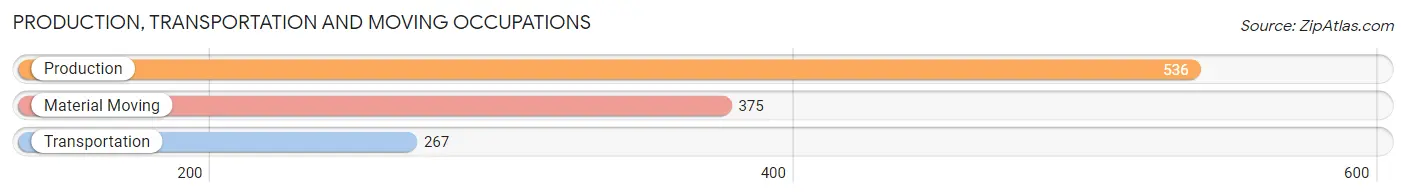
Production, Transportation and Moving Occupations
The most common Production, Transportation and Moving occupations in Helena are Production (536 | 3.2%), Material Moving (375 | 2.2%), and Transportation (267 | 1.6%).
Production, Transportation and Moving Occupations by Sex
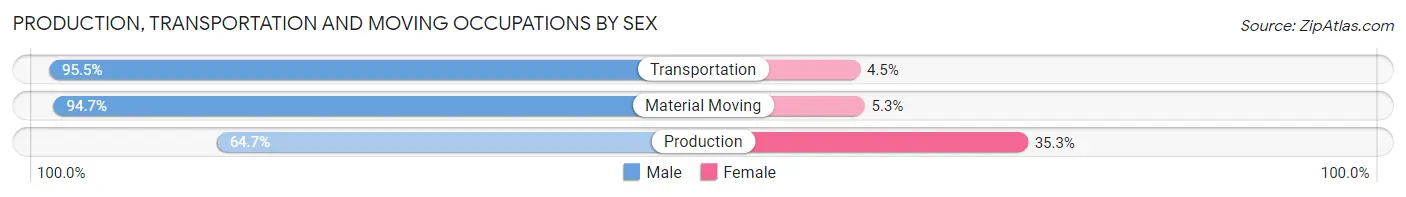
| Occupation | Male | Female |
| Production | 347 (64.7%) | 189 (35.3%) |
| Transportation | 255 (95.5%) | 12 (4.5%) |
| Material Moving | 355 (94.7%) | 20 (5.3%) |
| Total (Category) | 957 (81.2%) | 221 (18.8%) |
| Total (Overall) | 8,549 (51.3%) | 8,125 (48.7%) |
Employment Industries by Sex in Helena
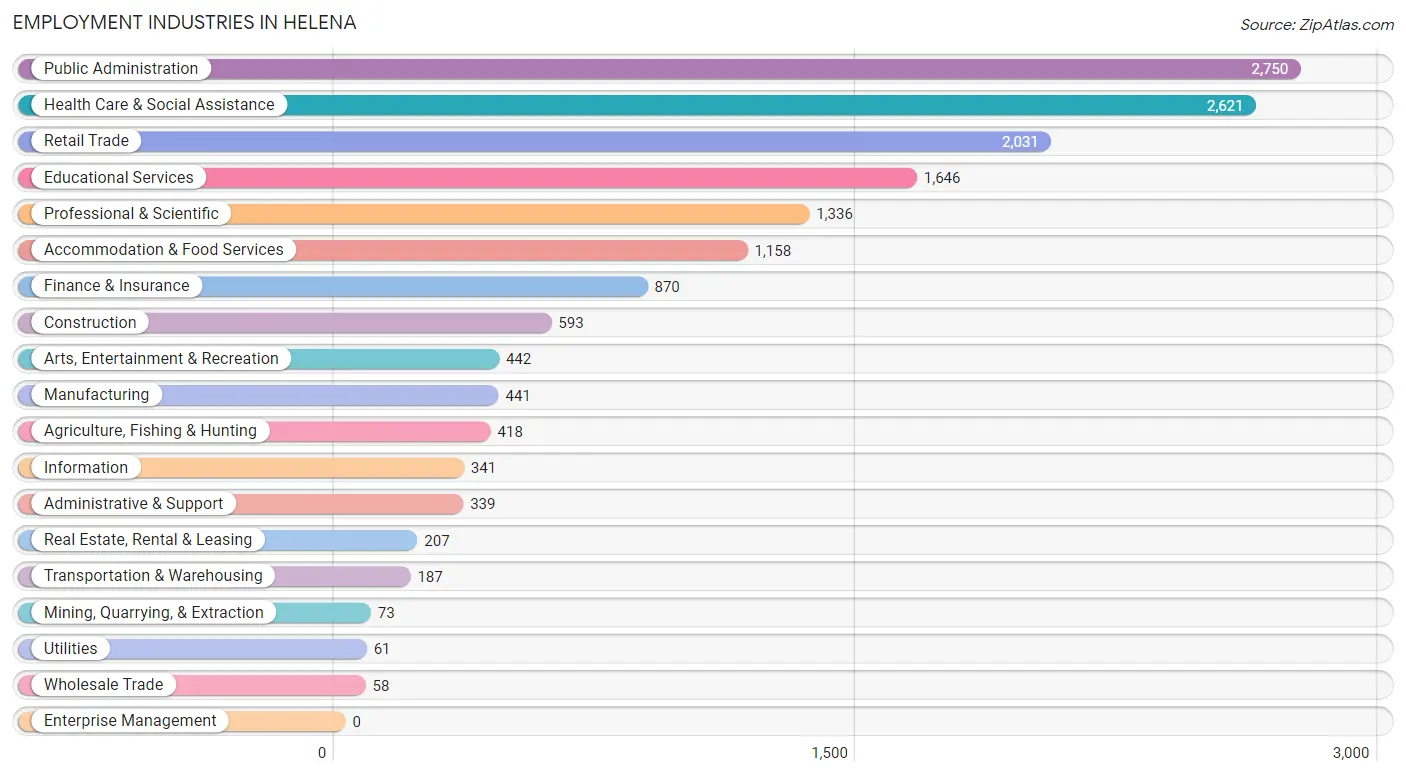
Employment Industries in Helena
The major employment industries in Helena include Public Administration (2,750 | 16.5%), Health Care & Social Assistance (2,621 | 15.7%), Retail Trade (2,031 | 12.2%), Educational Services (1,646 | 9.9%), and Professional & Scientific (1,336 | 8.0%).
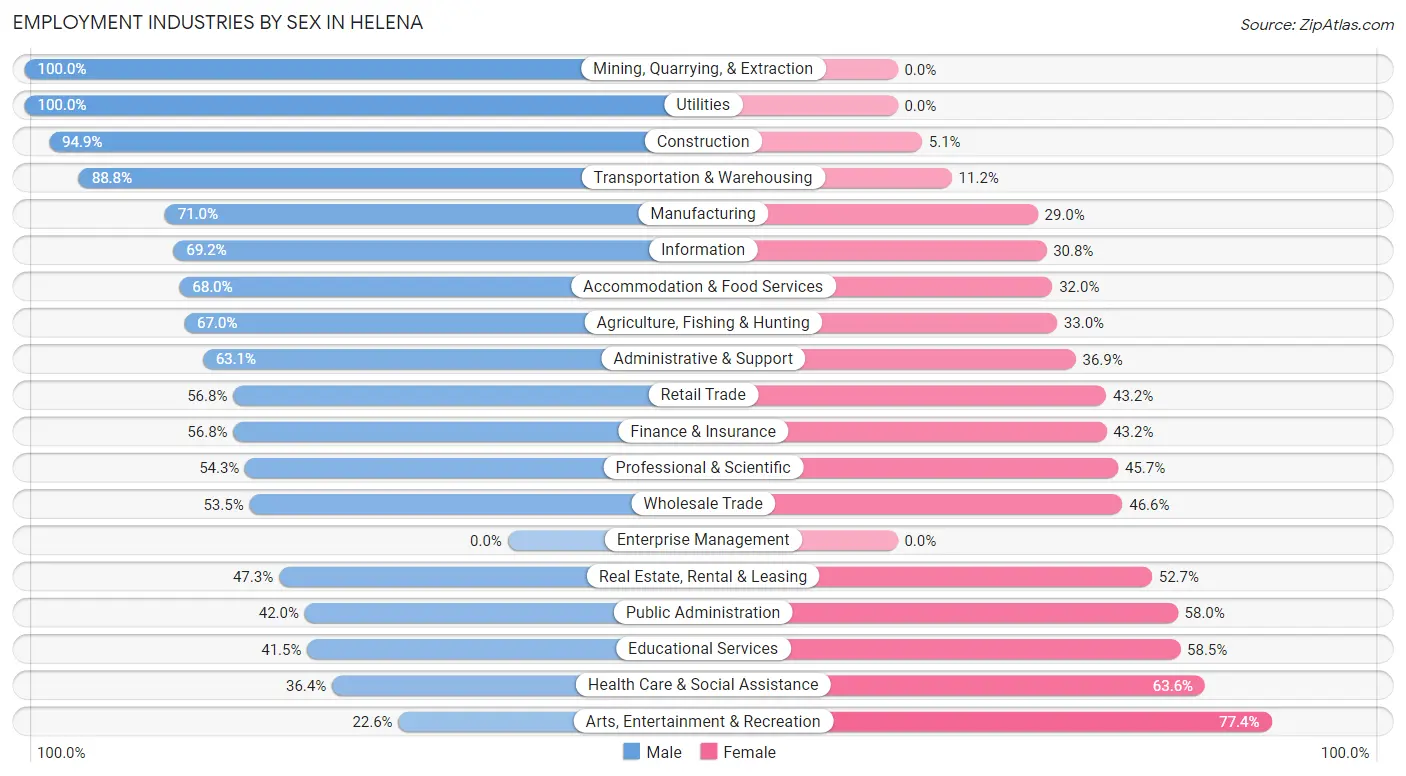
Employment Industries by Sex in Helena
The Helena industries that see more men than women are Mining, Quarrying, & Extraction (100.0%), Utilities (100.0%), and Construction (94.9%), whereas the industries that tend to have a higher number of women are Arts, Entertainment & Recreation (77.4%), Health Care & Social Assistance (63.6%), and Educational Services (58.5%).
| Industry | Male | Female |
| Agriculture, Fishing & Hunting | 280 (67.0%) | 138 (33.0%) |
| Mining, Quarrying, & Extraction | 73 (100.0%) | 0 (0.0%) |
| Construction | 563 (94.9%) | 30 (5.1%) |
| Manufacturing | 313 (71.0%) | 128 (29.0%) |
| Wholesale Trade | 31 (53.4%) | 27 (46.6%) |
| Retail Trade | 1,154 (56.8%) | 877 (43.2%) |
| Transportation & Warehousing | 166 (88.8%) | 21 (11.2%) |
| Utilities | 61 (100.0%) | 0 (0.0%) |
| Information | 236 (69.2%) | 105 (30.8%) |
| Finance & Insurance | 494 (56.8%) | 376 (43.2%) |
| Real Estate, Rental & Leasing | 98 (47.3%) | 109 (52.7%) |
| Professional & Scientific | 726 (54.3%) | 610 (45.7%) |
| Enterprise Management | 0 (0.0%) | 0 (0.0%) |
| Administrative & Support | 214 (63.1%) | 125 (36.9%) |
| Educational Services | 683 (41.5%) | 963 (58.5%) |
| Health Care & Social Assistance | 953 (36.4%) | 1,668 (63.6%) |
| Arts, Entertainment & Recreation | 100 (22.6%) | 342 (77.4%) |
| Accommodation & Food Services | 787 (68.0%) | 371 (32.0%) |
| Public Administration | 1,155 (42.0%) | 1,595 (58.0%) |
| Total | 8,549 (51.3%) | 8,125 (48.7%) |
Education in Helena
School Enrollment in Helena
The most common levels of schooling among the 6,840 students in Helena are college / undergraduate (1,680 | 24.6%), middle school (1,601 | 23.4%), and elementary school (1,240 | 18.1%).
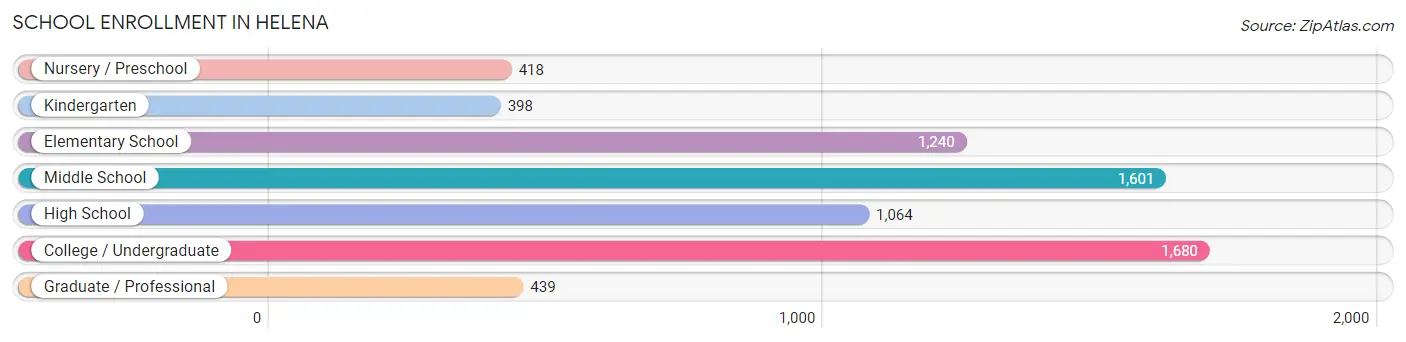
| School Level | # Students | % Students |
| Nursery / Preschool | 418 | 6.1% |
| Kindergarten | 398 | 5.8% |
| Elementary School | 1,240 | 18.1% |
| Middle School | 1,601 | 23.4% |
| High School | 1,064 | 15.6% |
| College / Undergraduate | 1,680 | 24.6% |
| Graduate / Professional | 439 | 6.4% |
| Total | 6,840 | 100.0% |
School Enrollment by Age by Funding Source in Helena
Out of a total of 6,840 students who are enrolled in schools in Helena, 1,778 (26.0%) attend a private institution, while the remaining 5,062 (74.0%) are enrolled in public schools. The age group of 18 to 19 year olds has the highest likelihood of being enrolled in private schools, with 471 (73.1% in the age bracket) enrolled. Conversely, the age group of 25 to 34 year olds has the lowest likelihood of being enrolled in a private school, with 214 (99.5% in the age bracket) attending a public institution.
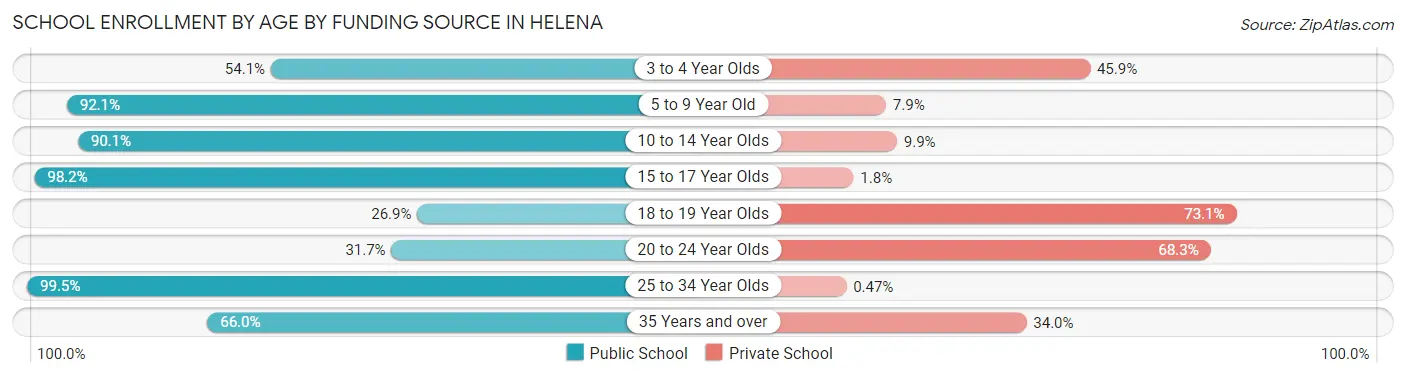
| Age Bracket | Public School | Private School |
| 3 to 4 Year Olds | 151 (54.1%) | 128 (45.9%) |
| 5 to 9 Year Old | 1,428 (92.1%) | 122 (7.9%) |
| 10 to 14 Year Olds | 1,745 (90.1%) | 192 (9.9%) |
| 15 to 17 Year Olds | 813 (98.2%) | 15 (1.8%) |
| 18 to 19 Year Olds | 173 (26.9%) | 471 (73.1%) |
| 20 to 24 Year Olds | 348 (31.7%) | 751 (68.3%) |
| 25 to 34 Year Olds | 214 (99.5%) | 1 (0.5%) |
| 35 Years and over | 190 (66.0%) | 98 (34.0%) |
| Total | 5,062 (74.0%) | 1,778 (26.0%) |
Educational Attainment by Field of Study in Helena
Business (1,855 | 14.3%), education (1,424 | 10.9%), literature & languages (1,257 | 9.7%), bio, nature & agricultural (1,235 | 9.5%), and social sciences (1,234 | 9.5%) are the most common fields of study among 13,011 individuals in Helena who have obtained a bachelor's degree or higher.
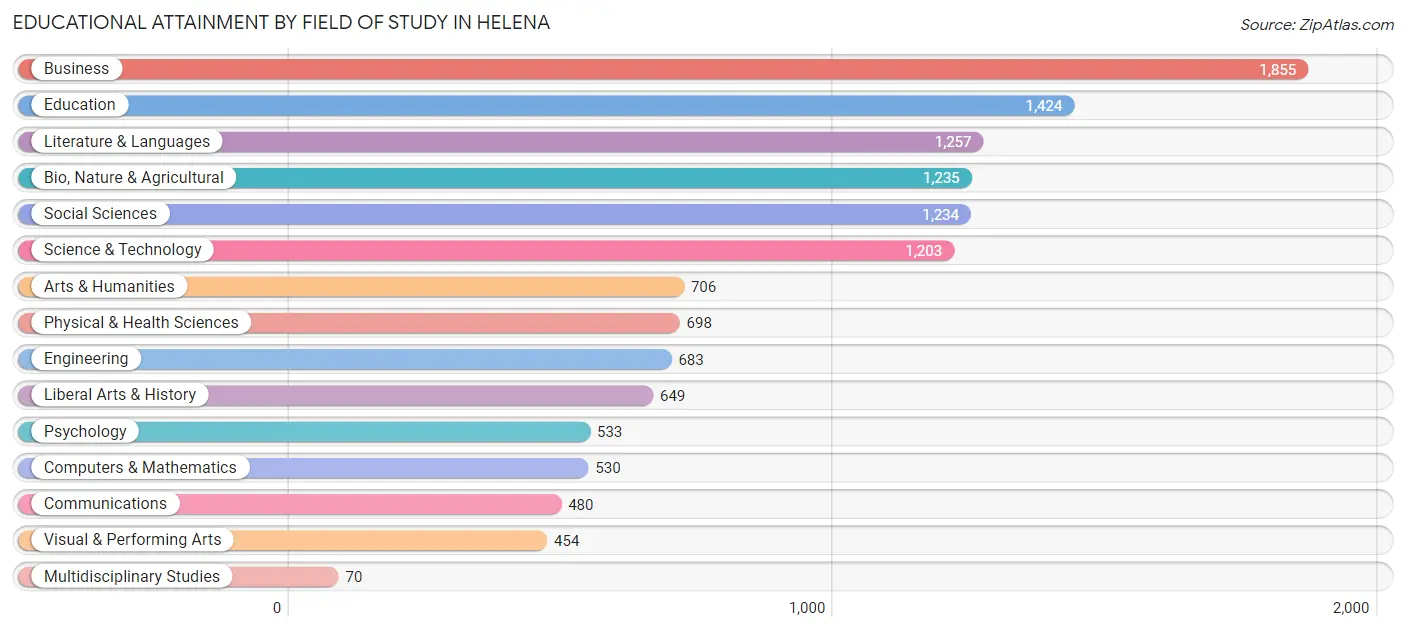
| Field of Study | # Graduates | % Graduates |
| Computers & Mathematics | 530 | 4.1% |
| Bio, Nature & Agricultural | 1,235 | 9.5% |
| Physical & Health Sciences | 698 | 5.4% |
| Psychology | 533 | 4.1% |
| Social Sciences | 1,234 | 9.5% |
| Engineering | 683 | 5.2% |
| Multidisciplinary Studies | 70 | 0.5% |
| Science & Technology | 1,203 | 9.2% |
| Business | 1,855 | 14.3% |
| Education | 1,424 | 10.9% |
| Literature & Languages | 1,257 | 9.7% |
| Liberal Arts & History | 649 | 5.0% |
| Visual & Performing Arts | 454 | 3.5% |
| Communications | 480 | 3.7% |
| Arts & Humanities | 706 | 5.4% |
| Total | 13,011 | 100.0% |
Transportation & Commute in Helena
Vehicle Availability by Sex in Helena
The most prevalent vehicle ownership categories in Helena are males with 2 vehicles (3,583, accounting for 42.6%) and females with 2 vehicles (3,163, making up 45.2%).
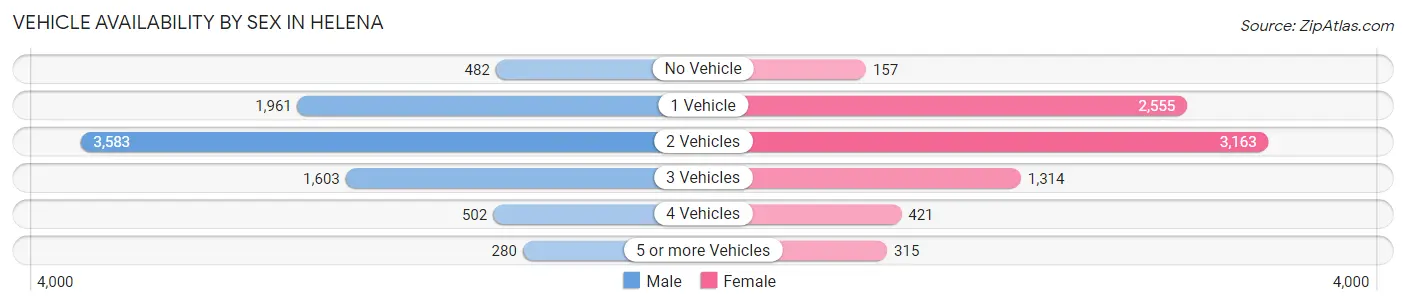
| Vehicles Available | Male | Female |
| No Vehicle | 482 (5.7%) | 157 (2.0%) |
| 1 Vehicle | 1,961 (23.3%) | 2,555 (32.2%) |
| 2 Vehicles | 3,583 (42.6%) | 3,163 (39.9%) |
| 3 Vehicles | 1,603 (19.1%) | 1,314 (16.6%) |
| 4 Vehicles | 502 (6.0%) | 421 (5.3%) |
| 5 or more Vehicles | 280 (3.3%) | 315 (4.0%) |
| Total | 8,411 (100.0%) | 7,925 (100.0%) |
Commute Time in Helena
The most frequently occuring commute durations in Helena are 10 to 14 minutes (4,153 commuters, 29.1%), 5 to 9 minutes (3,748 commuters, 26.3%), and 15 to 19 minutes (3,138 commuters, 22.0%).
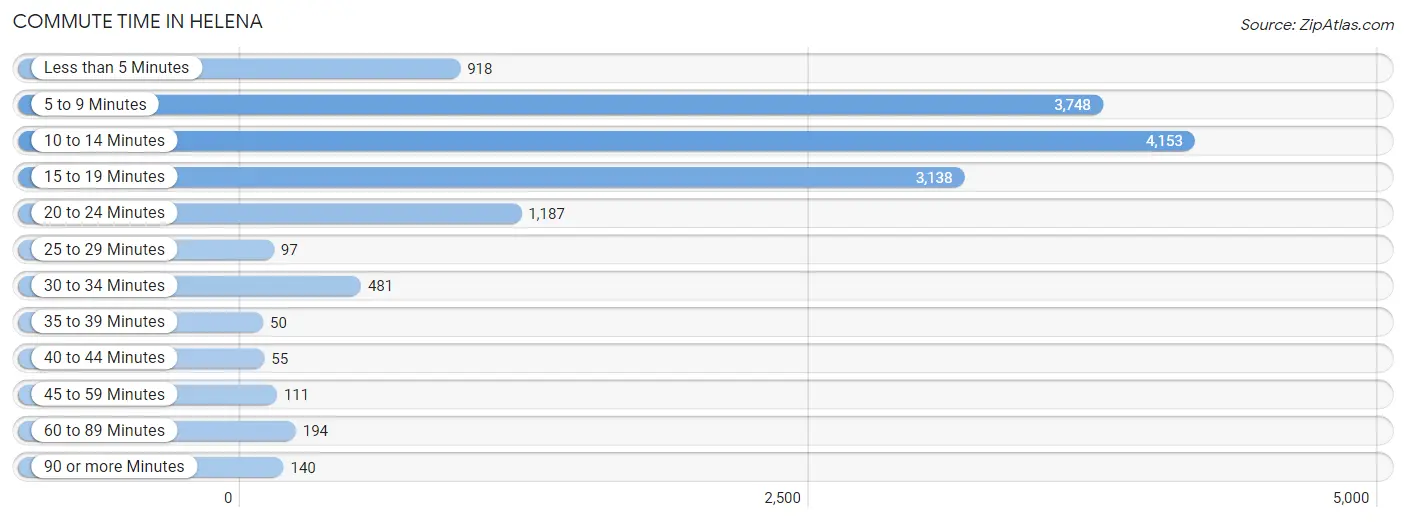
| Commute Time | # Commuters | % Commuters |
| Less than 5 Minutes | 918 | 6.4% |
| 5 to 9 Minutes | 3,748 | 26.3% |
| 10 to 14 Minutes | 4,153 | 29.1% |
| 15 to 19 Minutes | 3,138 | 22.0% |
| 20 to 24 Minutes | 1,187 | 8.3% |
| 25 to 29 Minutes | 97 | 0.7% |
| 30 to 34 Minutes | 481 | 3.4% |
| 35 to 39 Minutes | 50 | 0.4% |
| 40 to 44 Minutes | 55 | 0.4% |
| 45 to 59 Minutes | 111 | 0.8% |
| 60 to 89 Minutes | 194 | 1.4% |
| 90 or more Minutes | 140 | 1.0% |
Commute Time by Sex in Helena
The most common commute times in Helena are 10 to 14 minutes (2,027 commuters, 28.1%) for males and 10 to 14 minutes (2,126 commuters, 30.2%) for females.
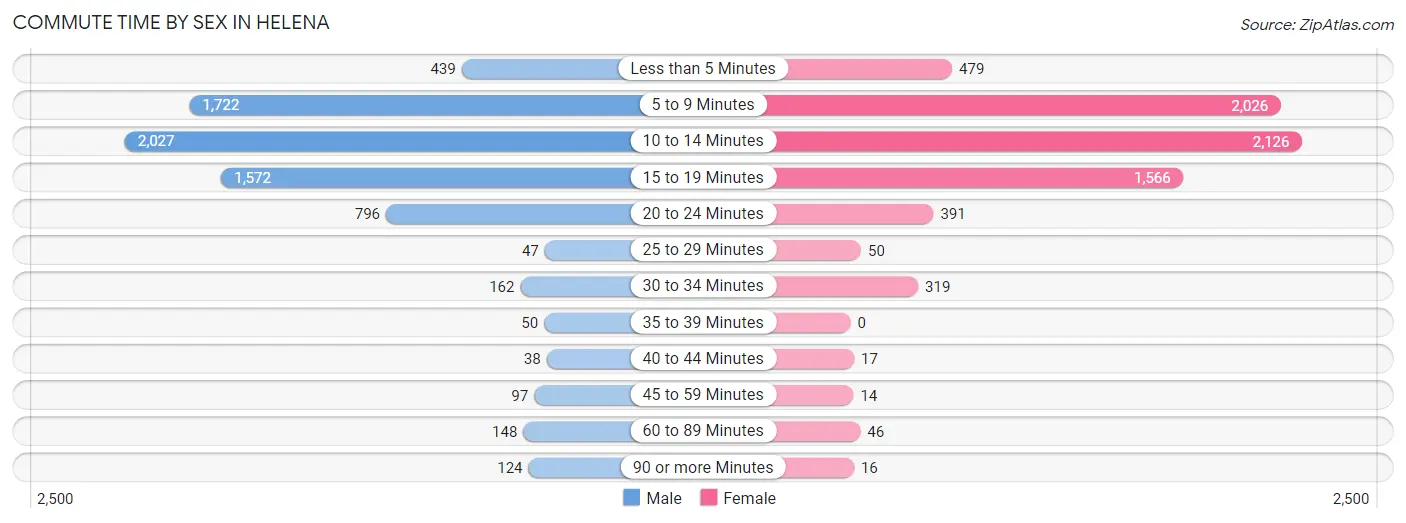
| Commute Time | Male | Female |
| Less than 5 Minutes | 439 (6.1%) | 479 (6.8%) |
| 5 to 9 Minutes | 1,722 (23.8%) | 2,026 (28.7%) |
| 10 to 14 Minutes | 2,027 (28.1%) | 2,126 (30.2%) |
| 15 to 19 Minutes | 1,572 (21.8%) | 1,566 (22.2%) |
| 20 to 24 Minutes | 796 (11.0%) | 391 (5.6%) |
| 25 to 29 Minutes | 47 (0.6%) | 50 (0.7%) |
| 30 to 34 Minutes | 162 (2.2%) | 319 (4.5%) |
| 35 to 39 Minutes | 50 (0.7%) | 0 (0.0%) |
| 40 to 44 Minutes | 38 (0.5%) | 17 (0.2%) |
| 45 to 59 Minutes | 97 (1.3%) | 14 (0.2%) |
| 60 to 89 Minutes | 148 (2.1%) | 46 (0.6%) |
| 90 or more Minutes | 124 (1.7%) | 16 (0.2%) |
Time of Departure to Work by Sex in Helena
The most frequent times of departure to work in Helena are 7:30 AM to 7:59 AM (1,867, 25.9%) for males and 7:30 AM to 7:59 AM (2,148, 30.5%) for females.
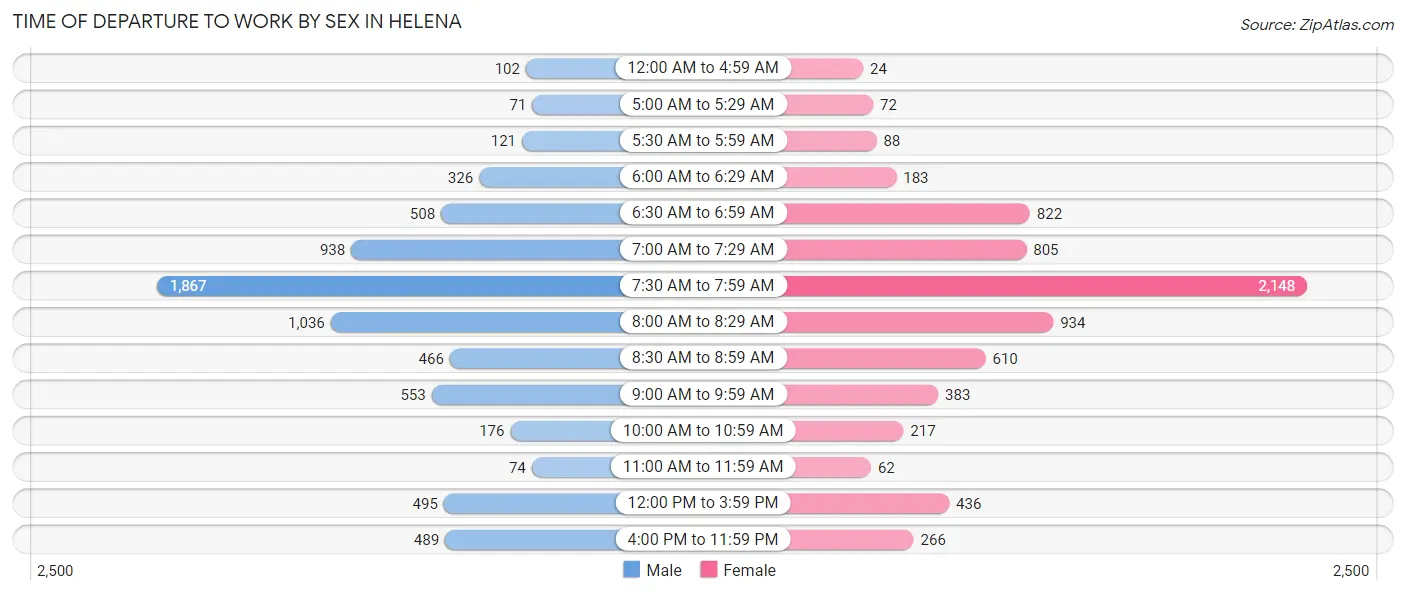
| Time of Departure | Male | Female |
| 12:00 AM to 4:59 AM | 102 (1.4%) | 24 (0.3%) |
| 5:00 AM to 5:29 AM | 71 (1.0%) | 72 (1.0%) |
| 5:30 AM to 5:59 AM | 121 (1.7%) | 88 (1.3%) |
| 6:00 AM to 6:29 AM | 326 (4.5%) | 183 (2.6%) |
| 6:30 AM to 6:59 AM | 508 (7.0%) | 822 (11.7%) |
| 7:00 AM to 7:29 AM | 938 (13.0%) | 805 (11.4%) |
| 7:30 AM to 7:59 AM | 1,867 (25.9%) | 2,148 (30.5%) |
| 8:00 AM to 8:29 AM | 1,036 (14.3%) | 934 (13.3%) |
| 8:30 AM to 8:59 AM | 466 (6.5%) | 610 (8.6%) |
| 9:00 AM to 9:59 AM | 553 (7.7%) | 383 (5.4%) |
| 10:00 AM to 10:59 AM | 176 (2.4%) | 217 (3.1%) |
| 11:00 AM to 11:59 AM | 74 (1.0%) | 62 (0.9%) |
| 12:00 PM to 3:59 PM | 495 (6.9%) | 436 (6.2%) |
| 4:00 PM to 11:59 PM | 489 (6.8%) | 266 (3.8%) |
| Total | 7,222 (100.0%) | 7,050 (100.0%) |
Housing Occupancy in Helena
Occupancy by Ownership in Helena
Of the total 15,233 dwellings in Helena, owner-occupied units account for 8,403 (55.2%), while renter-occupied units make up 6,830 (44.8%).
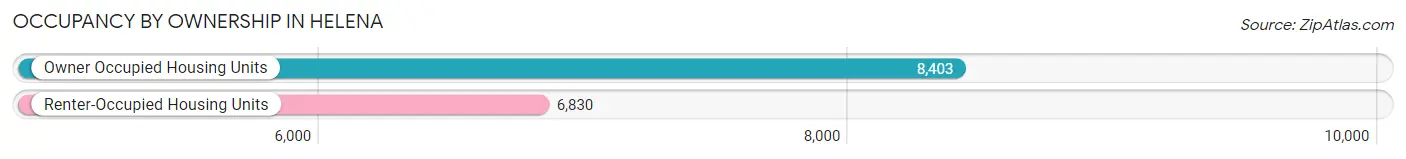
| Occupancy | # Housing Units | % Housing Units |
| Owner Occupied Housing Units | 8,403 | 55.2% |
| Renter-Occupied Housing Units | 6,830 | 44.8% |
| Total Occupied Housing Units | 15,233 | 100.0% |
Occupancy by Household Size in Helena
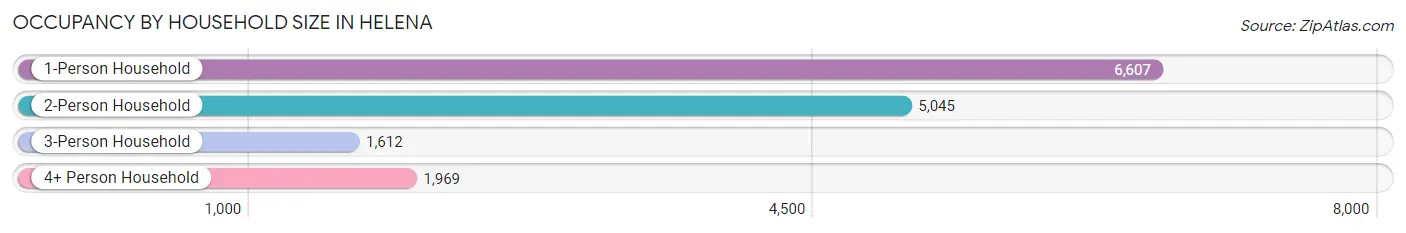
| Household Size | # Housing Units | % Housing Units |
| 1-Person Household | 6,607 | 43.4% |
| 2-Person Household | 5,045 | 33.1% |
| 3-Person Household | 1,612 | 10.6% |
| 4+ Person Household | 1,969 | 12.9% |
| Total Housing Units | 15,233 | 100.0% |
Occupancy by Ownership by Household Size in Helena
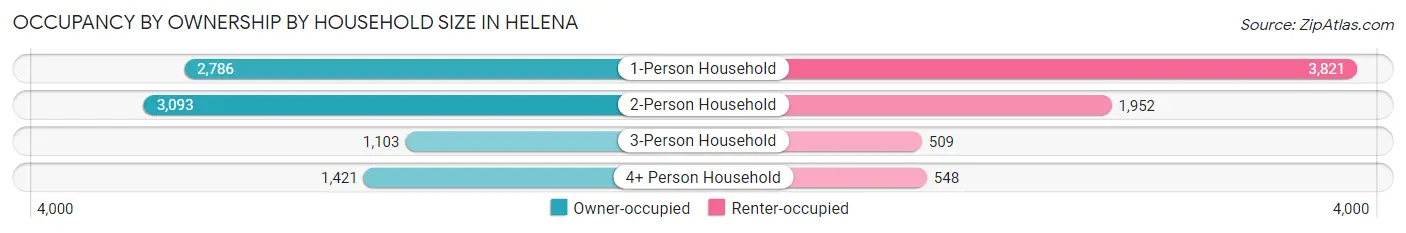
| Household Size | Owner-occupied | Renter-occupied |
| 1-Person Household | 2,786 (42.2%) | 3,821 (57.8%) |
| 2-Person Household | 3,093 (61.3%) | 1,952 (38.7%) |
| 3-Person Household | 1,103 (68.4%) | 509 (31.6%) |
| 4+ Person Household | 1,421 (72.2%) | 548 (27.8%) |
| Total Housing Units | 8,403 (55.2%) | 6,830 (44.8%) |
Occupancy by Educational Attainment in Helena
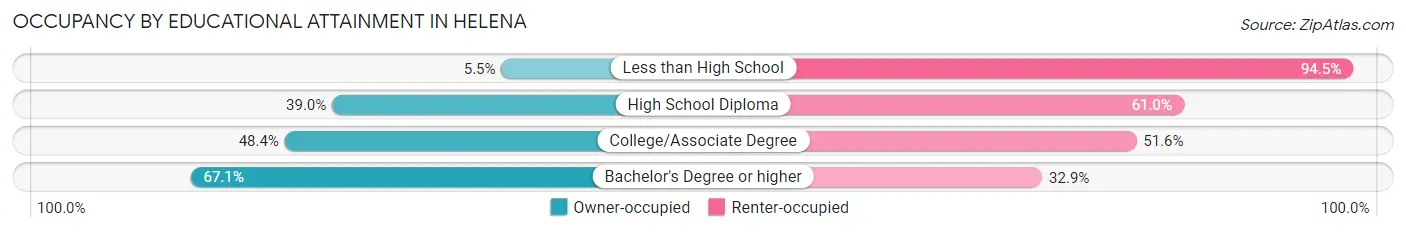
| Household Size | Owner-occupied | Renter-occupied |
| Less than High School | 31 (5.5%) | 536 (94.5%) |
| High School Diploma | 1,011 (39.0%) | 1,579 (61.0%) |
| College/Associate Degree | 1,922 (48.4%) | 2,047 (51.6%) |
| Bachelor's Degree or higher | 5,439 (67.1%) | 2,668 (32.9%) |
Occupancy by Age of Householder in Helena
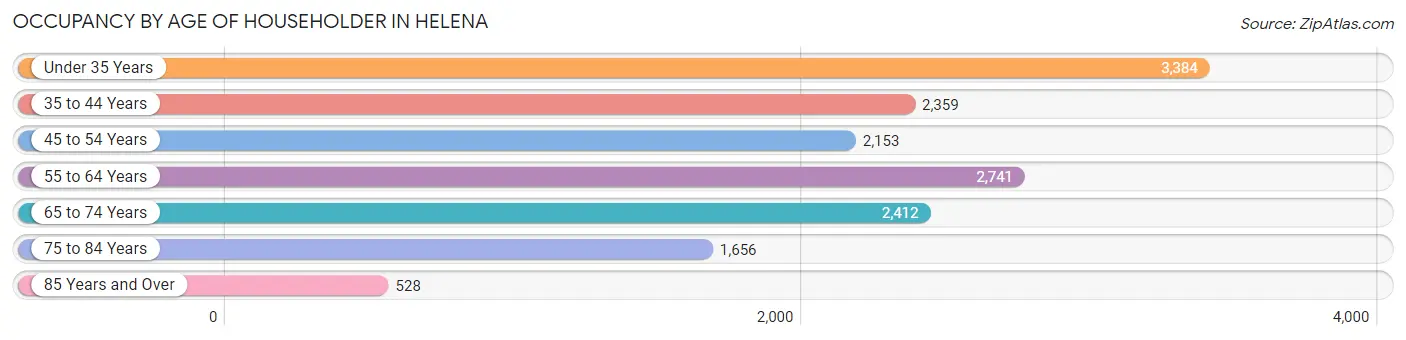
| Age Bracket | # Households | % Households |
| Under 35 Years | 3,384 | 22.2% |
| 35 to 44 Years | 2,359 | 15.5% |
| 45 to 54 Years | 2,153 | 14.1% |
| 55 to 64 Years | 2,741 | 18.0% |
| 65 to 74 Years | 2,412 | 15.8% |
| 75 to 84 Years | 1,656 | 10.9% |
| 85 Years and Over | 528 | 3.5% |
| Total | 15,233 | 100.0% |
Housing Finances in Helena
Median Income by Occupancy in Helena
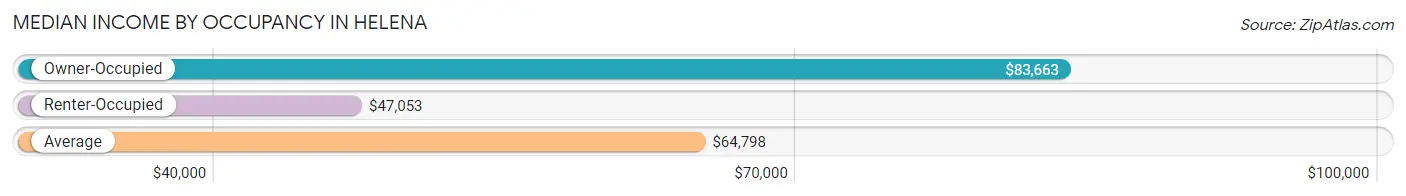
| Occupancy Type | # Households | Median Income |
| Owner-Occupied | 8,403 (55.2%) | $83,663 |
| Renter-Occupied | 6,830 (44.8%) | $47,053 |
| Average | 15,233 (100.0%) | $64,798 |
Occupancy by Householder Income Bracket in Helena
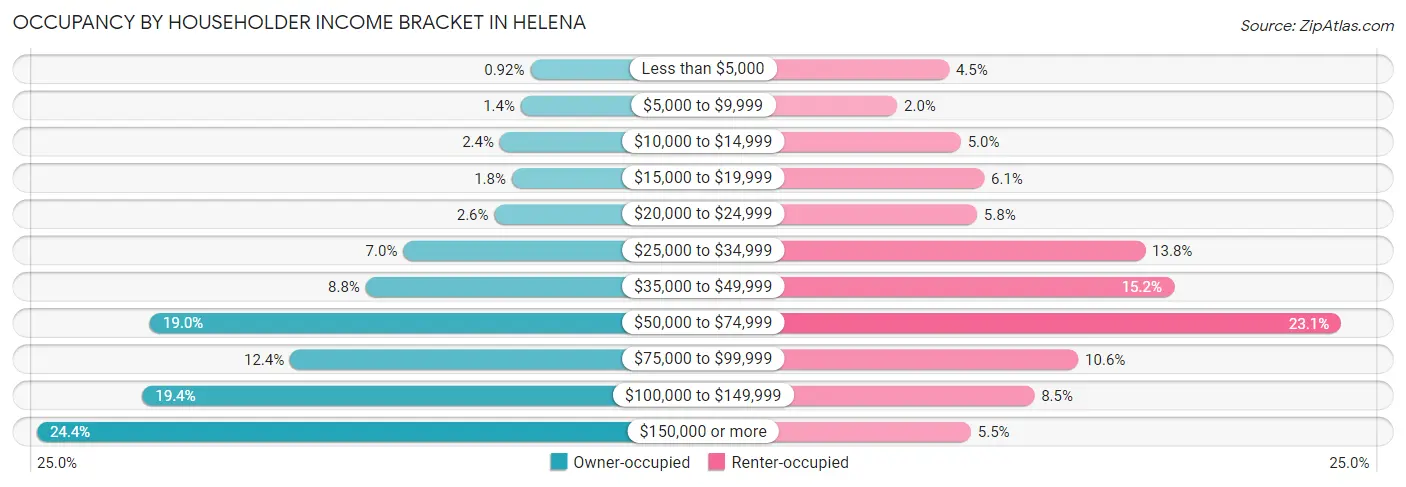
| Income Bracket | Owner-occupied | Renter-occupied |
| Less than $5,000 | 77 (0.9%) | 304 (4.4%) |
| $5,000 to $9,999 | 115 (1.4%) | 135 (2.0%) |
| $10,000 to $14,999 | 199 (2.4%) | 342 (5.0%) |
| $15,000 to $19,999 | 151 (1.8%) | 418 (6.1%) |
| $20,000 to $24,999 | 221 (2.6%) | 395 (5.8%) |
| $25,000 to $34,999 | 586 (7.0%) | 942 (13.8%) |
| $35,000 to $49,999 | 736 (8.8%) | 1,035 (15.1%) |
| $50,000 to $74,999 | 1,599 (19.0%) | 1,579 (23.1%) |
| $75,000 to $99,999 | 1,039 (12.4%) | 724 (10.6%) |
| $100,000 to $149,999 | 1,629 (19.4%) | 581 (8.5%) |
| $150,000 or more | 2,051 (24.4%) | 375 (5.5%) |
| Total | 8,403 (100.0%) | 6,830 (100.0%) |
Monthly Housing Cost Tiers in Helena
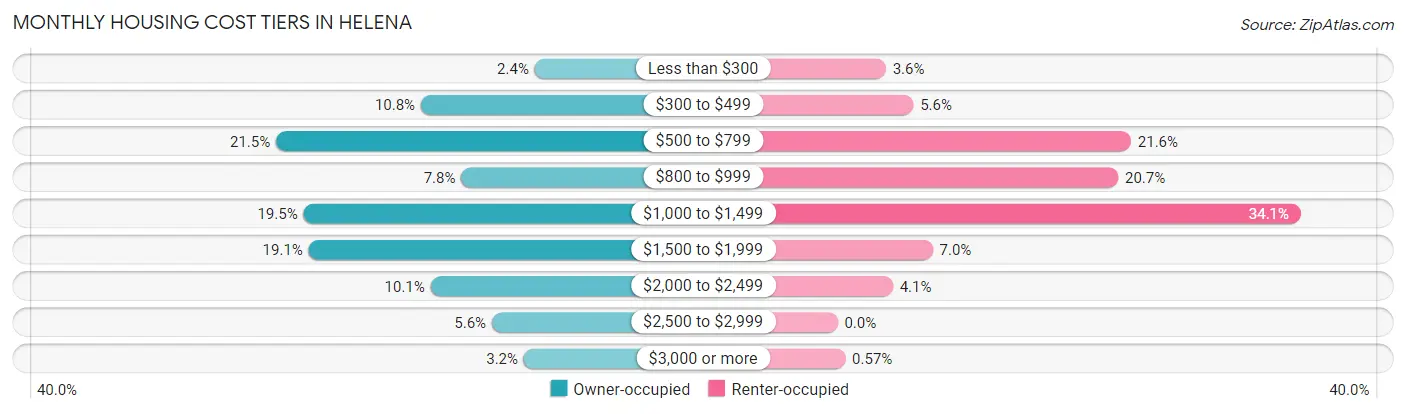
| Monthly Cost | Owner-occupied | Renter-occupied |
| Less than $300 | 204 (2.4%) | 243 (3.6%) |
| $300 to $499 | 908 (10.8%) | 381 (5.6%) |
| $500 to $799 | 1,805 (21.5%) | 1,476 (21.6%) |
| $800 to $999 | 659 (7.8%) | 1,412 (20.7%) |
| $1,000 to $1,499 | 1,635 (19.5%) | 2,331 (34.1%) |
| $1,500 to $1,999 | 1,603 (19.1%) | 479 (7.0%) |
| $2,000 to $2,499 | 849 (10.1%) | 278 (4.1%) |
| $2,500 to $2,999 | 469 (5.6%) | 0 (0.0%) |
| $3,000 or more | 271 (3.2%) | 39 (0.6%) |
| Total | 8,403 (100.0%) | 6,830 (100.0%) |
Physical Housing Characteristics in Helena
Housing Structures in Helena
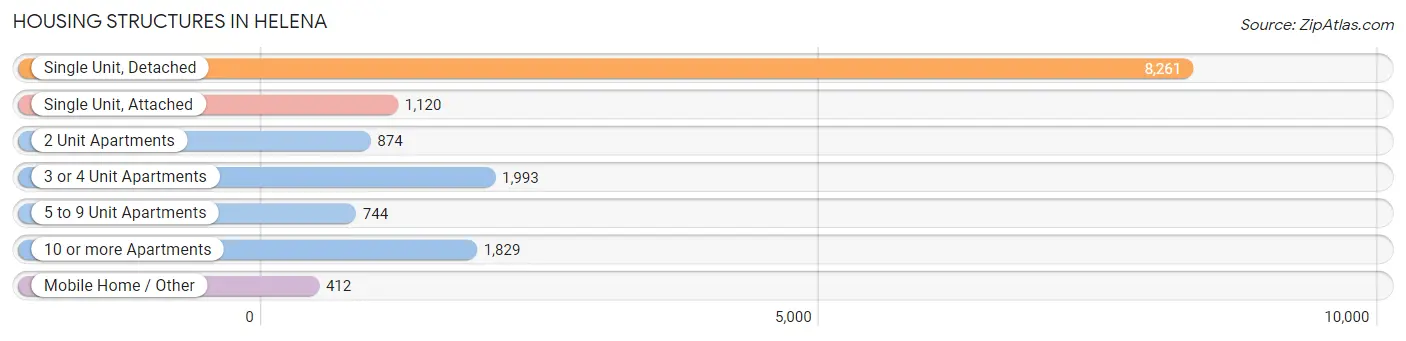
| Structure Type | # Housing Units | % Housing Units |
| Single Unit, Detached | 8,261 | 54.2% |
| Single Unit, Attached | 1,120 | 7.3% |
| 2 Unit Apartments | 874 | 5.7% |
| 3 or 4 Unit Apartments | 1,993 | 13.1% |
| 5 to 9 Unit Apartments | 744 | 4.9% |
| 10 or more Apartments | 1,829 | 12.0% |
| Mobile Home / Other | 412 | 2.7% |
| Total | 15,233 | 100.0% |
Housing Structures by Occupancy in Helena
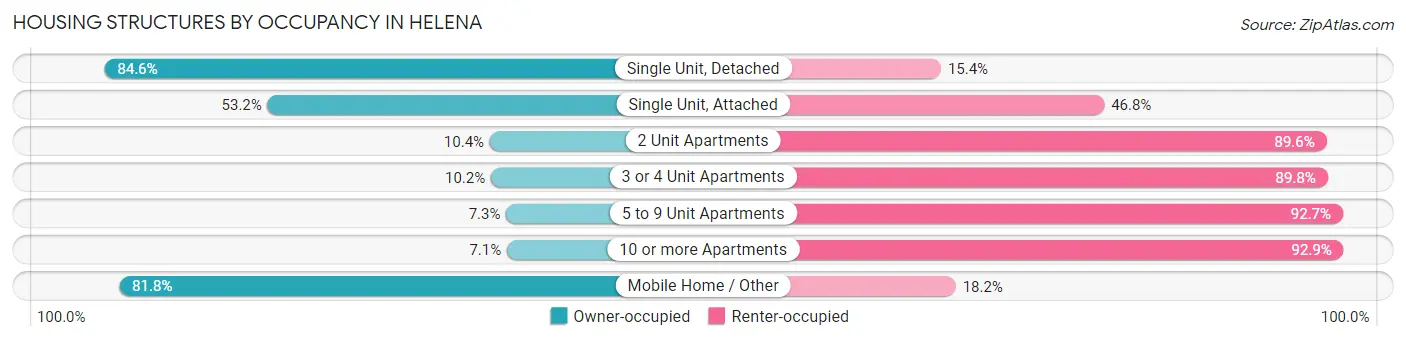
| Structure Type | Owner-occupied | Renter-occupied |
| Single Unit, Detached | 6,992 (84.6%) | 1,269 (15.4%) |
| Single Unit, Attached | 596 (53.2%) | 524 (46.8%) |
| 2 Unit Apartments | 91 (10.4%) | 783 (89.6%) |
| 3 or 4 Unit Apartments | 203 (10.2%) | 1,790 (89.8%) |
| 5 to 9 Unit Apartments | 54 (7.3%) | 690 (92.7%) |
| 10 or more Apartments | 130 (7.1%) | 1,699 (92.9%) |
| Mobile Home / Other | 337 (81.8%) | 75 (18.2%) |
| Total | 8,403 (55.2%) | 6,830 (44.8%) |
Housing Structures by Number of Rooms in Helena
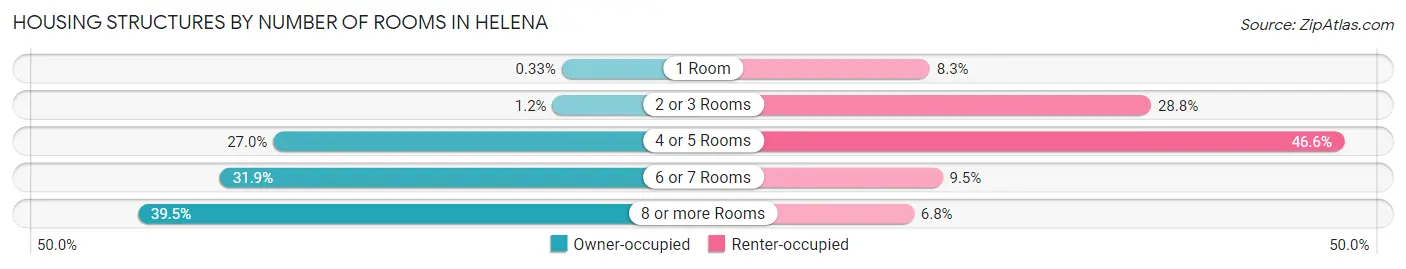
| Number of Rooms | Owner-occupied | Renter-occupied |
| 1 Room | 28 (0.3%) | 568 (8.3%) |
| 2 or 3 Rooms | 99 (1.2%) | 1,965 (28.8%) |
| 4 or 5 Rooms | 2,270 (27.0%) | 3,182 (46.6%) |
| 6 or 7 Rooms | 2,684 (31.9%) | 648 (9.5%) |
| 8 or more Rooms | 3,322 (39.5%) | 467 (6.8%) |
| Total | 8,403 (100.0%) | 6,830 (100.0%) |
Housing Structure by Heating Type in Helena
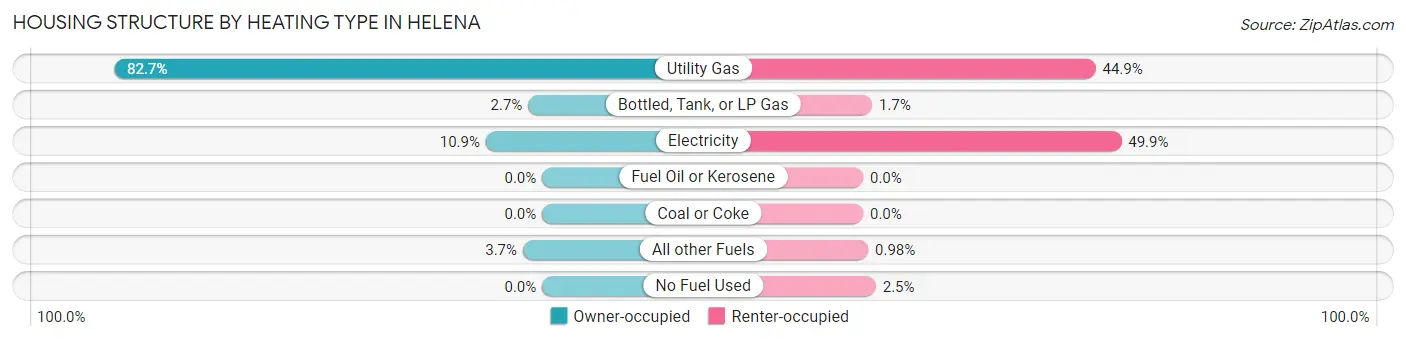
| Heating Type | Owner-occupied | Renter-occupied |
| Utility Gas | 6,950 (82.7%) | 3,069 (44.9%) |
| Bottled, Tank, or LP Gas | 226 (2.7%) | 118 (1.7%) |
| Electricity | 914 (10.9%) | 3,408 (49.9%) |
| Fuel Oil or Kerosene | 0 (0.0%) | 0 (0.0%) |
| Coal or Coke | 0 (0.0%) | 0 (0.0%) |
| All other Fuels | 313 (3.7%) | 67 (1.0%) |
| No Fuel Used | 0 (0.0%) | 168 (2.5%) |
| Total | 8,403 (100.0%) | 6,830 (100.0%) |
Household Vehicle Usage in Helena
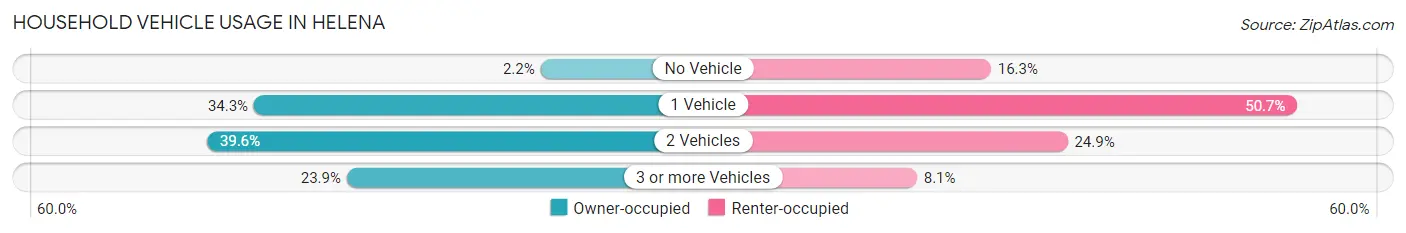
| Vehicles per Household | Owner-occupied | Renter-occupied |
| No Vehicle | 185 (2.2%) | 1,116 (16.3%) |
| 1 Vehicle | 2,883 (34.3%) | 3,461 (50.7%) |
| 2 Vehicles | 3,326 (39.6%) | 1,703 (24.9%) |
| 3 or more Vehicles | 2,009 (23.9%) | 550 (8.1%) |
| Total | 8,403 (100.0%) | 6,830 (100.0%) |
Real Estate & Mortgages in Helena
Real Estate and Mortgage Overview in Helena
| Characteristic | Without Mortgage | With Mortgage |
| Housing Units | 3,523 | 4,880 |
| Median Property Value | $308,600 | $342,800 |
| Median Household Income | $69,375 | $1,524 |
| Monthly Housing Costs | $605 | $271 |
| Real Estate Taxes | $3,144 | $81 |
Property Value by Mortgage Status in Helena
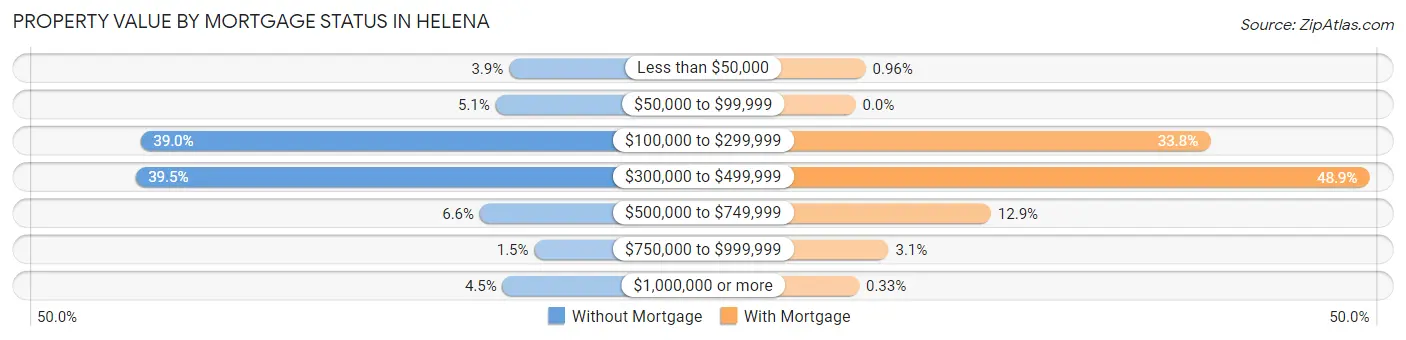
| Property Value | Without Mortgage | With Mortgage |
| Less than $50,000 | 136 (3.9%) | 47 (1.0%) |
| $50,000 to $99,999 | 181 (5.1%) | 0 (0.0%) |
| $100,000 to $299,999 | 1,373 (39.0%) | 1,647 (33.8%) |
| $300,000 to $499,999 | 1,390 (39.5%) | 2,388 (48.9%) |
| $500,000 to $749,999 | 234 (6.6%) | 629 (12.9%) |
| $750,000 to $999,999 | 51 (1.5%) | 153 (3.1%) |
| $1,000,000 or more | 158 (4.5%) | 16 (0.3%) |
| Total | 3,523 (100.0%) | 4,880 (100.0%) |
Household Income by Mortgage Status in Helena
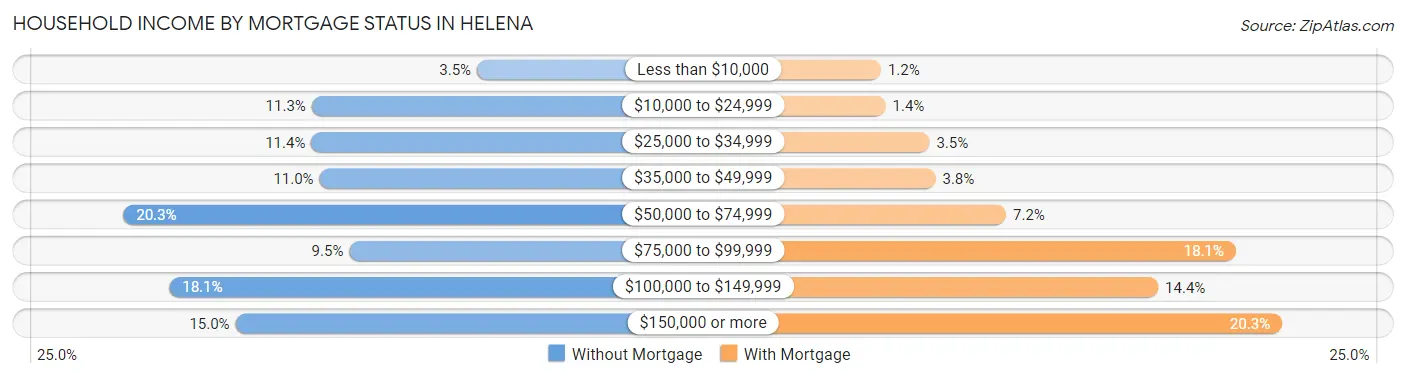
| Household Income | Without Mortgage | With Mortgage |
| Less than $10,000 | 122 (3.5%) | 59 (1.2%) |
| $10,000 to $24,999 | 399 (11.3%) | 70 (1.4%) |
| $25,000 to $34,999 | 400 (11.4%) | 172 (3.5%) |
| $35,000 to $49,999 | 386 (11.0%) | 186 (3.8%) |
| $50,000 to $74,999 | 715 (20.3%) | 350 (7.2%) |
| $75,000 to $99,999 | 336 (9.5%) | 884 (18.1%) |
| $100,000 to $149,999 | 638 (18.1%) | 703 (14.4%) |
| $150,000 or more | 527 (15.0%) | 991 (20.3%) |
| Total | 3,523 (100.0%) | 4,880 (100.0%) |
Property Value to Household Income Ratio in Helena
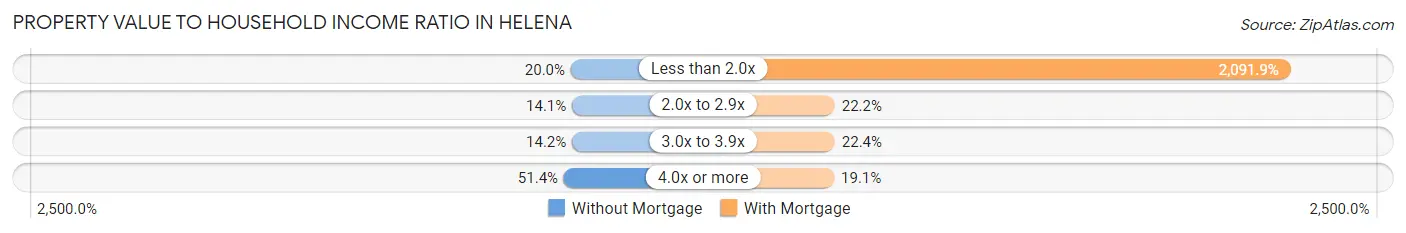
| Value-to-Income Ratio | Without Mortgage | With Mortgage |
| Less than 2.0x | 703 (20.0%) | 102,083 (2,091.9%) |
| 2.0x to 2.9x | 496 (14.1%) | 1,081 (22.2%) |
| 3.0x to 3.9x | 499 (14.2%) | 1,093 (22.4%) |
| 4.0x or more | 1,811 (51.4%) | 934 (19.1%) |
| Total | 3,523 (100.0%) | 4,880 (100.0%) |
Real Estate Taxes by Mortgage Status in Helena
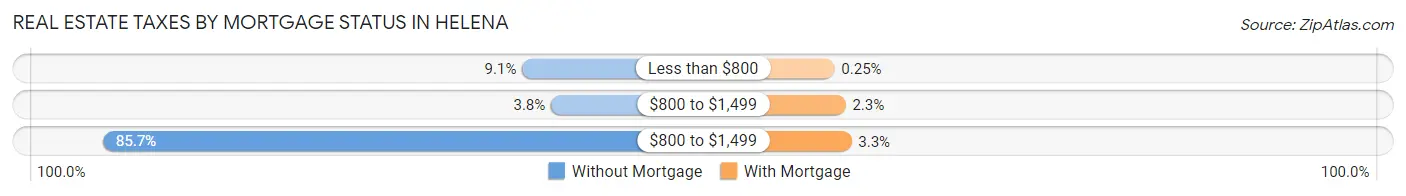
| Property Taxes | Without Mortgage | With Mortgage |
| Less than $800 | 321 (9.1%) | 12 (0.3%) |
| $800 to $1,499 | 135 (3.8%) | 111 (2.3%) |
| $800 to $1,499 | 3,019 (85.7%) | 163 (3.3%) |
| Total | 3,523 (100.0%) | 4,880 (100.0%) |
Health & Disability in Helena
Health Insurance Coverage by Age in Helena
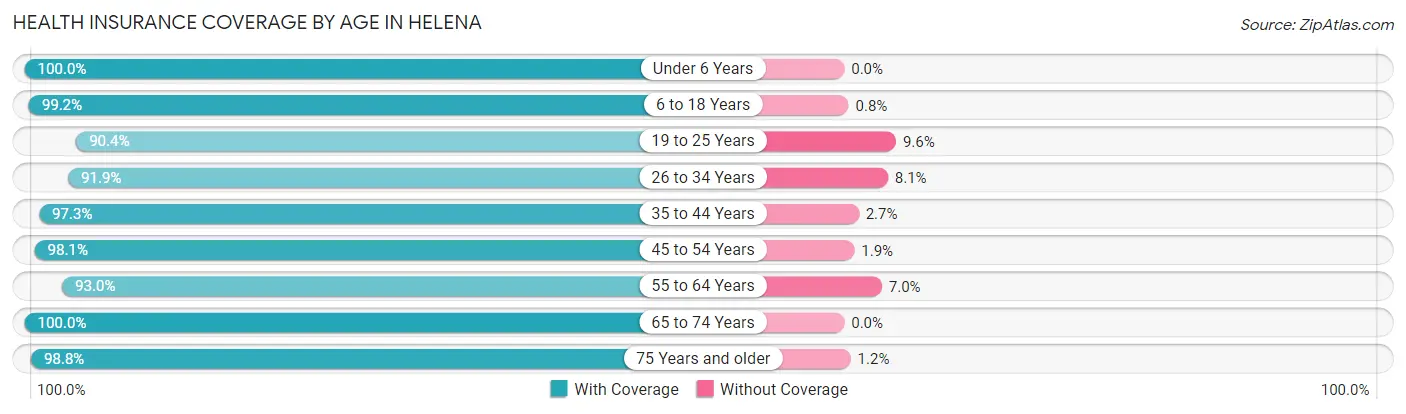
| Age Bracket | With Coverage | Without Coverage |
| Under 6 Years | 1,902 (100.0%) | 0 (0.0%) |
| 6 to 18 Years | 4,609 (99.2%) | 37 (0.8%) |
| 19 to 25 Years | 2,798 (90.4%) | 298 (9.6%) |
| 26 to 34 Years | 3,746 (91.9%) | 331 (8.1%) |
| 35 to 44 Years | 4,017 (97.3%) | 111 (2.7%) |
| 45 to 54 Years | 3,366 (98.1%) | 64 (1.9%) |
| 55 to 64 Years | 3,785 (93.0%) | 285 (7.0%) |
| 65 to 74 Years | 3,701 (100.0%) | 0 (0.0%) |
| 75 Years and older | 2,822 (98.8%) | 34 (1.2%) |
| Total | 30,746 (96.4%) | 1,160 (3.6%) |
Health Insurance Coverage by Citizenship Status in Helena
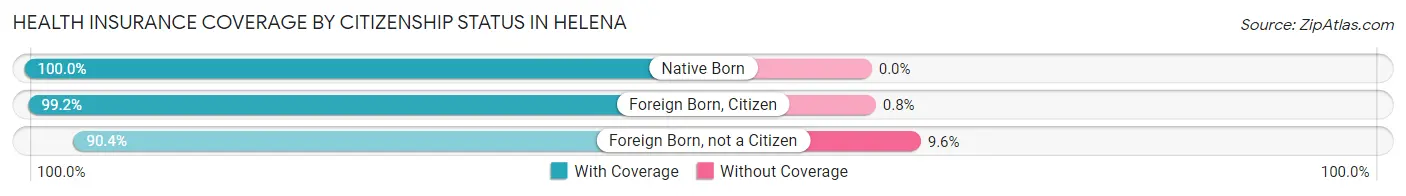
| Citizenship Status | With Coverage | Without Coverage |
| Native Born | 1,902 (100.0%) | 0 (0.0%) |
| Foreign Born, Citizen | 4,609 (99.2%) | 37 (0.8%) |
| Foreign Born, not a Citizen | 2,798 (90.4%) | 298 (9.6%) |
Health Insurance Coverage by Household Income in Helena
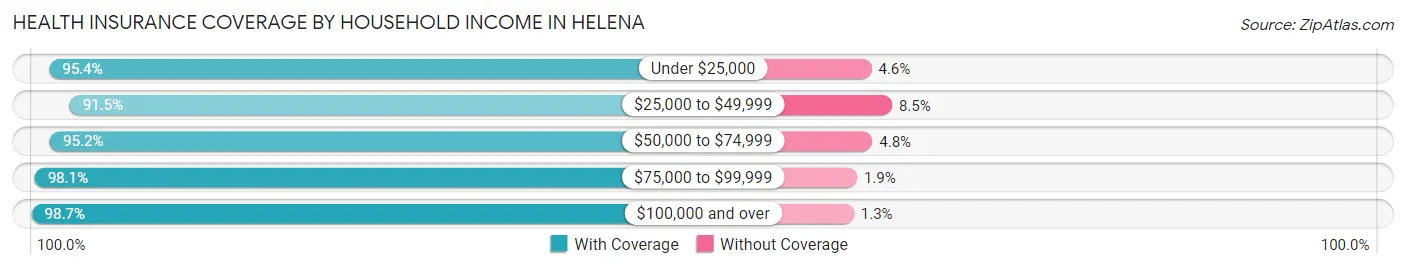
| Household Income | With Coverage | Without Coverage |
| Under $25,000 | 3,191 (95.4%) | 155 (4.6%) |
| $25,000 to $49,999 | 4,774 (91.5%) | 442 (8.5%) |
| $50,000 to $74,999 | 5,987 (95.2%) | 301 (4.8%) |
| $75,000 to $99,999 | 4,065 (98.1%) | 79 (1.9%) |
| $100,000 and over | 11,806 (98.7%) | 158 (1.3%) |
Public vs Private Health Insurance Coverage by Age in Helena
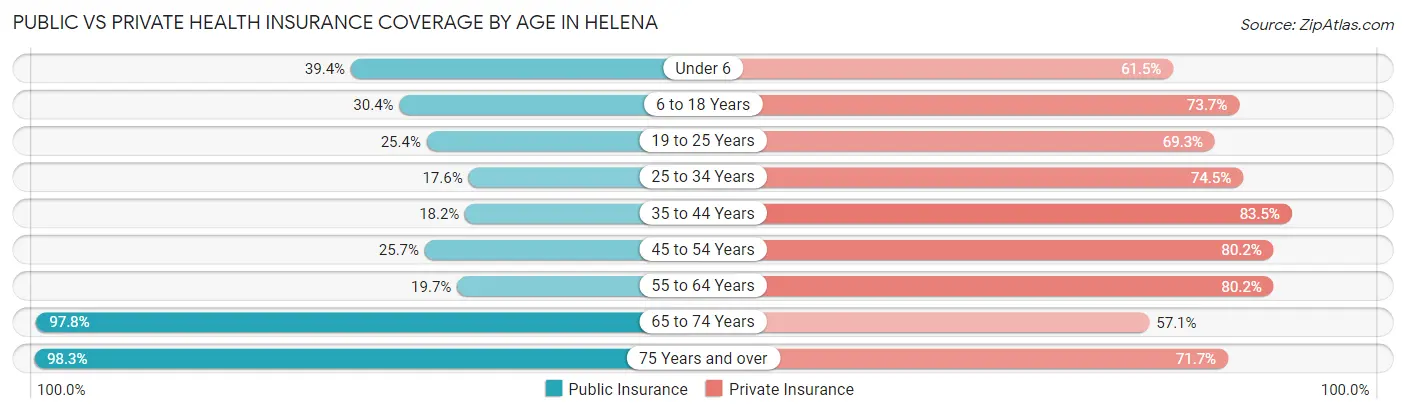
| Age Bracket | Public Insurance | Private Insurance |
| Under 6 | 750 (39.4%) | 1,170 (61.5%) |
| 6 to 18 Years | 1,414 (30.4%) | 3,426 (73.7%) |
| 19 to 25 Years | 785 (25.4%) | 2,144 (69.3%) |
| 25 to 34 Years | 718 (17.6%) | 3,036 (74.5%) |
| 35 to 44 Years | 752 (18.2%) | 3,447 (83.5%) |
| 45 to 54 Years | 882 (25.7%) | 2,749 (80.1%) |
| 55 to 64 Years | 802 (19.7%) | 3,262 (80.1%) |
| 65 to 74 Years | 3,620 (97.8%) | 2,113 (57.1%) |
| 75 Years and over | 2,806 (98.3%) | 2,047 (71.7%) |
| Total | 12,529 (39.3%) | 23,394 (73.3%) |
Disability Status by Sex by Age in Helena
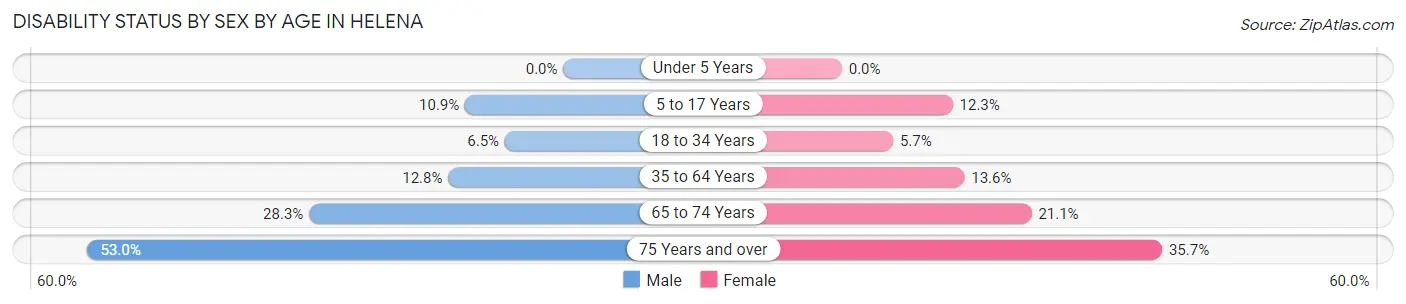
| Age Bracket | Male | Female |
| Under 5 Years | 0 (0.0%) | 0 (0.0%) |
| 5 to 17 Years | 240 (10.9%) | 272 (12.3%) |
| 18 to 34 Years | 245 (6.5%) | 225 (5.7%) |
| 35 to 64 Years | 719 (12.8%) | 821 (13.6%) |
| 65 to 74 Years | 486 (28.3%) | 419 (21.1%) |
| 75 Years and over | 549 (53.0%) | 649 (35.7%) |
Disability Class by Sex by Age in Helena
Disability Class: Hearing Difficulty
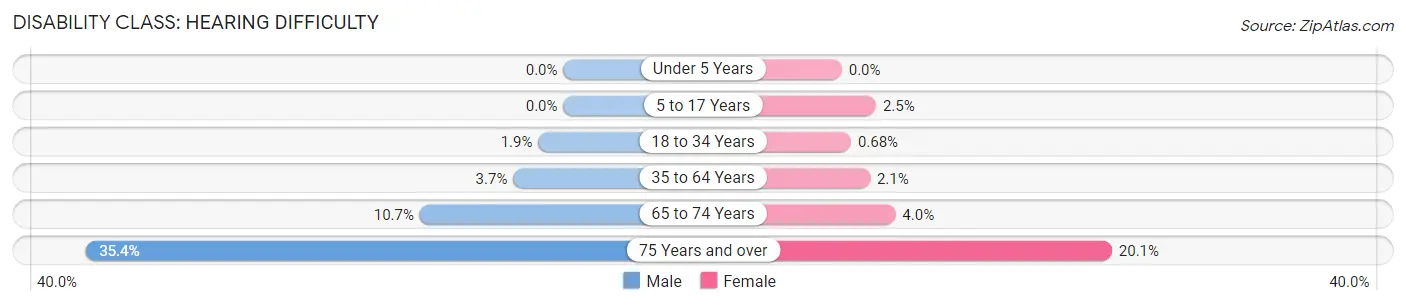
| Age Bracket | Male | Female |
| Under 5 Years | 0 (0.0%) | 0 (0.0%) |
| 5 to 17 Years | 0 (0.0%) | 56 (2.5%) |
| 18 to 34 Years | 70 (1.9%) | 27 (0.7%) |
| 35 to 64 Years | 209 (3.7%) | 126 (2.1%) |
| 65 to 74 Years | 183 (10.7%) | 79 (4.0%) |
| 75 Years and over | 367 (35.4%) | 365 (20.1%) |
Disability Class: Vision Difficulty
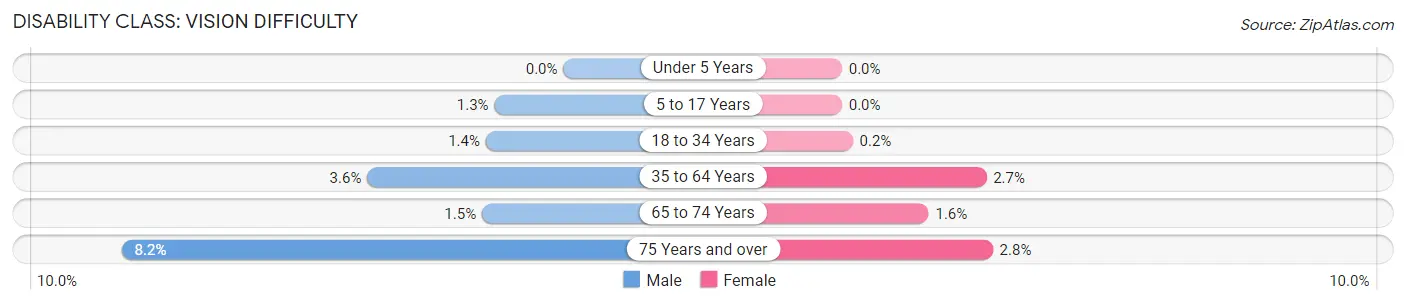
| Age Bracket | Male | Female |
| Under 5 Years | 0 (0.0%) | 0 (0.0%) |
| 5 to 17 Years | 28 (1.3%) | 0 (0.0%) |
| 18 to 34 Years | 54 (1.4%) | 8 (0.2%) |
| 35 to 64 Years | 204 (3.6%) | 161 (2.7%) |
| 65 to 74 Years | 26 (1.5%) | 32 (1.6%) |
| 75 Years and over | 85 (8.2%) | 51 (2.8%) |
Disability Class: Cognitive Difficulty
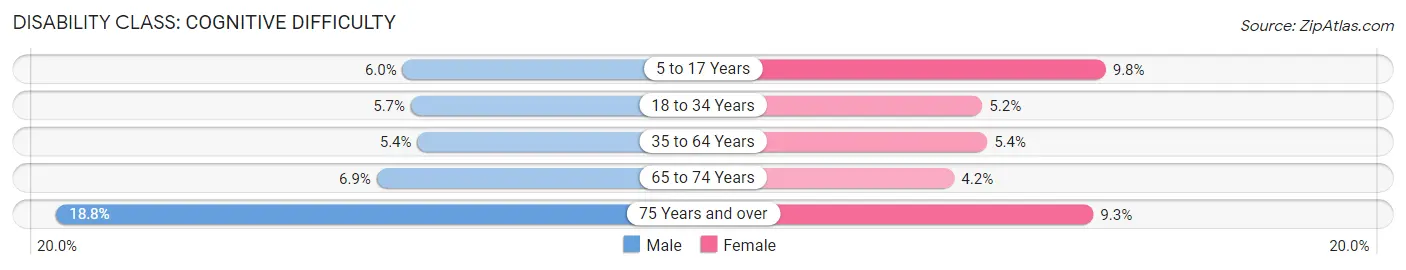
| Age Bracket | Male | Female |
| 5 to 17 Years | 131 (6.0%) | 216 (9.8%) |
| 18 to 34 Years | 213 (5.7%) | 206 (5.2%) |
| 35 to 64 Years | 304 (5.4%) | 325 (5.4%) |
| 65 to 74 Years | 119 (6.9%) | 83 (4.2%) |
| 75 Years and over | 195 (18.8%) | 170 (9.3%) |
Disability Class: Ambulatory Difficulty
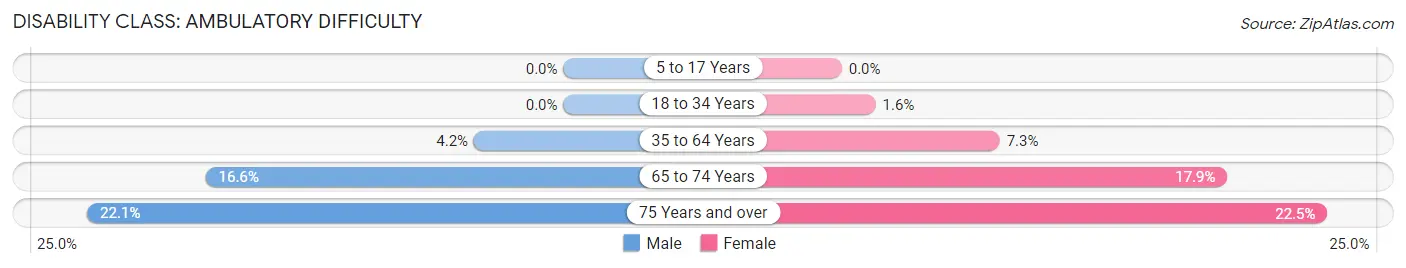
| Age Bracket | Male | Female |
| 5 to 17 Years | 0 (0.0%) | 0 (0.0%) |
| 18 to 34 Years | 0 (0.0%) | 62 (1.6%) |
| 35 to 64 Years | 233 (4.2%) | 441 (7.3%) |
| 65 to 74 Years | 285 (16.6%) | 355 (17.9%) |
| 75 Years and over | 229 (22.1%) | 410 (22.5%) |
Disability Class: Self-Care Difficulty
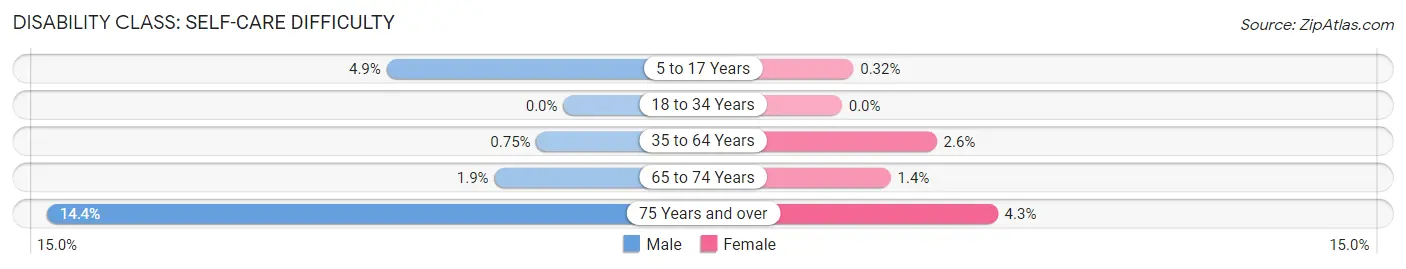
| Age Bracket | Male | Female |
| 5 to 17 Years | 108 (4.9%) | 7 (0.3%) |
| 18 to 34 Years | 0 (0.0%) | 0 (0.0%) |
| 35 to 64 Years | 42 (0.7%) | 159 (2.6%) |
| 65 to 74 Years | 33 (1.9%) | 27 (1.4%) |
| 75 Years and over | 149 (14.4%) | 79 (4.3%) |
Technology Access in Helena
Computing Device Access in Helena
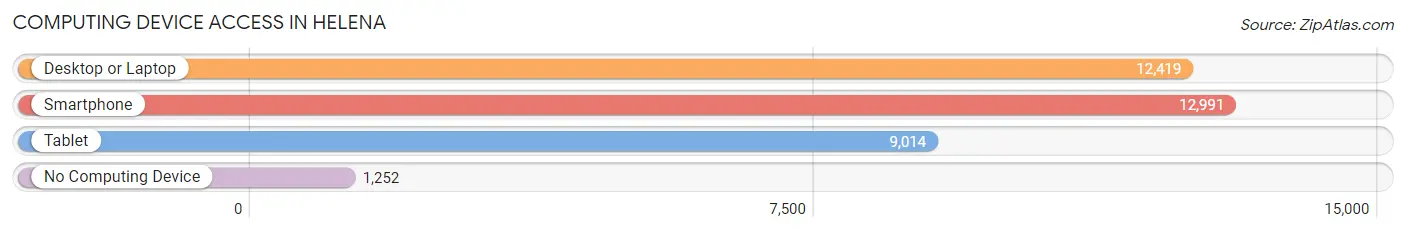
| Device Type | # Households | % Households |
| Desktop or Laptop | 12,419 | 81.5% |
| Smartphone | 12,991 | 85.3% |
| Tablet | 9,014 | 59.2% |
| No Computing Device | 1,252 | 8.2% |
| Total | 15,233 | 100.0% |
Internet Access in Helena
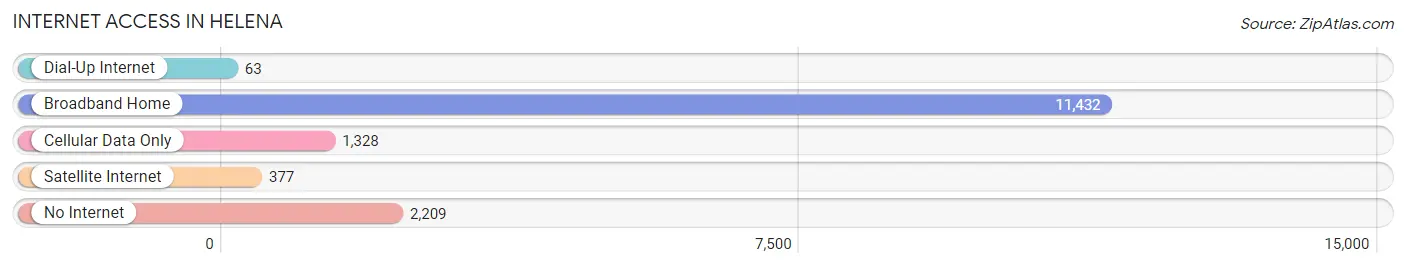
| Internet Type | # Households | % Households |
| Dial-Up Internet | 63 | 0.4% |
| Broadband Home | 11,432 | 75.0% |
| Cellular Data Only | 1,328 | 8.7% |
| Satellite Internet | 377 | 2.5% |
| No Internet | 2,209 | 14.5% |
| Total | 15,233 | 100.0% |
Helena Summary
Helena, Montana is the state capital of Montana and is located in the western part of the state. It is the county seat of Lewis and Clark County and is situated in the Helena Valley between the Big Belt and Elkhorn Mountains. Helena is the principal city of the Helena Micropolitan Statistical Area, which includes all of Lewis and Clark and Jefferson counties. The population of Helena was 28,190 at the 2010 census, making it the fifth largest city in Montana.
History
The area around Helena has been inhabited for thousands of years by various Native American tribes, including the Salish, Blackfeet, and Crow. The first European settlers arrived in the area in the early 1860s, and the city of Helena was founded in 1864. The city was named after the wife of the first mayor, John Cowan.
The city quickly grew and became an important center for mining and commerce. Gold was discovered in Last Chance Gulch in 1864, and the city soon became a major gold mining center. Helena was also an important center for the fur trade, and the city was home to several fur trading posts.
In 1875, Helena became the capital of Montana Territory, and in 1889, it became the capital of the newly formed state of Montana. The city continued to grow and prosper, and by the early 20th century, it had become an important center for banking, finance, and government.
Geography
Helena is located in the western part of Montana, in the Helena Valley between the Big Belt and Elkhorn Mountains. The city is situated at an elevation of 3,845 feet (1,172 m). The city covers an area of 11.2 square miles (29 km2).
The city is located along Interstate 15, which connects Helena to other major cities in Montana, such as Missoula and Great Falls. The city is also served by the Helena Regional Airport.
Economy
Helena’s economy is largely based on government, healthcare, and education. The city is home to the Montana State Capitol, the Montana Supreme Court, and the Montana State University-Helena College of Technology.
The city is also home to several major healthcare providers, including St. Peter’s Hospital and the Helena Regional Medical Center. The city is also home to several major employers, such as the Montana Department of Transportation, the Montana Department of Corrections, and the Montana Department of Public Health and Human Services.
Demographics
As of the 2010 census, the population of Helena was 28,190. The racial makeup of the city was 91.2% White, 2.3% Native American, 1.2% Asian, 0.7% African American, 0.2% Pacific Islander, and 4.4% from other races. The median household income was $41,945, and the median family income was $50,919.
The city is home to several religious denominations, including Roman Catholic, Lutheran, Methodist, and Baptist. The city is also home to several cultural institutions, such as the Montana Historical Society, the Montana Museum of Art and Culture, and the Holter Museum of Art.
Conclusion
Helena, Montana is the state capital of Montana and is located in the western part of the state. It is the county seat of Lewis and Clark County and is situated in the Helena Valley between the Big Belt and Elkhorn Mountains. The city has a rich history, and it has been an important center for mining, commerce, banking, finance, and government. The city’s economy is largely based on government, healthcare, and education, and the population of Helena was 28,190 at the 2010 census. The city is home to several religious denominations and cultural institutions, and it is served by the Helena Regional Airport.
Common Questions
What is Per Capita Income in Helena?
Per Capita income in Helena is $43,016.
What is the Median Family Income in Helena?
Median Family Income in Helena is $90,522.
What is the Median Household income in Helena?
Median Household Income in Helena is $64,798.
What is Income or Wage Gap in Helena?
Income or Wage Gap in Helena is 23.0%.
Women in Helena earn 77.0 cents for every dollar earned by a man.
What is Family Income Deficit in Helena?
Family Income Deficit in Helena is $8,857.
Families that are below poverty line in Helena earn $8,857 less on average than the poverty threshold level.
What is Inequality or Gini Index in Helena?
Inequality or Gini Index in Helena is 0.46.
What is the Total Population of Helena?
Total Population of Helena is 32,529.
What is the Total Male Population of Helena?
Total Male Population of Helena is 15,474.
What is the Total Female Population of Helena?
Total Female Population of Helena is 17,055.
What is the Ratio of Males per 100 Females in Helena?
There are 90.73 Males per 100 Females in Helena.
What is the Ratio of Females per 100 Males in Helena?
There are 110.22 Females per 100 Males in Helena.
What is the Median Population Age in Helena?
Median Population Age in Helena is 39.9 Years.
What is the Average Family Size in Helena
Average Family Size in Helena is 2.8 People.
What is the Average Household Size in Helena
Average Household Size in Helena is 2.0 People.
How Large is the Labor Force in Helena?
There are 17,345 People in the Labor Forcein in Helena.
What is the Percentage of People in the Labor Force in Helena?
64.3% of People are in the Labor Force in Helena.
What is the Unemployment Rate in Helena?
Unemployment Rate in Helena is 3.2%.