Cities with the Highest Percentage of Population Employed in Production in Montana
RELATED REPORTS & OPTIONS
Production
Montana
Compare Cities
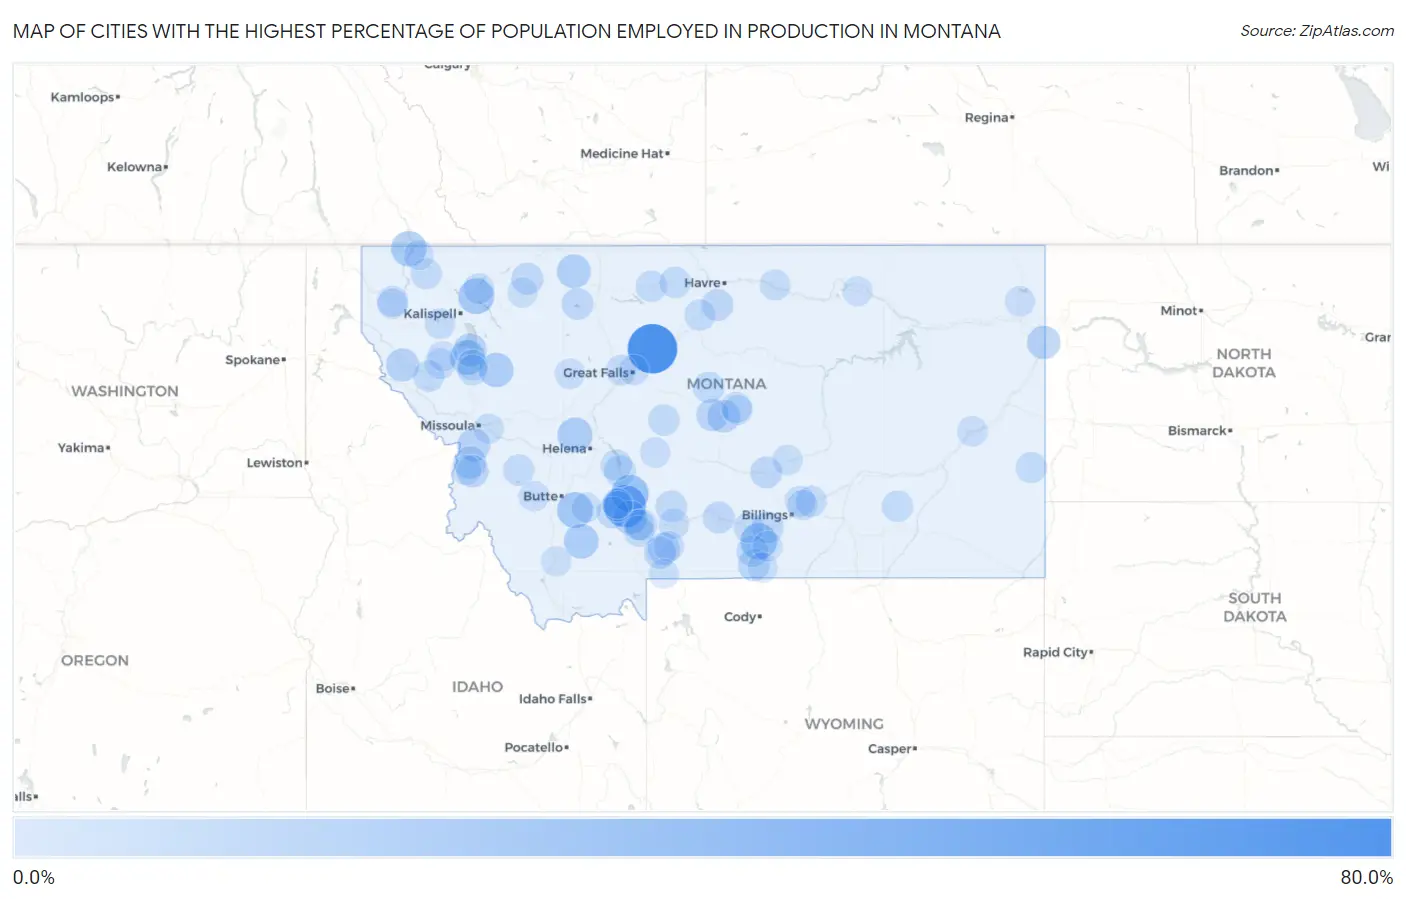
Map of Cities with the Highest Percentage of Population Employed in Production in Montana
0.0%
80.0%
Cities with the Highest Percentage of Population Employed in Production in Montana
| City | % Employed | vs State | vs National | |
| 1. | Carter | 75.0% | 4.0%(+71.0)#1 | 5.5%(+69.5)#68 |
| 2. | Cyr | 51.6% | 4.0%(+47.6)#2 | 5.5%(+46.1)#185 |
| 3. | Logan | 47.7% | 4.0%(+43.7)#3 | 5.5%(+42.2)#231 |
| 4. | Tracy | 41.7% | 4.0%(+37.7)#4 | 5.5%(+36.2)#324 |
| 5. | Windham | 33.3% | 4.0%(+29.3)#5 | 5.5%(+27.9)#584 |
| 6. | Ponderosa Pines | 30.9% | 4.0%(+26.9)#6 | 5.5%(+25.4)#717 |
| 7. | Unionville | 28.5% | 4.0%(+24.5)#7 | 5.5%(+23.0)#890 |
| 8. | Boyd | 27.3% | 4.0%(+23.3)#8 | 5.5%(+21.8)#1,004 |
| 9. | Zurich | 26.1% | 4.0%(+22.1)#9 | 5.5%(+20.6)#1,125 |
| 10. | Rader Creek | 25.6% | 4.0%(+21.7)#10 | 5.5%(+20.2)#1,176 |
| 11. | Martin City | 25.2% | 4.0%(+21.2)#11 | 5.5%(+19.7)#1,241 |
| 12. | West Kootenai | 23.4% | 4.0%(+19.4)#12 | 5.5%(+17.9)#1,520 |
| 13. | Kerr | 22.0% | 4.0%(+18.0)#13 | 5.5%(+16.5)#1,777 |
| 14. | Marysville | 21.6% | 4.0%(+17.6)#14 | 5.5%(+16.2)#1,855 |
| 15. | Sheridan | 21.3% | 4.0%(+17.3)#15 | 5.5%(+15.9)#1,916 |
| 16. | Condon | 20.5% | 4.0%(+16.5)#16 | 5.5%(+15.0)#2,143 |
| 17. | Bloomfield | 20.0% | 4.0%(+16.0)#17 | 5.5%(+14.5)#2,279 |
| 18. | Fishtail | 18.8% | 4.0%(+14.8)#18 | 5.5%(+13.3)#2,655 |
| 19. | Santa Rita | 18.4% | 4.0%(+14.4)#19 | 5.5%(+13.0)#2,762 |
| 20. | Amsterdam | 17.5% | 4.0%(+13.5)#20 | 5.5%(+12.0)#3,124 |
| 21. | Fairview | 16.8% | 4.0%(+12.9)#21 | 5.5%(+11.4)#3,432 |
| 22. | Thompson Falls | 16.3% | 4.0%(+12.3)#22 | 5.5%(+10.8)#3,702 |
| 23. | Kings Point | 16.3% | 4.0%(+12.3)#23 | 5.5%(+10.8)#3,726 |
| 24. | Florence | 15.6% | 4.0%(+11.6)#24 | 5.5%(+10.2)#4,053 |
| 25. | Homestead | 15.4% | 4.0%(+11.4)#25 | 5.5%(+9.92)#4,186 |
| 26. | Rapelje | 14.6% | 4.0%(+10.7)#26 | 5.5%(+9.17)#4,649 |
| 27. | Moore | 14.5% | 4.0%(+10.6)#27 | 5.5%(+9.08)#4,699 |
| 28. | Twin Creeks | 13.8% | 4.0%(+9.81)#28 | 5.5%(+8.32)#5,139 |
| 29. | Victor | 13.8% | 4.0%(+9.79)#29 | 5.5%(+8.31)#5,146 |
| 30. | Hobson | 13.6% | 4.0%(+9.65)#30 | 5.5%(+8.17)#5,249 |
| 31. | Emigrant | 13.1% | 4.0%(+9.12)#31 | 5.5%(+7.63)#5,680 |
| 32. | South Glastonbury | 12.7% | 4.0%(+8.74)#32 | 5.5%(+7.26)#5,996 |
| 33. | Corvallis | 12.7% | 4.0%(+8.71)#33 | 5.5%(+7.23)#6,015 |
| 34. | Ayers Ranch Colony | 12.1% | 4.0%(+8.14)#34 | 5.5%(+6.65)#6,512 |
| 35. | Azure | 12.0% | 4.0%(+8.02)#35 | 5.5%(+6.53)#6,626 |
| 36. | Starr School | 11.9% | 4.0%(+7.92)#36 | 5.5%(+6.44)#6,728 |
| 37. | Park City | 11.7% | 4.0%(+7.71)#37 | 5.5%(+6.23)#6,946 |
| 38. | Lavina | 11.5% | 4.0%(+7.55)#38 | 5.5%(+6.07)#7,088 |
| 39. | Bearcreek | 11.5% | 4.0%(+7.51)#39 | 5.5%(+6.03)#7,145 |
| 40. | Greycliff | 11.3% | 4.0%(+7.27)#40 | 5.5%(+5.78)#7,377 |
| 41. | King Arthur Park | 11.2% | 4.0%(+7.25)#41 | 5.5%(+5.77)#7,391 |
| 42. | Willow Creek | 11.2% | 4.0%(+7.24)#42 | 5.5%(+5.76)#7,410 |
| 43. | Valier | 11.2% | 4.0%(+7.22)#43 | 5.5%(+5.74)#7,431 |
| 44. | Roberts | 11.2% | 4.0%(+7.22)#44 | 5.5%(+5.73)#7,435 |
| 45. | Townsend | 11.0% | 4.0%(+7.04)#45 | 5.5%(+5.55)#7,638 |
| 46. | Clyde Park | 10.9% | 4.0%(+6.93)#46 | 5.5%(+5.44)#7,751 |
| 47. | Riverview Colony | 10.4% | 4.0%(+6.43)#47 | 5.5%(+4.95)#8,257 |
| 48. | Denton | 10.1% | 4.0%(+6.09)#48 | 5.5%(+4.60)#8,668 |
| 49. | Pine Creek | 10.0% | 4.0%(+6.02)#49 | 5.5%(+4.53)#8,750 |
| 50. | Neihart | 10.0% | 4.0%(+6.02)#50 | 5.5%(+4.53)#8,768 |
| 51. | Plains | 9.9% | 4.0%(+5.88)#51 | 5.5%(+4.39)#8,904 |
| 52. | The Silos | 9.9% | 4.0%(+5.88)#52 | 5.5%(+4.39)#8,910 |
| 53. | Chester | 9.8% | 4.0%(+5.83)#53 | 5.5%(+4.35)#8,969 |
| 54. | Baker | 9.7% | 4.0%(+5.76)#54 | 5.5%(+4.28)#9,061 |
| 55. | Philipsburg | 9.7% | 4.0%(+5.76)#55 | 5.5%(+4.27)#9,064 |
| 56. | Rudyard | 9.7% | 4.0%(+5.68)#56 | 5.5%(+4.19)#9,153 |
| 57. | Big Sandy | 9.6% | 4.0%(+5.58)#57 | 5.5%(+4.10)#9,247 |
| 58. | Colstrip | 9.4% | 4.0%(+5.43)#58 | 5.5%(+3.95)#9,445 |
| 59. | Ballantine | 9.1% | 4.0%(+5.11)#59 | 5.5%(+3.62)#9,845 |
| 60. | Lewistown Heights | 9.0% | 4.0%(+4.99)#60 | 5.5%(+3.51)#10,001 |
| 61. | Trego | 8.9% | 4.0%(+4.95)#61 | 5.5%(+3.47)#10,053 |
| 62. | Gallatin Gateway | 8.7% | 4.0%(+4.68)#62 | 5.5%(+3.19)#10,410 |
| 63. | Harlem | 8.6% | 4.0%(+4.64)#63 | 5.5%(+3.16)#10,463 |
| 64. | Pablo | 8.5% | 4.0%(+4.51)#64 | 5.5%(+3.03)#10,653 |
| 65. | Hot Springs | 8.3% | 4.0%(+4.30)#65 | 5.5%(+2.82)#10,965 |
| 66. | White Haven | 8.3% | 4.0%(+4.29)#66 | 5.5%(+2.81)#10,977 |
| 67. | West Glacier | 8.2% | 4.0%(+4.18)#67 | 5.5%(+2.69)#11,121 |
| 68. | Shepherd | 8.1% | 4.0%(+4.15)#68 | 5.5%(+2.66)#11,170 |
| 69. | Sun Prairie | 8.1% | 4.0%(+4.11)#69 | 5.5%(+2.62)#11,230 |
| 70. | Columbus | 8.0% | 4.0%(+4.04)#70 | 5.5%(+2.55)#11,326 |
| 71. | Ronan | 8.0% | 4.0%(+3.97)#71 | 5.5%(+2.49)#11,416 |
| 72. | Marion | 7.9% | 4.0%(+3.92)#72 | 5.5%(+2.43)#11,499 |
| 73. | Livingston | 7.8% | 4.0%(+3.87)#73 | 5.5%(+2.38)#11,574 |
| 74. | Black Eagle | 7.5% | 4.0%(+3.52)#74 | 5.5%(+2.04)#12,143 |
| 75. | Augusta | 7.4% | 4.0%(+3.42)#75 | 5.5%(+1.94)#12,303 |
| 76. | Huntley | 7.4% | 4.0%(+3.39)#76 | 5.5%(+1.91)#12,353 |
| 77. | Terry | 7.4% | 4.0%(+3.38)#77 | 5.5%(+1.89)#12,372 |
| 78. | Four Corners | 7.0% | 4.0%(+3.05)#78 | 5.5%(+1.57)#12,924 |
| 79. | Pioneer Junction | 7.0% | 4.0%(+3.00)#79 | 5.5%(+1.52)#13,012 |
| 80. | Anaconda Deer Lodge County | 6.9% | 4.0%(+2.96)#80 | 5.5%(+1.47)#13,085 |
| 81. | White Sulphur Springs | 6.9% | 4.0%(+2.91)#81 | 5.5%(+1.43)#13,156 |
| 82. | Camp Three | 6.8% | 4.0%(+2.87)#82 | 5.5%(+1.38)#13,242 |
| 83. | Pray | 6.7% | 4.0%(+2.68)#83 | 5.5%(+1.20)#13,544 |
| 84. | York | 6.5% | 4.0%(+2.56)#84 | 5.5%(+1.08)#13,763 |
| 85. | Froid | 6.5% | 4.0%(+2.56)#85 | 5.5%(+1.07)#13,771 |
| 86. | Three Forks | 6.5% | 4.0%(+2.54)#86 | 5.5%(+1.05)#13,807 |
| 87. | Turah | 6.5% | 4.0%(+2.53)#87 | 5.5%(+1.04)#13,829 |
| 88. | Fromberg | 6.5% | 4.0%(+2.53)#88 | 5.5%(+1.04)#13,834 |
| 89. | Belfry | 6.4% | 4.0%(+2.43)#89 | 5.5%(+0.942)#13,998 |
| 90. | St. Mary | 6.3% | 4.0%(+2.37)#90 | 5.5%(+0.881)#14,102 |
| 91. | Lonepine | 6.3% | 4.0%(+2.37)#91 | 5.5%(+0.881)#14,105 |
| 92. | Wheatland | 6.3% | 4.0%(+2.33)#92 | 5.5%(+0.842)#14,161 |
| 93. | East Glacier Park Village | 6.3% | 4.0%(+2.32)#93 | 5.5%(+0.831)#14,189 |
| 94. | Pinesdale | 6.3% | 4.0%(+2.31)#94 | 5.5%(+0.824)#14,200 |
| 95. | Saco | 6.2% | 4.0%(+2.27)#95 | 5.5%(+0.781)#14,281 |
| 96. | Lewistown | 6.2% | 4.0%(+2.25)#96 | 5.5%(+0.769)#14,302 |
| 97. | Dillon | 6.2% | 4.0%(+2.25)#97 | 5.5%(+0.761)#14,313 |
| 98. | Eureka | 6.0% | 4.0%(+2.00)#98 | 5.5%(+0.510)#14,766 |
| 99. | Whitehall | 5.9% | 4.0%(+1.94)#99 | 5.5%(+0.456)#14,867 |
| 100. | Gardiner | 5.9% | 4.0%(+1.91)#100 | 5.5%(+0.425)#14,917 |
Common Questions
What are the Top 10 Cities with the Highest Percentage of Population Employed in Production in Montana?
Top 10 Cities with the Highest Percentage of Population Employed in Production in Montana are:
#1
75.0%
#2
47.7%
#3
30.9%
#4
27.3%
#5
25.6%
#6
25.2%
#7
23.4%
#8
22.0%
#9
21.6%
#10
21.3%
What city has the Highest Percentage of Population Employed in Production in Montana?
Carter has the Highest Percentage of Population Employed in Production in Montana with 75.0%.
What is the Percentage of Population Employed in Production in the State of Montana?
Percentage of Population Employed in Production in Montana is 4.0%.
What is the Percentage of Population Employed in Production in the United States?
Percentage of Population Employed in Production in the United States is 5.5%.