Trout Creek, MT Map & Demographics
Trout Creek Map
Trout Creek Overview
$30,052
PER CAPITA INCOME
$53,906
AVG FAMILY INCOME
$53,977
AVG HOUSEHOLD INCOME
3.7%
WAGE / INCOME GAP [ % ]
96.3¢/ $1
WAGE / INCOME GAP [ $ ]
0.39
INEQUALITY / GINI INDEX
298
TOTAL POPULATION
119
MALE POPULATION
179
FEMALE POPULATION
66.48
MALES / 100 FEMALES
150.42
FEMALES / 100 MALES
44.7
MEDIAN AGE
2.9
AVG FAMILY SIZE
2.5
AVG HOUSEHOLD SIZE
103
LABOR FORCE [ PEOPLE ]
40.4%
PERCENT IN LABOR FORCE
Trout Creek Zip Codes
Trout Creek Area Codes
Income in Trout Creek
Income Overview in Trout Creek
Per Capita Income in Trout Creek is $30,052, while median incomes of families and households are $53,906 and $53,977 respectively.
| Characteristic | Number | Measure |
| Per Capita Income | 298 | $30,052 |
| Median Family Income | 91 | $53,906 |
| Mean Family Income | 91 | $93,689 |
| Median Household Income | 117 | $53,977 |
| Mean Household Income | 117 | $83,920 |
| Income Deficit | 91 | $0 |
| Wage / Income Gap (%) | 298 | 3.70% |
| Wage / Income Gap ($) | 298 | 96.30¢ per $1 |
| Gini / Inequality Index | 298 | 0.39 |
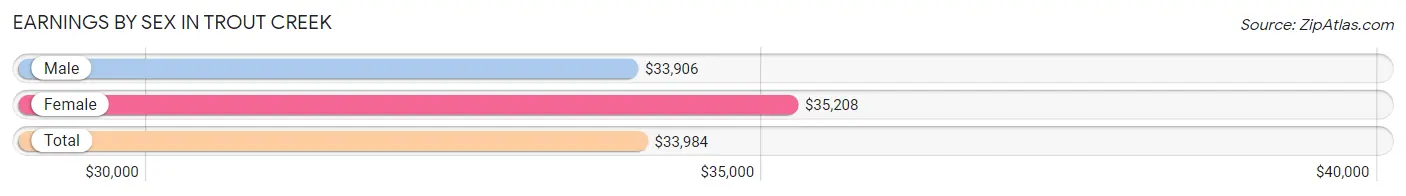
Earnings by Sex in Trout Creek
Average Earnings in Trout Creek are $33,984, $33,906 for men and $35,208 for women, a difference of 3.7%.
| Sex | Number | Average Earnings |
| Male | 62 (53.9%) | $33,906 |
| Female | 53 (46.1%) | $35,208 |
| Total | 115 (100.0%) | $33,984 |
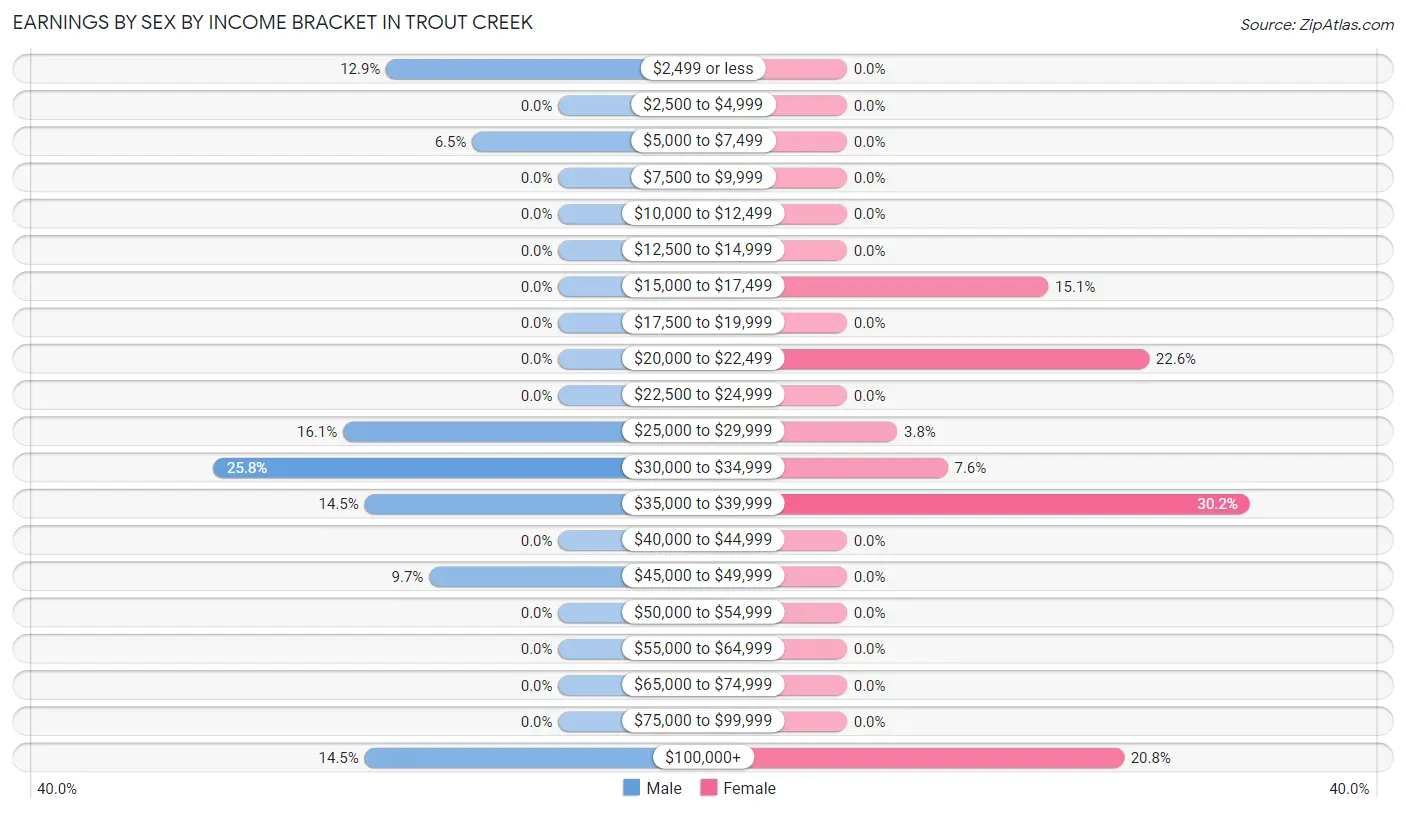
Earnings by Sex by Income Bracket in Trout Creek
The most common earnings brackets in Trout Creek are $30,000 to $34,999 for men (16 | 25.8%) and $35,000 to $39,999 for women (16 | 30.2%).
| Income | Male | Female |
| $2,499 or less | 8 (12.9%) | 0 (0.0%) |
| $2,500 to $4,999 | 0 (0.0%) | 0 (0.0%) |
| $5,000 to $7,499 | 4 (6.5%) | 0 (0.0%) |
| $7,500 to $9,999 | 0 (0.0%) | 0 (0.0%) |
| $10,000 to $12,499 | 0 (0.0%) | 0 (0.0%) |
| $12,500 to $14,999 | 0 (0.0%) | 0 (0.0%) |
| $15,000 to $17,499 | 0 (0.0%) | 8 (15.1%) |
| $17,500 to $19,999 | 0 (0.0%) | 0 (0.0%) |
| $20,000 to $22,499 | 0 (0.0%) | 12 (22.6%) |
| $22,500 to $24,999 | 0 (0.0%) | 0 (0.0%) |
| $25,000 to $29,999 | 10 (16.1%) | 2 (3.8%) |
| $30,000 to $34,999 | 16 (25.8%) | 4 (7.5%) |
| $35,000 to $39,999 | 9 (14.5%) | 16 (30.2%) |
| $40,000 to $44,999 | 0 (0.0%) | 0 (0.0%) |
| $45,000 to $49,999 | 6 (9.7%) | 0 (0.0%) |
| $50,000 to $54,999 | 0 (0.0%) | 0 (0.0%) |
| $55,000 to $64,999 | 0 (0.0%) | 0 (0.0%) |
| $65,000 to $74,999 | 0 (0.0%) | 0 (0.0%) |
| $75,000 to $99,999 | 0 (0.0%) | 0 (0.0%) |
| $100,000+ | 9 (14.5%) | 11 (20.7%) |
| Total | 62 (100.0%) | 53 (100.0%) |
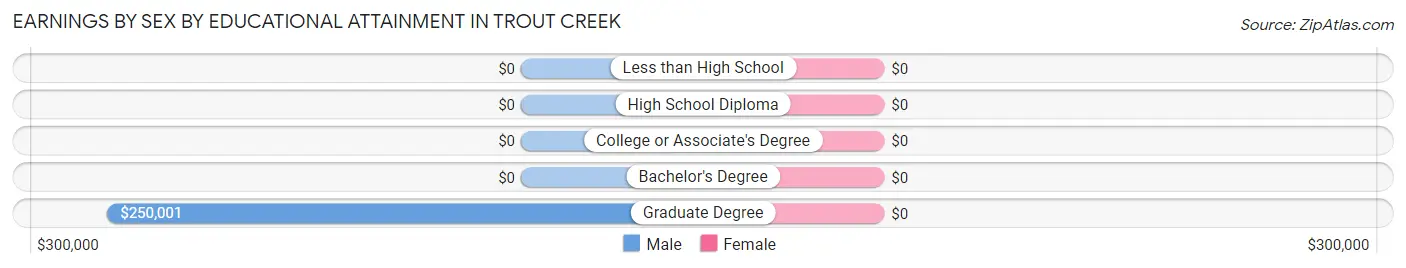
Earnings by Sex by Educational Attainment in Trout Creek
| Educational Attainment | Male Income | Female Income |
| Less than High School | - | - |
| High School Diploma | - | - |
| College or Associate's Degree | - | - |
| Bachelor's Degree | - | - |
| Graduate Degree | $250,001 | $0 |
| Total | $33,906 | $35,208 |
Family Income in Trout Creek
Family Income Brackets in Trout Creek
According to the Trout Creek family income data, there are 24 families falling into the $50,000 to $74,999 income range, which is the most common income bracket and makes up 26.4% of all families.
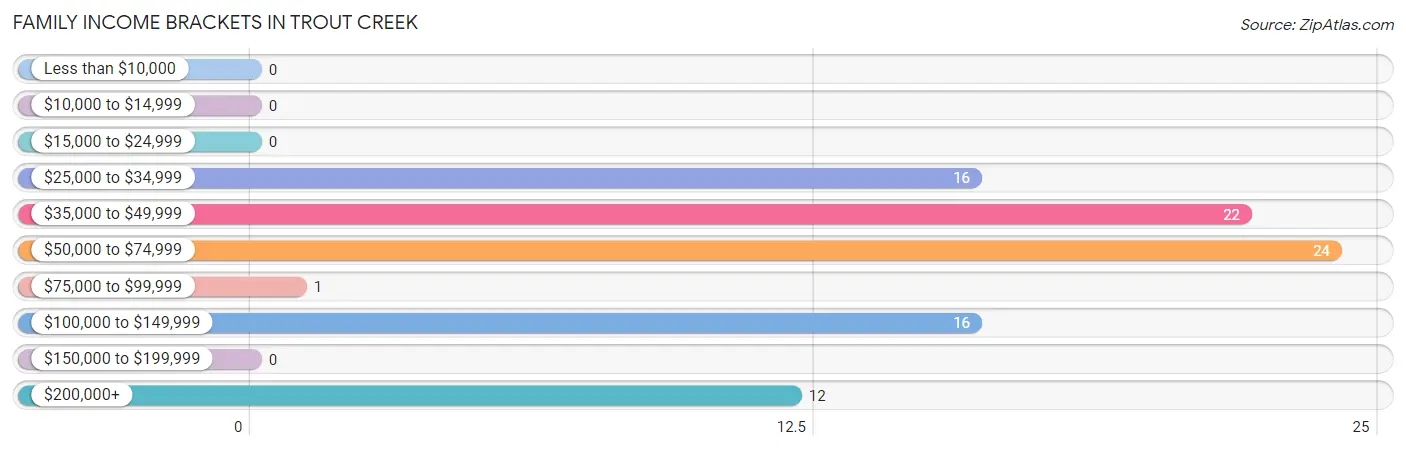
| Income Bracket | # Families | % Families |
| Less than $10,000 | 0 | 0.0% |
| $10,000 to $14,999 | 0 | 0.0% |
| $15,000 to $24,999 | 0 | 0.0% |
| $25,000 to $34,999 | 16 | 17.6% |
| $35,000 to $49,999 | 22 | 24.2% |
| $50,000 to $74,999 | 24 | 26.4% |
| $75,000 to $99,999 | 1 | 1.1% |
| $100,000 to $149,999 | 16 | 17.6% |
| $150,000 to $199,999 | 0 | 0.0% |
| $200,000+ | 12 | 13.2% |
Family Income by Famaliy Size in Trout Creek
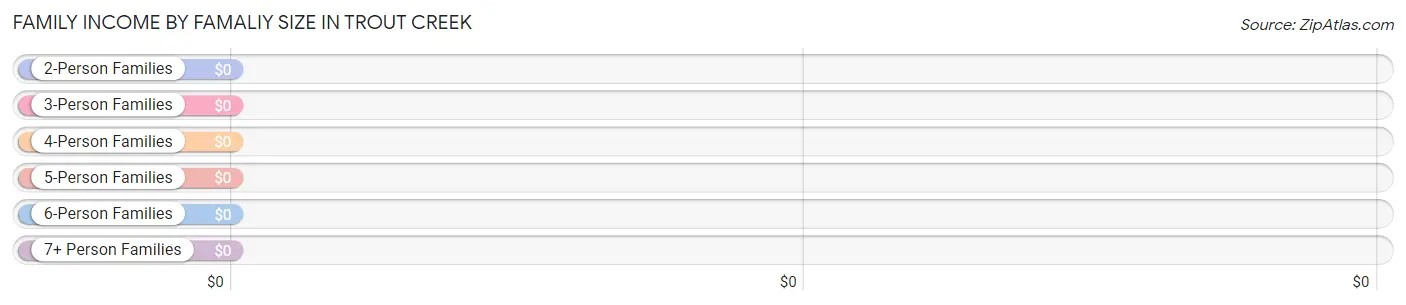
| Income Bracket | # Families | Median Income |
| 2-Person Families | 71 (78.0%) | $0 |
| 3-Person Families | 2 (2.2%) | $0 |
| 4-Person Families | 8 (8.8%) | $0 |
| 5-Person Families | 10 (11.0%) | $0 |
| 6-Person Families | 0 (0.0%) | $0 |
| 7+ Person Families | 0 (0.0%) | $0 |
| Total | 91 (100.0%) | $53,906 |
Family Income by Number of Earners in Trout Creek
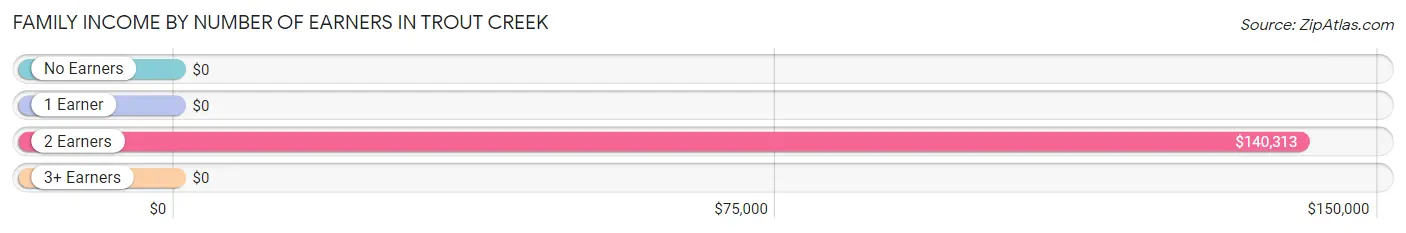
| Number of Earners | # Families | Median Income |
| No Earners | 31 (34.1%) | $0 |
| 1 Earner | 32 (35.2%) | $0 |
| 2 Earners | 28 (30.8%) | $140,313 |
| 3+ Earners | 0 (0.0%) | $0 |
| Total | 91 (100.0%) | $53,906 |
Household Income in Trout Creek
Household Income Brackets in Trout Creek
With 42 households falling in the category, the $50,000 to $74,999 income range is the most frequent in Trout Creek, accounting for 35.9% of all households.
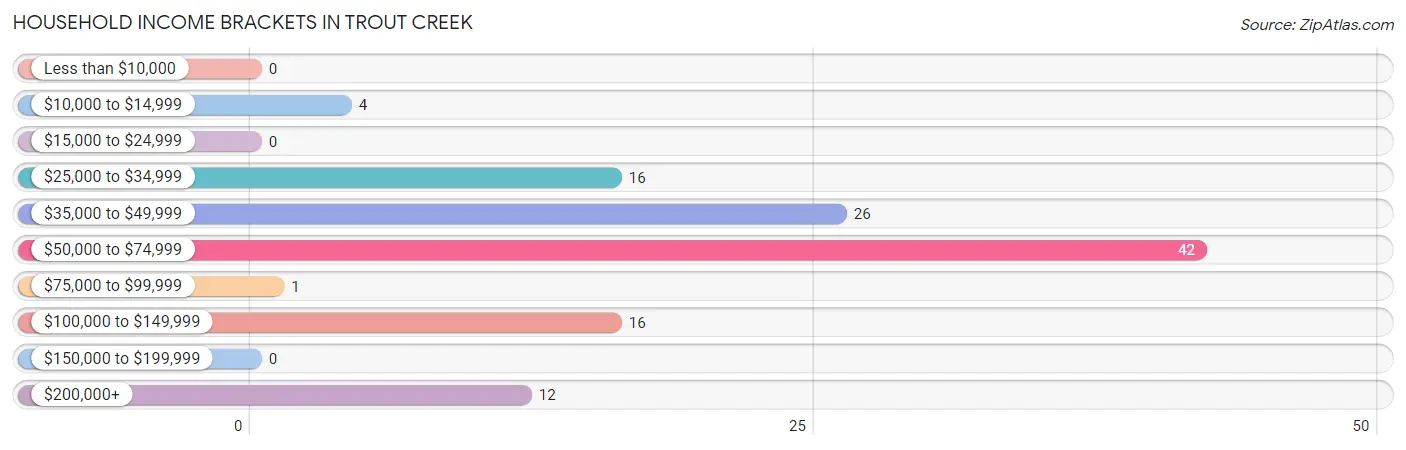
| Income Bracket | # Households | % Households |
| Less than $10,000 | 0 | 0.0% |
| $10,000 to $14,999 | 4 | 3.4% |
| $15,000 to $24,999 | 0 | 0.0% |
| $25,000 to $34,999 | 16 | 13.7% |
| $35,000 to $49,999 | 26 | 22.2% |
| $50,000 to $74,999 | 42 | 35.9% |
| $75,000 to $99,999 | 1 | 0.9% |
| $100,000 to $149,999 | 16 | 13.7% |
| $150,000 to $199,999 | 0 | 0.0% |
| $200,000+ | 12 | 10.3% |
Household Income by Householder Age in Trout Creek
The median household income in Trout Creek is $53,977, with the highest median household income of $140,469 found in the 45 to 64 years age bracket for the primary householder. A total of 26 households (22.2%) fall into this category.
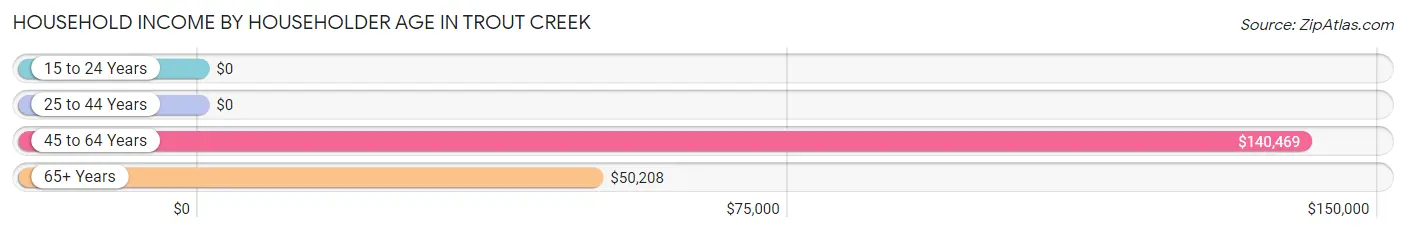
| Income Bracket | # Households | Median Income |
| 15 to 24 Years | 0 (0.0%) | $0 |
| 25 to 44 Years | 34 (29.1%) | $0 |
| 45 to 64 Years | 26 (22.2%) | $140,469 |
| 65+ Years | 57 (48.7%) | $50,208 |
| Total | 117 (100.0%) | $53,977 |
Poverty in Trout Creek
Income Below Poverty by Sex and Age in Trout Creek
With 3.4% poverty level for males and 2.2% for females among the residents of Trout Creek, 35 to 44 year old males and 45 to 54 year old females are the most vulnerable to poverty, with 4 males (15.4%) and 4 females (26.7%) in their respective age groups living below the poverty level.
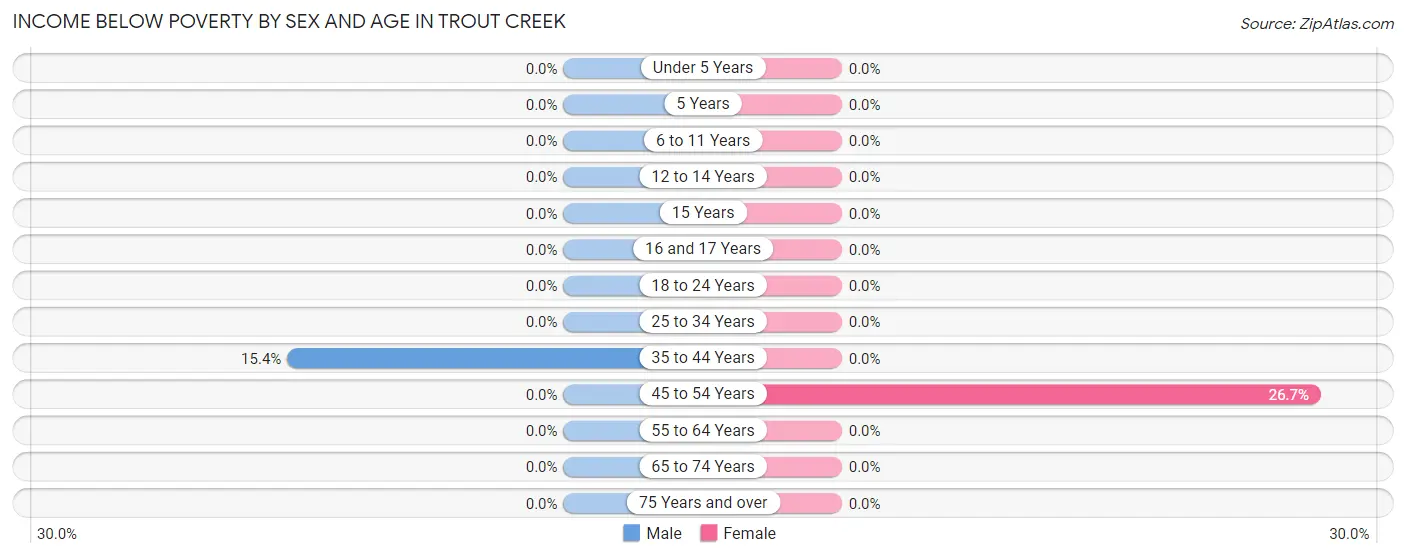
| Age Bracket | Male | Female |
| Under 5 Years | 0 (0.0%) | 0 (0.0%) |
| 5 Years | 0 (0.0%) | 0 (0.0%) |
| 6 to 11 Years | 0 (0.0%) | 0 (0.0%) |
| 12 to 14 Years | 0 (0.0%) | 0 (0.0%) |
| 15 Years | 0 (0.0%) | 0 (0.0%) |
| 16 and 17 Years | 0 (0.0%) | 0 (0.0%) |
| 18 to 24 Years | 0 (0.0%) | 0 (0.0%) |
| 25 to 34 Years | 0 (0.0%) | 0 (0.0%) |
| 35 to 44 Years | 4 (15.4%) | 0 (0.0%) |
| 45 to 54 Years | 0 (0.0%) | 4 (26.7%) |
| 55 to 64 Years | 0 (0.0%) | 0 (0.0%) |
| 65 to 74 Years | 0 (0.0%) | 0 (0.0%) |
| 75 Years and over | 0 (0.0%) | 0 (0.0%) |
| Total | 4 (3.4%) | 4 (2.2%) |
Income Above Poverty by Sex and Age in Trout Creek
According to the poverty statistics in Trout Creek, males aged 6 to 11 years and females aged 6 to 11 years are the age groups that are most secure financially, with 100.0% of males and 100.0% of females in these age groups living above the poverty line.
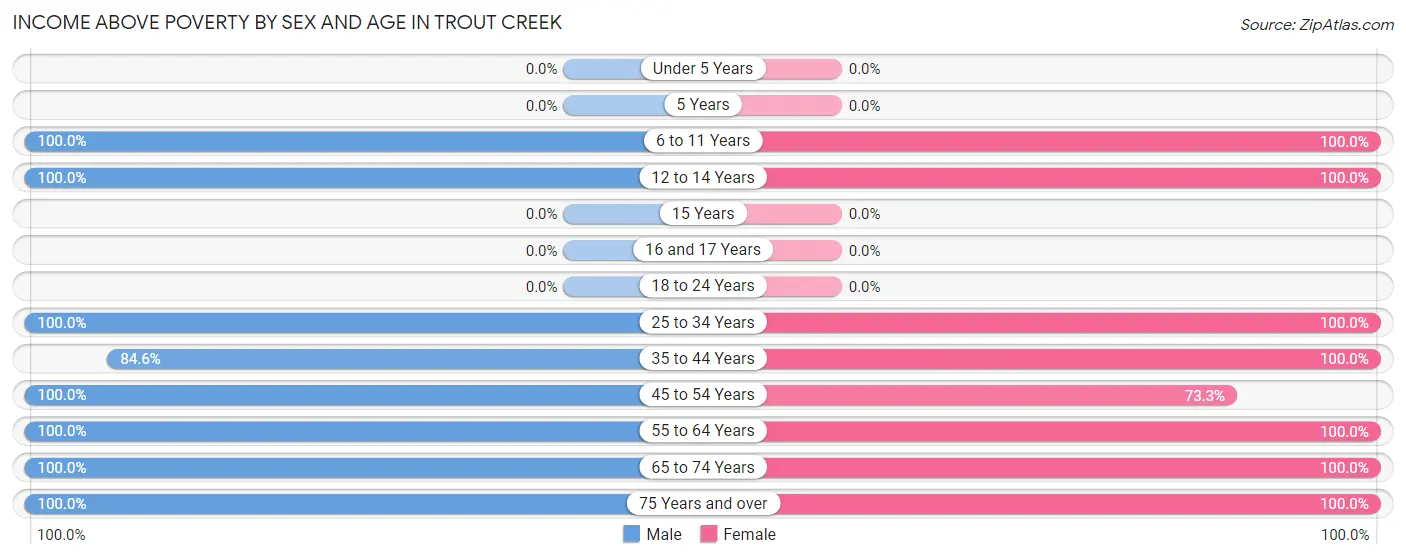
| Age Bracket | Male | Female |
| Under 5 Years | 0 (0.0%) | 0 (0.0%) |
| 5 Years | 0 (0.0%) | 0 (0.0%) |
| 6 to 11 Years | 7 (100.0%) | 12 (100.0%) |
| 12 to 14 Years | 12 (100.0%) | 12 (100.0%) |
| 15 Years | 0 (0.0%) | 0 (0.0%) |
| 16 and 17 Years | 0 (0.0%) | 0 (0.0%) |
| 18 to 24 Years | 0 (0.0%) | 0 (0.0%) |
| 25 to 34 Years | 10 (100.0%) | 8 (100.0%) |
| 35 to 44 Years | 22 (84.6%) | 66 (100.0%) |
| 45 to 54 Years | 16 (100.0%) | 11 (73.3%) |
| 55 to 64 Years | 6 (100.0%) | 6 (100.0%) |
| 65 to 74 Years | 25 (100.0%) | 49 (100.0%) |
| 75 Years and over | 17 (100.0%) | 11 (100.0%) |
| Total | 115 (96.6%) | 175 (97.8%) |
Income Below Poverty Among Married-Couple Families in Trout Creek
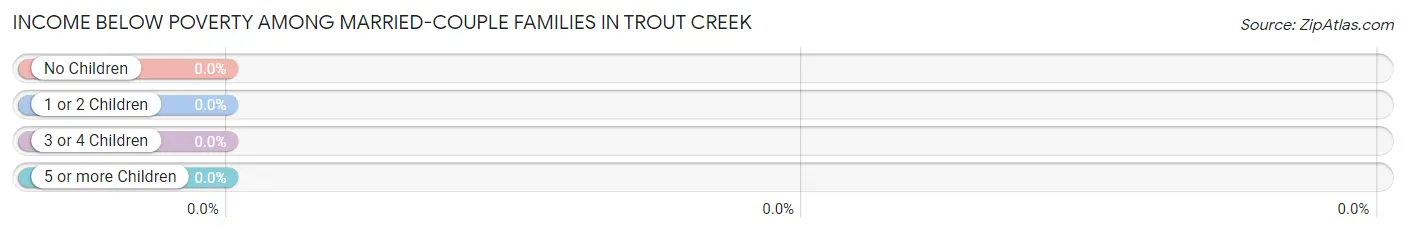
| Children | Above Poverty | Below Poverty |
| No Children | 71 (100.0%) | 0 (0.0%) |
| 1 or 2 Children | 8 (100.0%) | 0 (0.0%) |
| 3 or 4 Children | 10 (100.0%) | 0 (0.0%) |
| 5 or more Children | 0 (0.0%) | 0 (0.0%) |
| Total | 89 (100.0%) | 0 (0.0%) |
Income Below Poverty Among Single-Parent Households in Trout Creek
| Children | Single Father | Single Mother |
| No Children | 0 (0.0%) | 0 (0.0%) |
| 1 or 2 Children | 0 (0.0%) | 0 (0.0%) |
| 3 or 4 Children | 0 (0.0%) | 0 (0.0%) |
| 5 or more Children | 0 (0.0%) | 0 (0.0%) |
| Total | 0 (0.0%) | 0 (0.0%) |
Income Below Poverty Among Married-Couple vs Single-Parent Households in Trout Creek
| Children | Married-Couple Families | Single-Parent Households |
| No Children | 0 (0.0%) | 0 (0.0%) |
| 1 or 2 Children | 0 (0.0%) | 0 (0.0%) |
| 3 or 4 Children | 0 (0.0%) | 0 (0.0%) |
| 5 or more Children | 0 (0.0%) | 0 (0.0%) |
| Total | 0 (0.0%) | 0 (0.0%) |
Race in Trout Creek
The most populous races in Trout Creek are White / Caucasian (253 | 84.9%), Hispanic or Latino (26 | 8.7%), and Black / African American (23 | 7.7%).
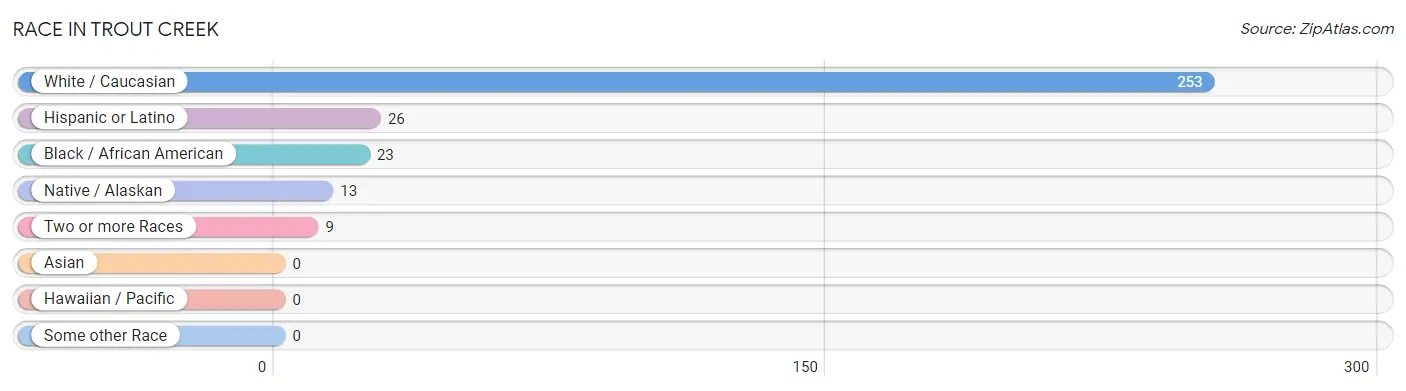
| Race | # Population | % Population |
| Asian | 0 | 0.0% |
| Black / African American | 23 | 7.7% |
| Hawaiian / Pacific | 0 | 0.0% |
| Hispanic or Latino | 26 | 8.7% |
| Native / Alaskan | 13 | 4.4% |
| White / Caucasian | 253 | 84.9% |
| Two or more Races | 9 | 3.0% |
| Some other Race | 0 | 0.0% |
| Total | 298 | 100.0% |
Ancestry in Trout Creek
The most populous ancestries reported in Trout Creek are German (101 | 33.9%), Irish (79 | 26.5%), American (36 | 12.1%), English (36 | 12.1%), and Mexican (26 | 8.7%), together accounting for 93.3% of all Trout Creek residents.
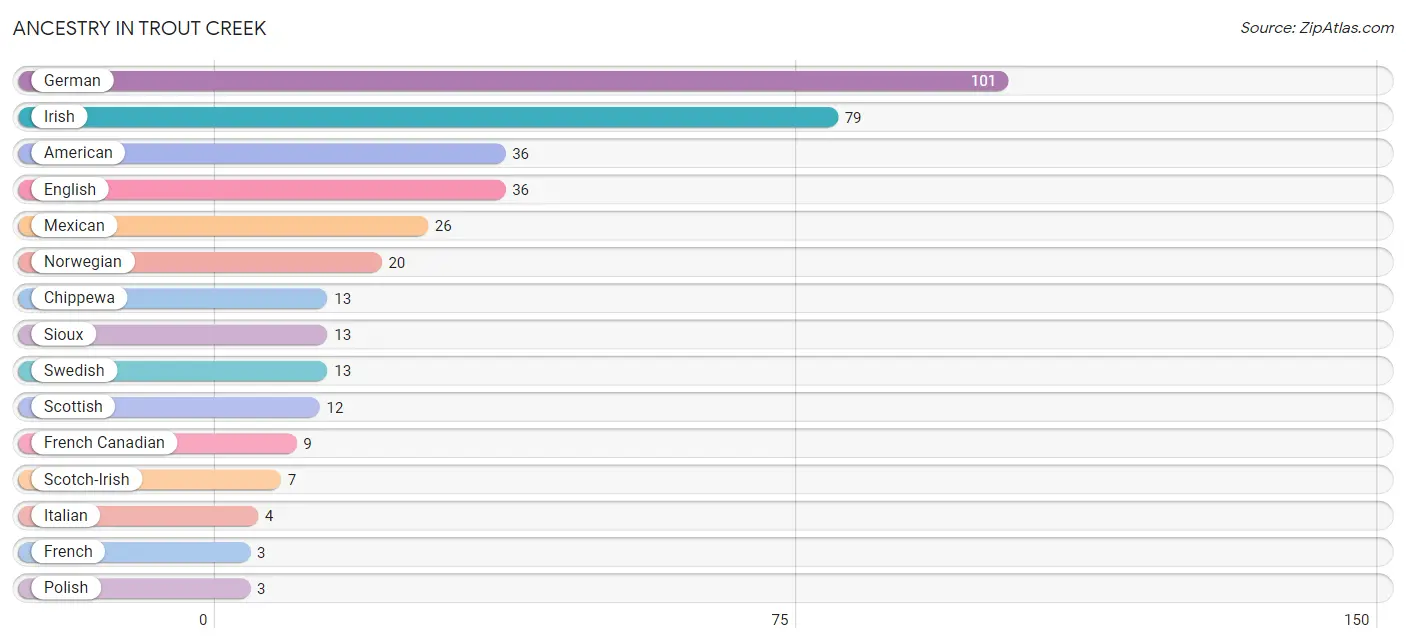
| Ancestry | # Population | % Population |
| American | 36 | 12.1% |
| Chippewa | 13 | 4.4% |
| English | 36 | 12.1% |
| French | 3 | 1.0% |
| French Canadian | 9 | 3.0% |
| German | 101 | 33.9% |
| Irish | 79 | 26.5% |
| Italian | 4 | 1.3% |
| Mexican | 26 | 8.7% |
| Norwegian | 20 | 6.7% |
| Polish | 3 | 1.0% |
| Scotch-Irish | 7 | 2.4% |
| Scottish | 12 | 4.0% |
| Sioux | 13 | 4.4% |
| Slovak | 3 | 1.0% |
| Swedish | 13 | 4.4% | View All 16 Rows |
Immigrants in Trout Creek
The most numerous immigrant groups reported in Trout Creek came from Europe (17 | 5.7%), Northern Europe (12 | 4.0%), Scotland (12 | 4.0%), Germany (5 | 1.7%), and Western Europe (5 | 1.7%), together accounting for 17.1% of all Trout Creek residents.
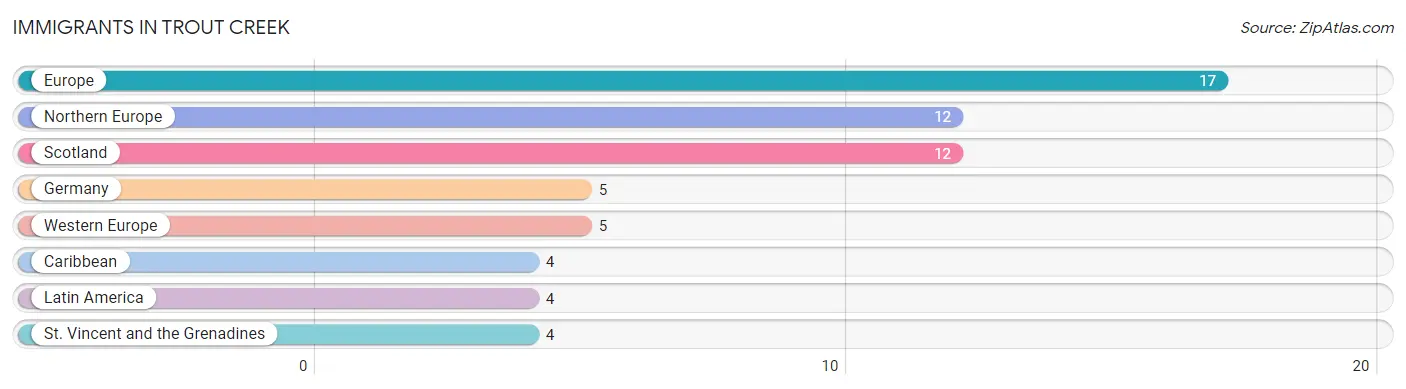
| Immigration Origin | # Population | % Population |
| Caribbean | 4 | 1.3% |
| Europe | 17 | 5.7% |
| Germany | 5 | 1.7% |
| Latin America | 4 | 1.3% |
| Northern Europe | 12 | 4.0% |
| Scotland | 12 | 4.0% |
| St. Vincent and the Grenadines | 4 | 1.3% |
| Western Europe | 5 | 1.7% | View All 8 Rows |
Sex and Age in Trout Creek
Sex and Age in Trout Creek
The most populous age groups in Trout Creek are 65 to 69 Years (24 | 20.2%) for men and 40 to 44 Years (50 | 27.9%) for women.
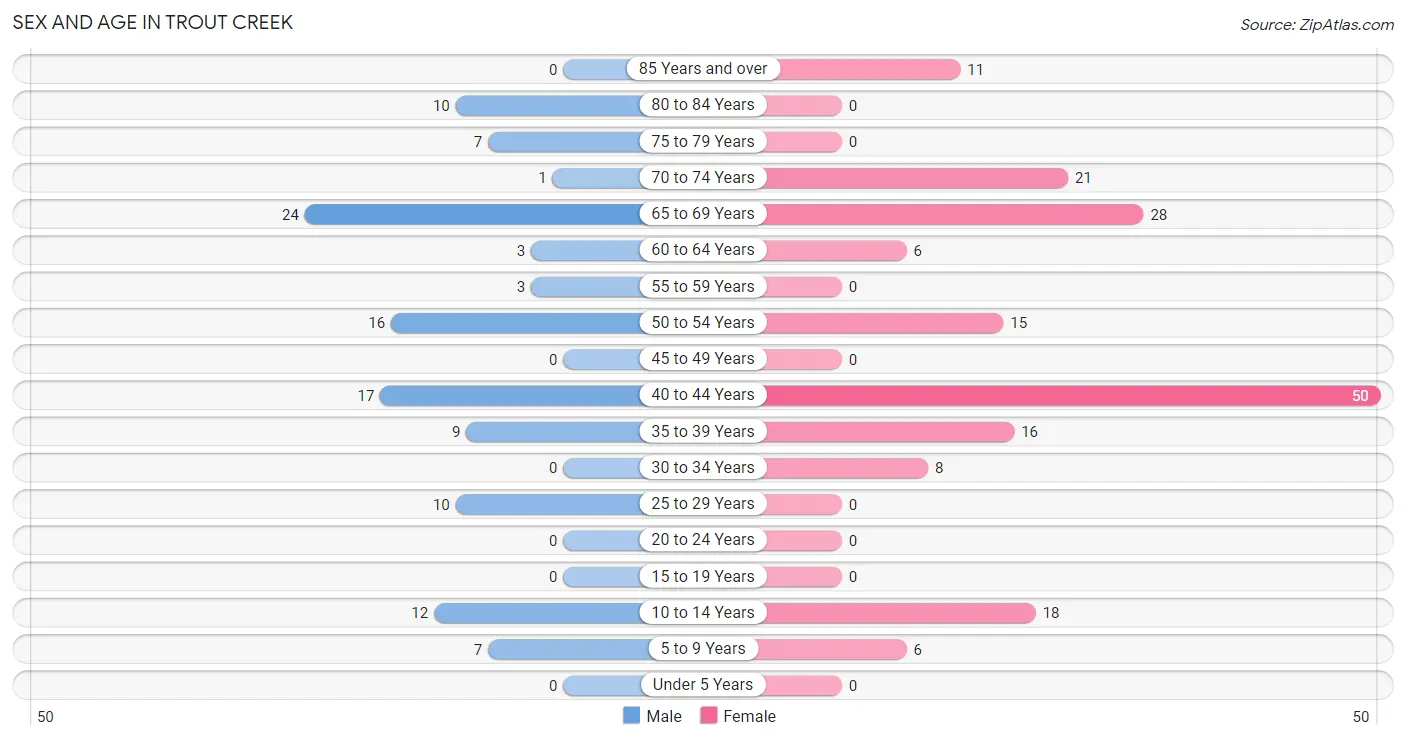
| Age Bracket | Male | Female |
| Under 5 Years | 0 (0.0%) | 0 (0.0%) |
| 5 to 9 Years | 7 (5.9%) | 6 (3.4%) |
| 10 to 14 Years | 12 (10.1%) | 18 (10.1%) |
| 15 to 19 Years | 0 (0.0%) | 0 (0.0%) |
| 20 to 24 Years | 0 (0.0%) | 0 (0.0%) |
| 25 to 29 Years | 10 (8.4%) | 0 (0.0%) |
| 30 to 34 Years | 0 (0.0%) | 8 (4.5%) |
| 35 to 39 Years | 9 (7.6%) | 16 (8.9%) |
| 40 to 44 Years | 17 (14.3%) | 50 (27.9%) |
| 45 to 49 Years | 0 (0.0%) | 0 (0.0%) |
| 50 to 54 Years | 16 (13.5%) | 15 (8.4%) |
| 55 to 59 Years | 3 (2.5%) | 0 (0.0%) |
| 60 to 64 Years | 3 (2.5%) | 6 (3.4%) |
| 65 to 69 Years | 24 (20.2%) | 28 (15.6%) |
| 70 to 74 Years | 1 (0.8%) | 21 (11.7%) |
| 75 to 79 Years | 7 (5.9%) | 0 (0.0%) |
| 80 to 84 Years | 10 (8.4%) | 0 (0.0%) |
| 85 Years and over | 0 (0.0%) | 11 (6.1%) |
| Total | 119 (100.0%) | 179 (100.0%) |
Families and Households in Trout Creek
Median Family Size in Trout Creek
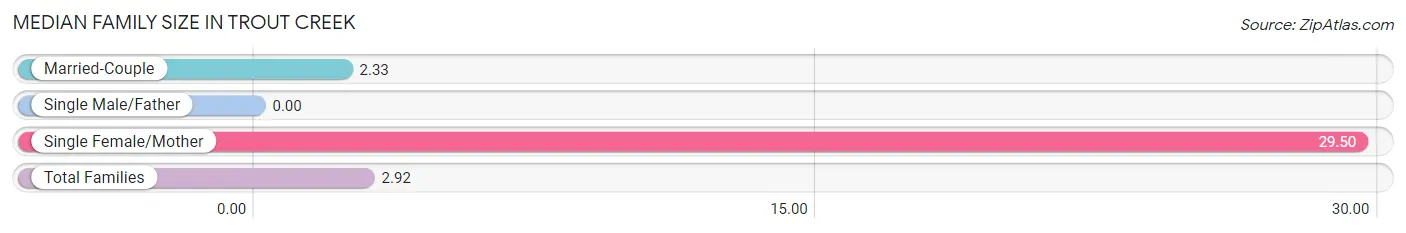
| Family Type | # Families | Family Size |
| Married-Couple | 89 (97.8%) | 2.33 |
| Single Male/Father | 0 (0.0%) | - |
| Single Female/Mother | 2 (2.2%) | 29.50 |
| Total Families | 91 (100.0%) | 2.92 |
Median Household Size in Trout Creek
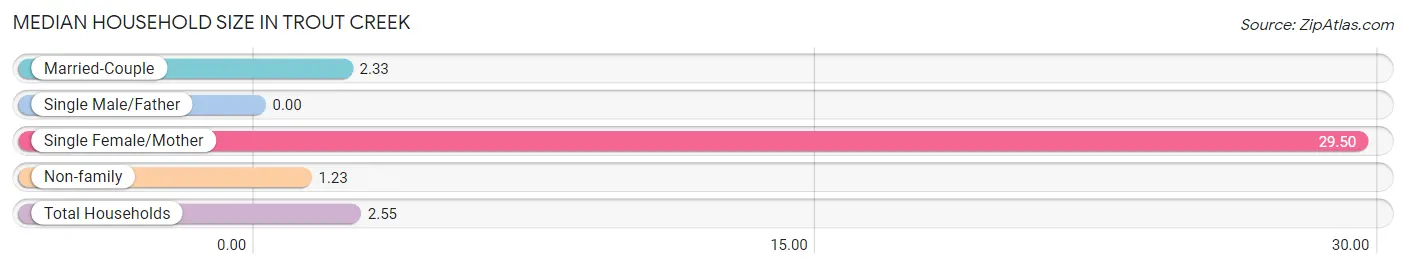
| Household Type | # Households | Household Size |
| Married-Couple | 89 (76.1%) | 2.33 |
| Single Male/Father | 0 (0.0%) | - |
| Single Female/Mother | 2 (1.7%) | 29.50 |
| Non-family | 26 (22.2%) | 1.23 |
| Total Households | 117 (100.0%) | 2.55 |
Household Size by Marriage Status in Trout Creek
Out of a total of 117 households in Trout Creek, 91 (77.8%) are family households, while 26 (22.2%) are nonfamily households. The most numerous type of family households are 2-person households, comprising 71, and the most common type of nonfamily households are 1-person households, comprising 22.
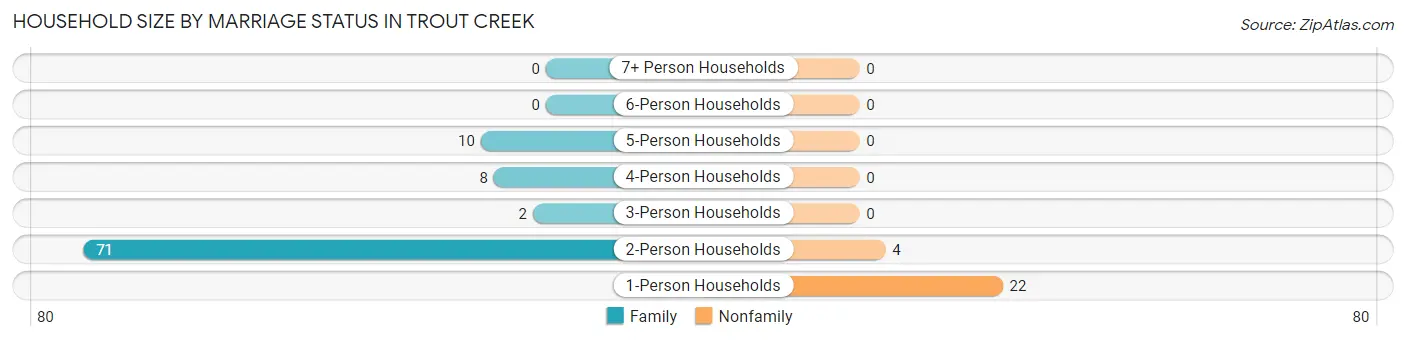
| Household Size | Family Households | Nonfamily Households |
| 1-Person Households | - | 22 (18.8%) |
| 2-Person Households | 71 (60.7%) | 4 (3.4%) |
| 3-Person Households | 2 (1.7%) | 0 (0.0%) |
| 4-Person Households | 8 (6.8%) | 0 (0.0%) |
| 5-Person Households | 10 (8.6%) | 0 (0.0%) |
| 6-Person Households | 0 (0.0%) | 0 (0.0%) |
| 7+ Person Households | 0 (0.0%) | 0 (0.0%) |
| Total | 91 (77.8%) | 26 (22.2%) |
Female Fertility in Trout Creek
Fertility by Age in Trout Creek
| Age Bracket | Women with Births | Births / 1,000 Women |
| 15 to 19 years | 0 (0.0%) | 0.0 |
| 20 to 34 years | 0 (0.0%) | 0.0 |
| 35 to 50 years | 0 (0.0%) | 0.0 |
| Total | 0 (0.0%) | 0.0 |
Fertility by Age by Marriage Status in Trout Creek
| Age Bracket | Married | Unmarried |
| 15 to 19 years | 0 (0.0%) | 0 (0.0%) |
| 20 to 34 years | 0 (0.0%) | 0 (0.0%) |
| 35 to 50 years | 0 (0.0%) | 0 (0.0%) |
| Total | 0 (0.0%) | 0 (0.0%) |
Fertility by Education in Trout Creek
| Educational Attainment | Women with Births | Births / 1,000 Women |
| Less than High School | 0 (0.0%) | 0.0 |
| High School Diploma | 0 (0.0%) | 0.0 |
| College or Associate's Degree | 0 (0.0%) | 0.0 |
| Bachelor's Degree | 0 (0.0%) | 0.0 |
| Graduate Degree | 0 (0.0%) | 0.0 |
| Total | 0 (0.0%) | 0.0 |
Fertility by Education by Marriage Status in Trout Creek
| Educational Attainment | Married | Unmarried |
| Less than High School | 0 (0.0%) | 0 (0.0%) |
| High School Diploma | 0 (0.0%) | 0 (0.0%) |
| College or Associate's Degree | 0 (0.0%) | 0 (0.0%) |
| Bachelor's Degree | 0 (0.0%) | 0 (0.0%) |
| Graduate Degree | 0 (0.0%) | 0 (0.0%) |
| Total | 0 (0.0%) | 0 (0.0%) |
Employment Characteristics in Trout Creek
Employment by Class of Employer in Trout Creek
Among the 103 employed individuals in Trout Creek, local government employees (39 | 37.9%), private company employees (36 | 34.9%), and not-for-profit organizations (15 | 14.6%) make up the most common classes of employment.
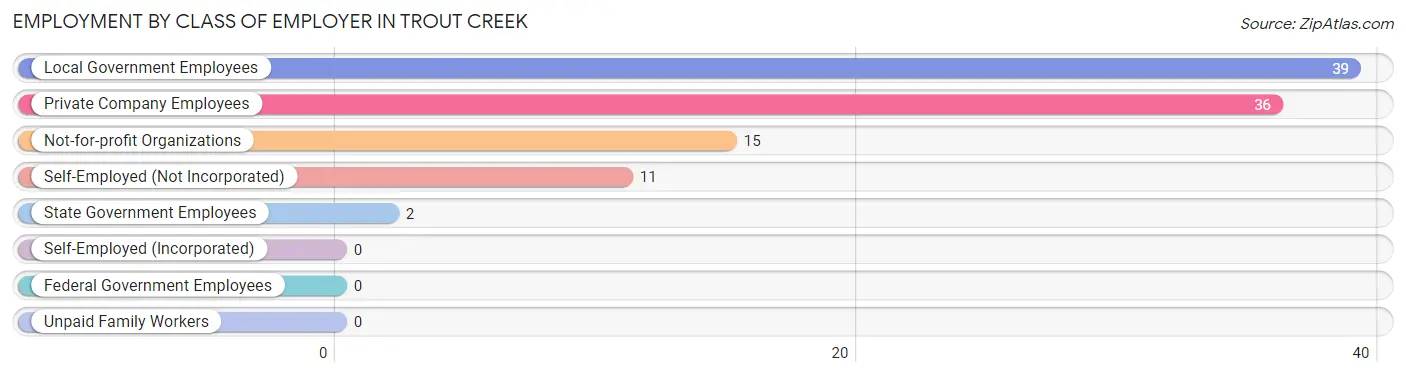
| Employer Class | # Employees | % Employees |
| Private Company Employees | 36 | 34.9% |
| Self-Employed (Incorporated) | 0 | 0.0% |
| Self-Employed (Not Incorporated) | 11 | 10.7% |
| Not-for-profit Organizations | 15 | 14.6% |
| Local Government Employees | 39 | 37.9% |
| State Government Employees | 2 | 1.9% |
| Federal Government Employees | 0 | 0.0% |
| Unpaid Family Workers | 0 | 0.0% |
| Total | 103 | 100.0% |
Employment Status by Age in Trout Creek
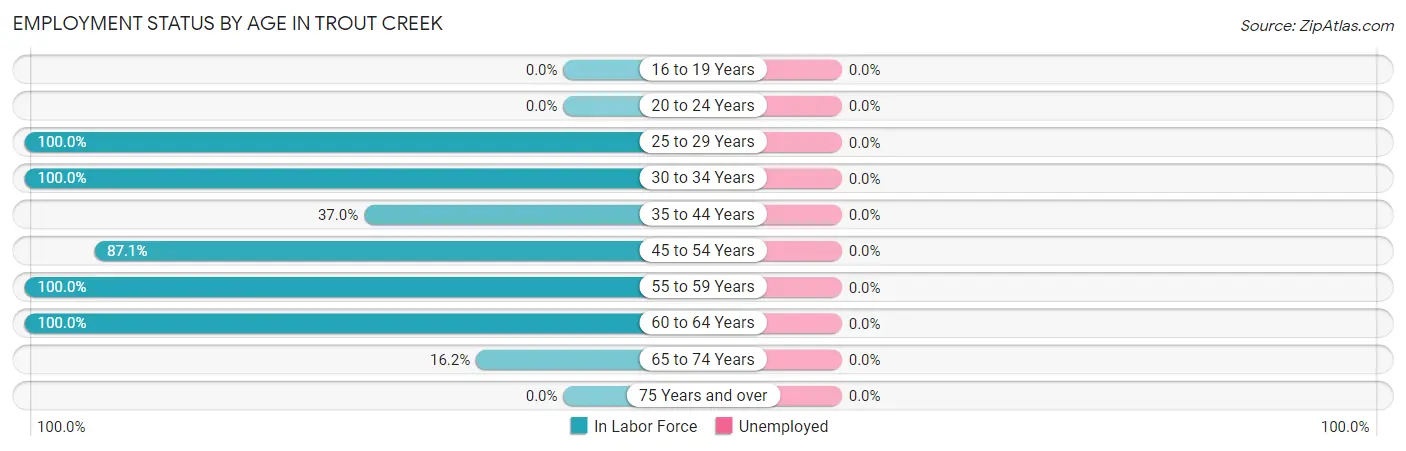
| Age Bracket | In Labor Force | Unemployed |
| 16 to 19 Years | 0 (0.0%) | 0 (0.0%) |
| 20 to 24 Years | 0 (0.0%) | 0 (0.0%) |
| 25 to 29 Years | 10 (100.0%) | 0 (0.0%) |
| 30 to 34 Years | 8 (100.0%) | 0 (0.0%) |
| 35 to 44 Years | 34 (37.0%) | 0 (0.0%) |
| 45 to 54 Years | 27 (87.1%) | 0 (0.0%) |
| 55 to 59 Years | 3 (100.0%) | 0 (0.0%) |
| 60 to 64 Years | 9 (100.0%) | 0 (0.0%) |
| 65 to 74 Years | 12 (16.2%) | 0 (0.0%) |
| 75 Years and over | 0 (0.0%) | 0 (0.0%) |
| Total | 103 (40.4%) | 0 (0.0%) |
Employment Status by Educational Attainment in Trout Creek
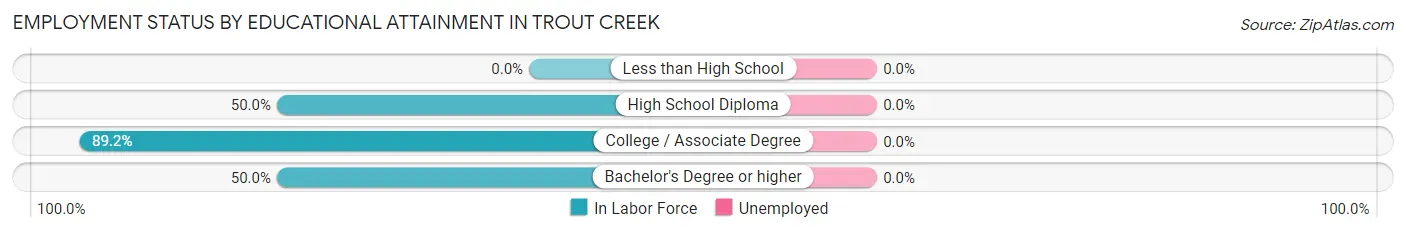
| Educational Attainment | In Labor Force | Unemployed |
| Less than High School | 0 (0.0%) | 0 (0.0%) |
| High School Diploma | 16 (50.0%) | 0 (0.0%) |
| College / Associate Degree | 33 (89.2%) | 0 (0.0%) |
| Bachelor's Degree or higher | 42 (50.0%) | 0 (0.0%) |
| Total | 91 (59.5%) | 0 (0.0%) |
Employment Occupations by Sex in Trout Creek
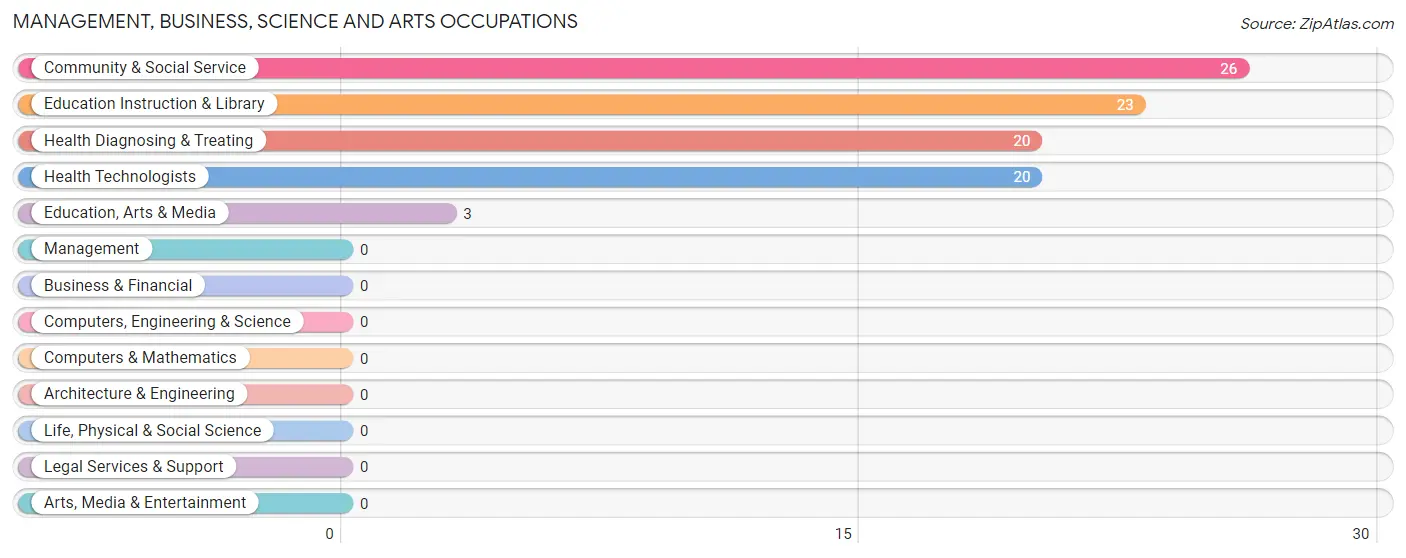
Management, Business, Science and Arts Occupations
The most common Management, Business, Science and Arts occupations in Trout Creek are Community & Social Service (26 | 25.2%), Education Instruction & Library (23 | 22.3%), Health Diagnosing & Treating (20 | 19.4%), Health Technologists (20 | 19.4%), and Education, Arts & Media (3 | 2.9%).
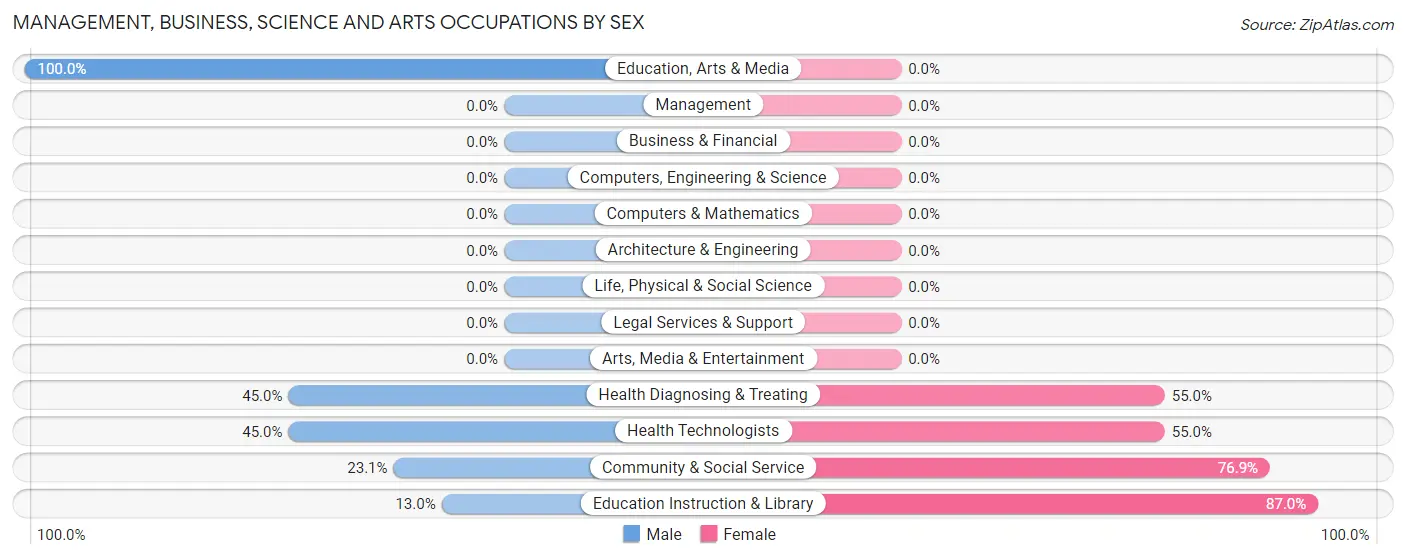
Management, Business, Science and Arts Occupations by Sex
Within the Management, Business, Science and Arts occupations in Trout Creek, the most male-oriented occupations are Education, Arts & Media (100.0%), Health Diagnosing & Treating (45.0%), and Health Technologists (45.0%), while the most female-oriented occupations are Education Instruction & Library (87.0%), Community & Social Service (76.9%), and Health Diagnosing & Treating (55.0%).
| Occupation | Male | Female |
| Management | 0 (0.0%) | 0 (0.0%) |
| Business & Financial | 0 (0.0%) | 0 (0.0%) |
| Computers, Engineering & Science | 0 (0.0%) | 0 (0.0%) |
| Computers & Mathematics | 0 (0.0%) | 0 (0.0%) |
| Architecture & Engineering | 0 (0.0%) | 0 (0.0%) |
| Life, Physical & Social Science | 0 (0.0%) | 0 (0.0%) |
| Community & Social Service | 6 (23.1%) | 20 (76.9%) |
| Education, Arts & Media | 3 (100.0%) | 0 (0.0%) |
| Legal Services & Support | 0 (0.0%) | 0 (0.0%) |
| Education Instruction & Library | 3 (13.0%) | 20 (87.0%) |
| Arts, Media & Entertainment | 0 (0.0%) | 0 (0.0%) |
| Health Diagnosing & Treating | 9 (45.0%) | 11 (55.0%) |
| Health Technologists | 9 (45.0%) | 11 (55.0%) |
| Total (Category) | 15 (32.6%) | 31 (67.4%) |
| Total (Overall) | 50 (48.5%) | 53 (51.5%) |
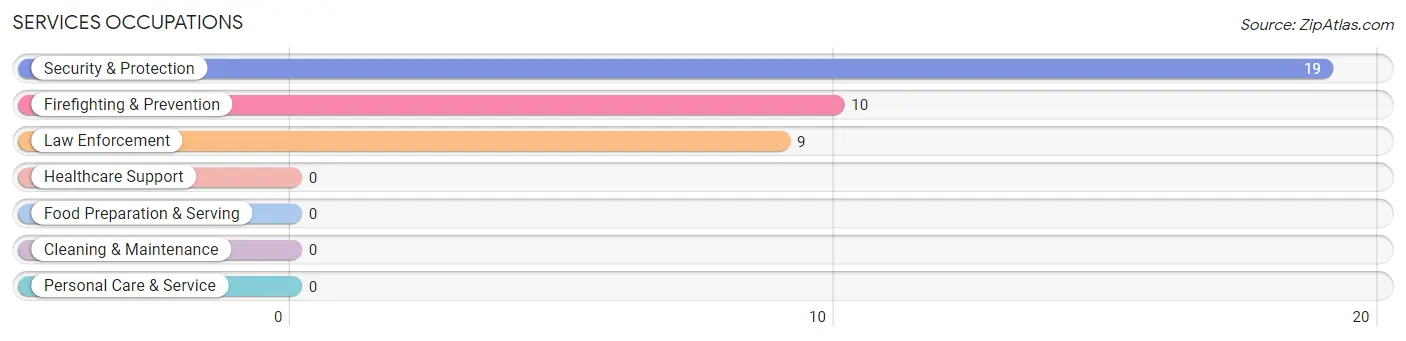
Services Occupations
The most common Services occupations in Trout Creek are Security & Protection (19 | 18.4%), Firefighting & Prevention (10 | 9.7%), and Law Enforcement (9 | 8.7%).
Services Occupations by Sex
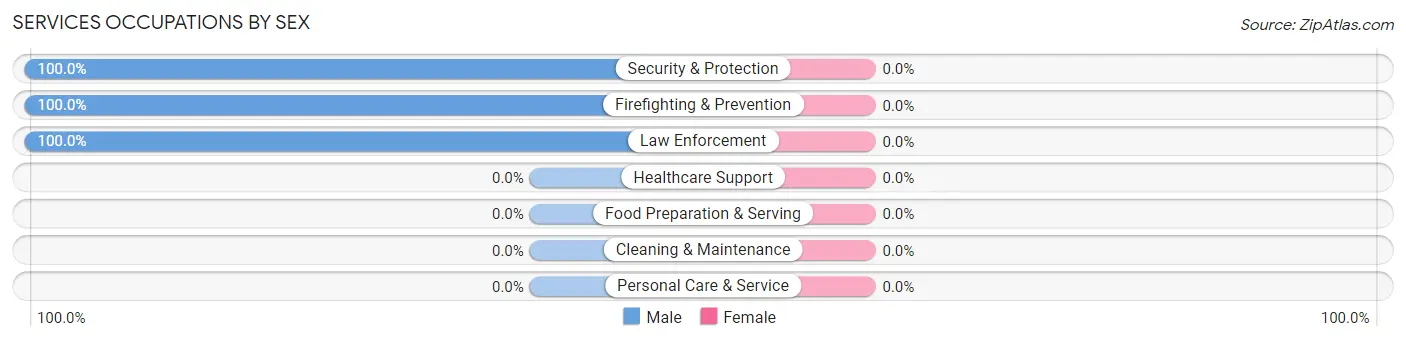
| Occupation | Male | Female |
| Healthcare Support | 0 (0.0%) | 0 (0.0%) |
| Security & Protection | 19 (100.0%) | 0 (0.0%) |
| Firefighting & Prevention | 10 (100.0%) | 0 (0.0%) |
| Law Enforcement | 9 (100.0%) | 0 (0.0%) |
| Food Preparation & Serving | 0 (0.0%) | 0 (0.0%) |
| Cleaning & Maintenance | 0 (0.0%) | 0 (0.0%) |
| Personal Care & Service | 0 (0.0%) | 0 (0.0%) |
| Total (Category) | 19 (100.0%) | 0 (0.0%) |
| Total (Overall) | 50 (48.5%) | 53 (51.5%) |
Sales and Office Occupations
The most common Sales and Office occupations in Trout Creek are Office & Administration (12 | 11.7%), and Sales & Related (10 | 9.7%).
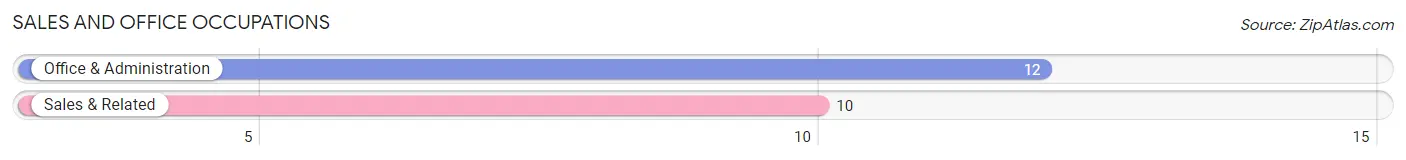
Sales and Office Occupations by Sex
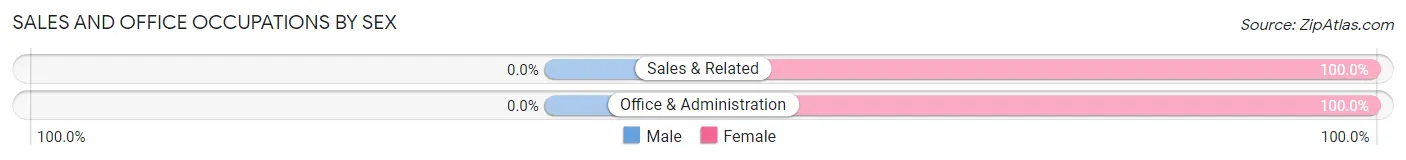
| Occupation | Male | Female |
| Sales & Related | 0 (0.0%) | 10 (100.0%) |
| Office & Administration | 0 (0.0%) | 12 (100.0%) |
| Total (Category) | 0 (0.0%) | 22 (100.0%) |
| Total (Overall) | 50 (48.5%) | 53 (51.5%) |
Natural Resources, Construction and Maintenance Occupations
The most common Natural Resources, Construction and Maintenance occupations in Trout Creek are , and Installation, Maintenance & Repair (16 | 15.5%).
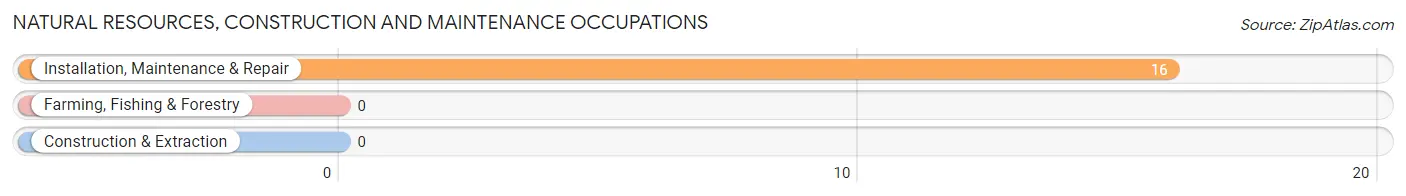
Natural Resources, Construction and Maintenance Occupations by Sex
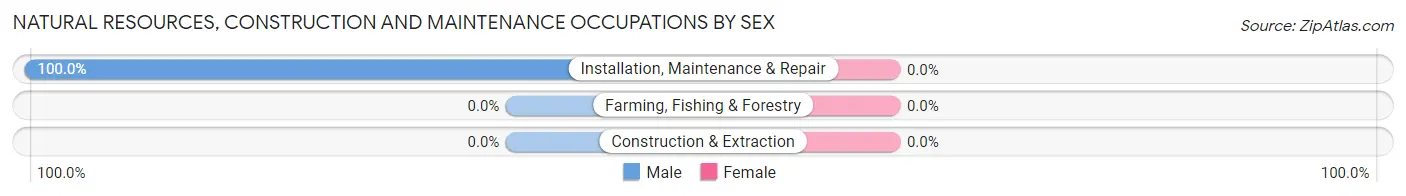
| Occupation | Male | Female |
| Farming, Fishing & Forestry | 0 (0.0%) | 0 (0.0%) |
| Construction & Extraction | 0 (0.0%) | 0 (0.0%) |
| Installation, Maintenance & Repair | 16 (100.0%) | 0 (0.0%) |
| Total (Category) | 16 (100.0%) | 0 (0.0%) |
| Total (Overall) | 50 (48.5%) | 53 (51.5%) |
Production, Transportation and Moving Occupations
Production, Transportation and Moving Occupations by Sex
| Occupation | Male | Female |
| Production | 0 (0.0%) | 0 (0.0%) |
| Transportation | 0 (0.0%) | 0 (0.0%) |
| Material Moving | 0 (0.0%) | 0 (0.0%) |
| Total (Category) | 0 (0.0%) | 0 (0.0%) |
| Total (Overall) | 50 (48.5%) | 53 (51.5%) |
Employment Industries by Sex in Trout Creek
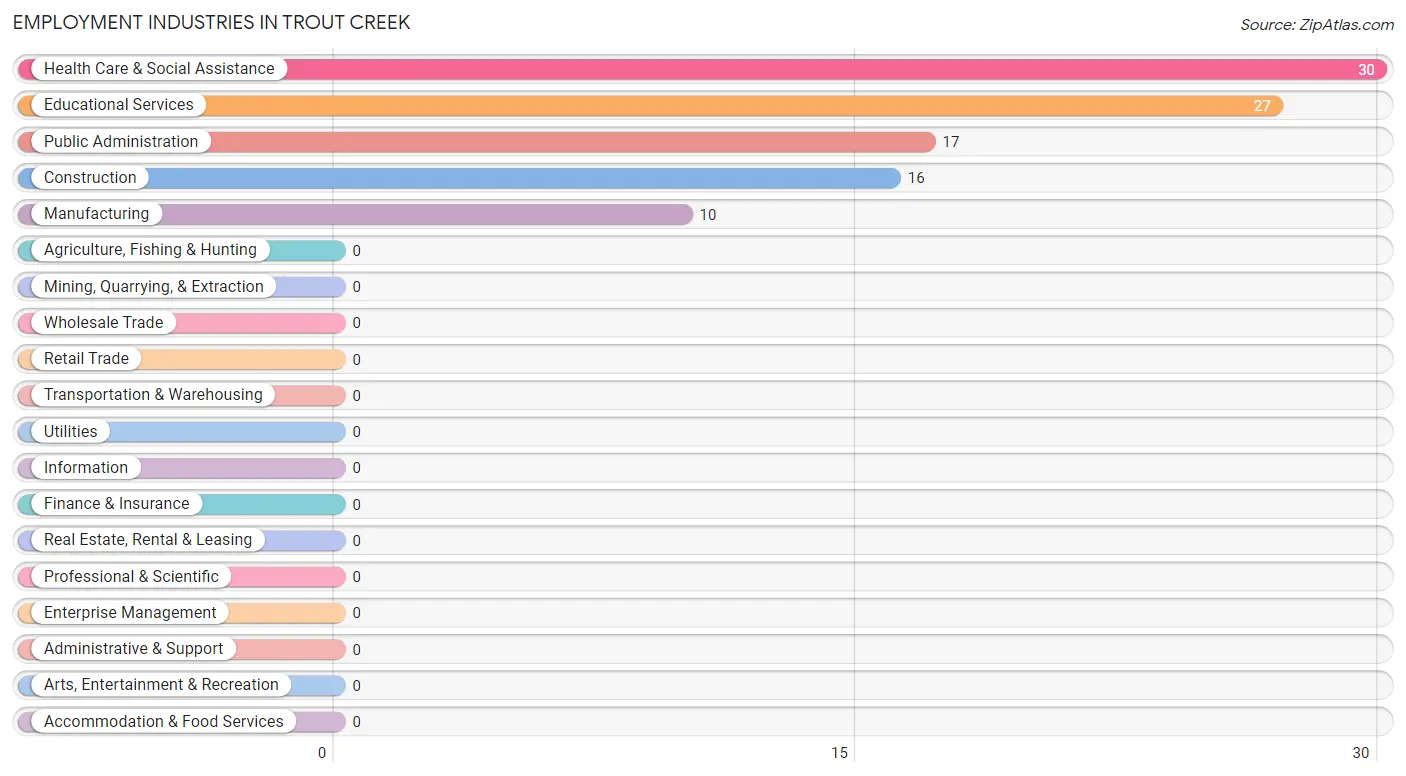
Employment Industries in Trout Creek
The major employment industries in Trout Creek include Health Care & Social Assistance (30 | 29.1%), Educational Services (27 | 26.2%), Public Administration (17 | 16.5%), Construction (16 | 15.5%), and Manufacturing (10 | 9.7%).
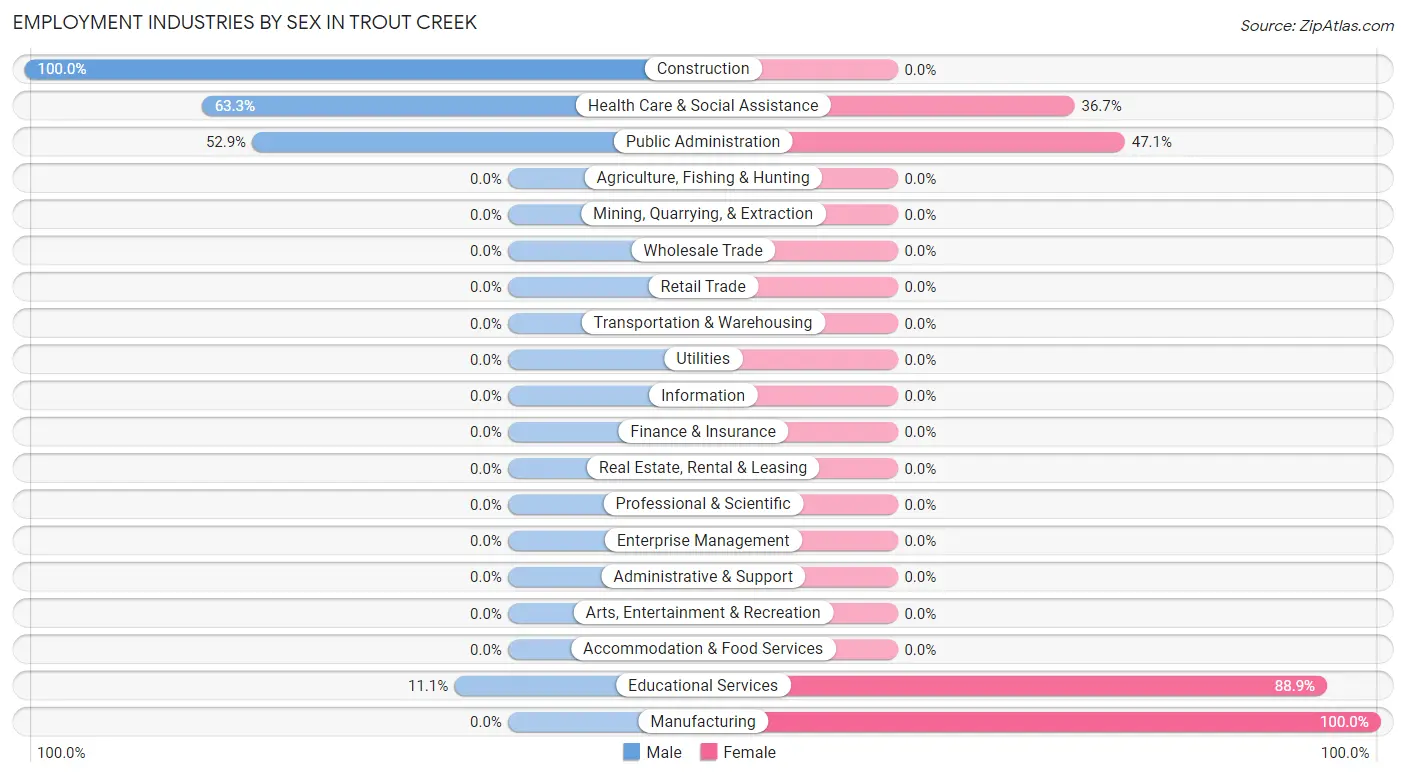
Employment Industries by Sex in Trout Creek
The Trout Creek industries that see more men than women are Construction (100.0%), Health Care & Social Assistance (63.3%), and Public Administration (52.9%), whereas the industries that tend to have a higher number of women are Manufacturing (100.0%), Educational Services (88.9%), and Public Administration (47.1%).
| Industry | Male | Female |
| Agriculture, Fishing & Hunting | 0 (0.0%) | 0 (0.0%) |
| Mining, Quarrying, & Extraction | 0 (0.0%) | 0 (0.0%) |
| Construction | 16 (100.0%) | 0 (0.0%) |
| Manufacturing | 0 (0.0%) | 10 (100.0%) |
| Wholesale Trade | 0 (0.0%) | 0 (0.0%) |
| Retail Trade | 0 (0.0%) | 0 (0.0%) |
| Transportation & Warehousing | 0 (0.0%) | 0 (0.0%) |
| Utilities | 0 (0.0%) | 0 (0.0%) |
| Information | 0 (0.0%) | 0 (0.0%) |
| Finance & Insurance | 0 (0.0%) | 0 (0.0%) |
| Real Estate, Rental & Leasing | 0 (0.0%) | 0 (0.0%) |
| Professional & Scientific | 0 (0.0%) | 0 (0.0%) |
| Enterprise Management | 0 (0.0%) | 0 (0.0%) |
| Administrative & Support | 0 (0.0%) | 0 (0.0%) |
| Educational Services | 3 (11.1%) | 24 (88.9%) |
| Health Care & Social Assistance | 19 (63.3%) | 11 (36.7%) |
| Arts, Entertainment & Recreation | 0 (0.0%) | 0 (0.0%) |
| Accommodation & Food Services | 0 (0.0%) | 0 (0.0%) |
| Public Administration | 9 (52.9%) | 8 (47.1%) |
| Total | 50 (48.5%) | 53 (51.5%) |
Education in Trout Creek
School Enrollment in Trout Creek
The most common levels of schooling among the 49 students in Trout Creek are middle school (18 | 36.7%), elementary school (13 | 26.5%), and high school (12 | 24.5%).
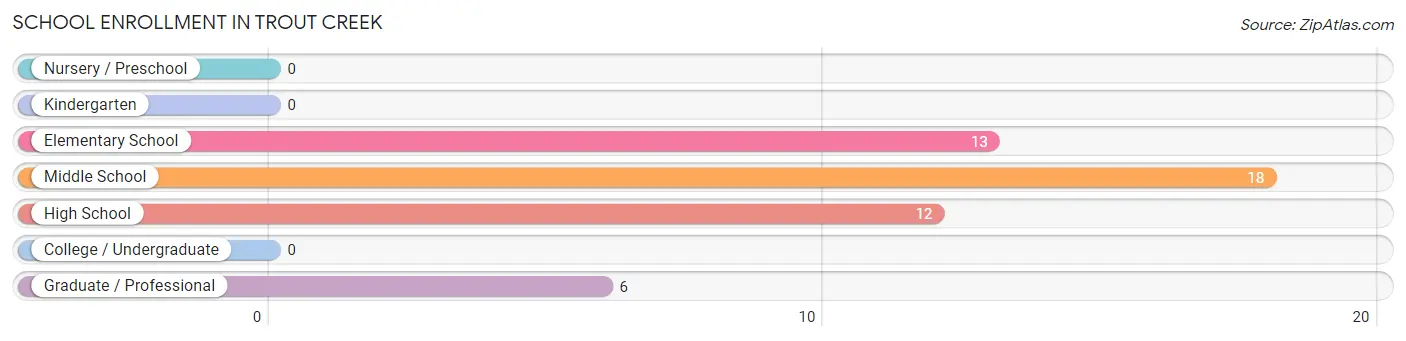
| School Level | # Students | % Students |
| Nursery / Preschool | 0 | 0.0% |
| Kindergarten | 0 | 0.0% |
| Elementary School | 13 | 26.5% |
| Middle School | 18 | 36.7% |
| High School | 12 | 24.5% |
| College / Undergraduate | 0 | 0.0% |
| Graduate / Professional | 6 | 12.2% |
| Total | 49 | 100.0% |
School Enrollment by Age by Funding Source in Trout Creek
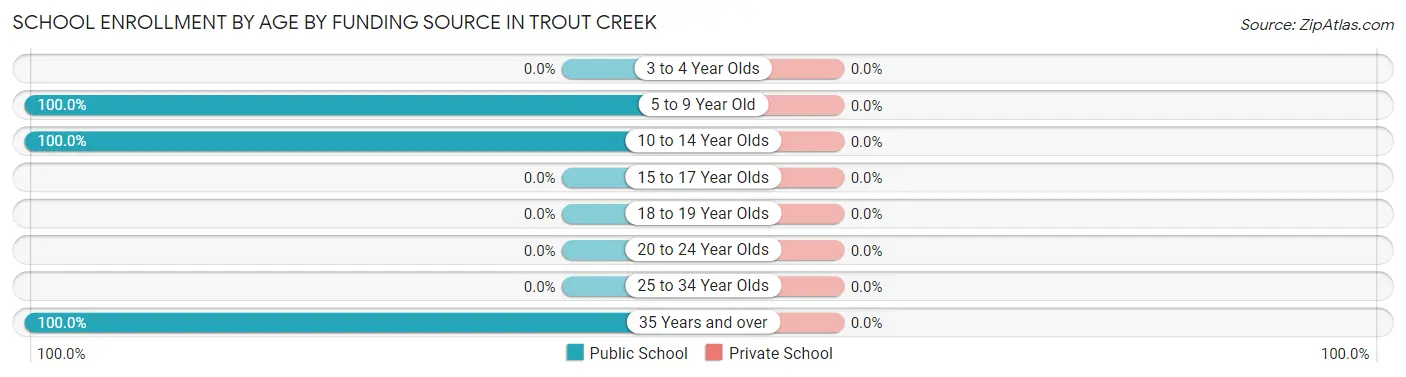
| Age Bracket | Public School | Private School |
| 3 to 4 Year Olds | 0 (0.0%) | 0 (0.0%) |
| 5 to 9 Year Old | 13 (100.0%) | 0 (0.0%) |
| 10 to 14 Year Olds | 30 (100.0%) | 0 (0.0%) |
| 15 to 17 Year Olds | 0 (0.0%) | 0 (0.0%) |
| 18 to 19 Year Olds | 0 (0.0%) | 0 (0.0%) |
| 20 to 24 Year Olds | 0 (0.0%) | 0 (0.0%) |
| 25 to 34 Year Olds | 0 (0.0%) | 0 (0.0%) |
| 35 Years and over | 6 (100.0%) | 0 (0.0%) |
| Total | 49 (100.0%) | 0 (0.0%) |
Educational Attainment by Field of Study in Trout Creek
Arts & humanities (42 | 44.7%), bio, nature & agricultural (15 | 16.0%), psychology (15 | 16.0%), social sciences (10 | 10.6%), and education (6 | 6.4%) are the most common fields of study among 94 individuals in Trout Creek who have obtained a bachelor's degree or higher.
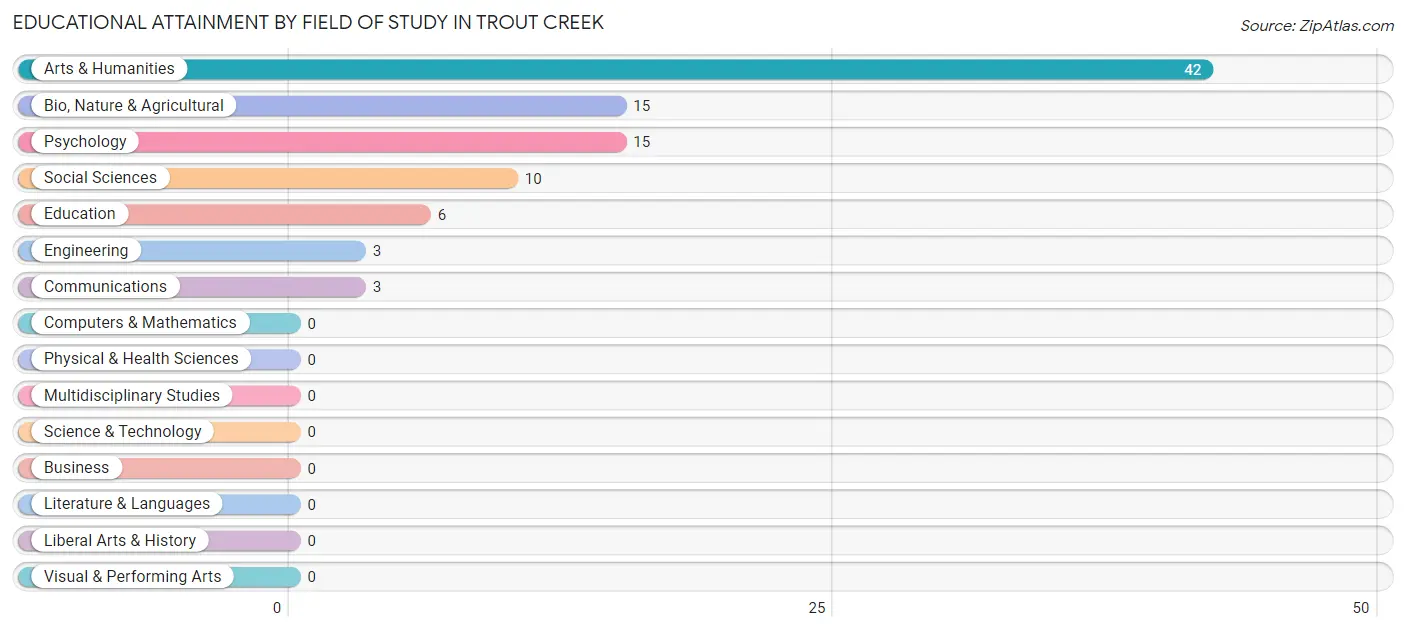
| Field of Study | # Graduates | % Graduates |
| Computers & Mathematics | 0 | 0.0% |
| Bio, Nature & Agricultural | 15 | 16.0% |
| Physical & Health Sciences | 0 | 0.0% |
| Psychology | 15 | 16.0% |
| Social Sciences | 10 | 10.6% |
| Engineering | 3 | 3.2% |
| Multidisciplinary Studies | 0 | 0.0% |
| Science & Technology | 0 | 0.0% |
| Business | 0 | 0.0% |
| Education | 6 | 6.4% |
| Literature & Languages | 0 | 0.0% |
| Liberal Arts & History | 0 | 0.0% |
| Visual & Performing Arts | 0 | 0.0% |
| Communications | 3 | 3.2% |
| Arts & Humanities | 42 | 44.7% |
| Total | 94 | 100.0% |
Transportation & Commute in Trout Creek
Vehicle Availability by Sex in Trout Creek
The most prevalent vehicle ownership categories in Trout Creek are males with 2 vehicles (29, accounting for 58.0%) and females with 2 vehicles (17, making up 54.7%).
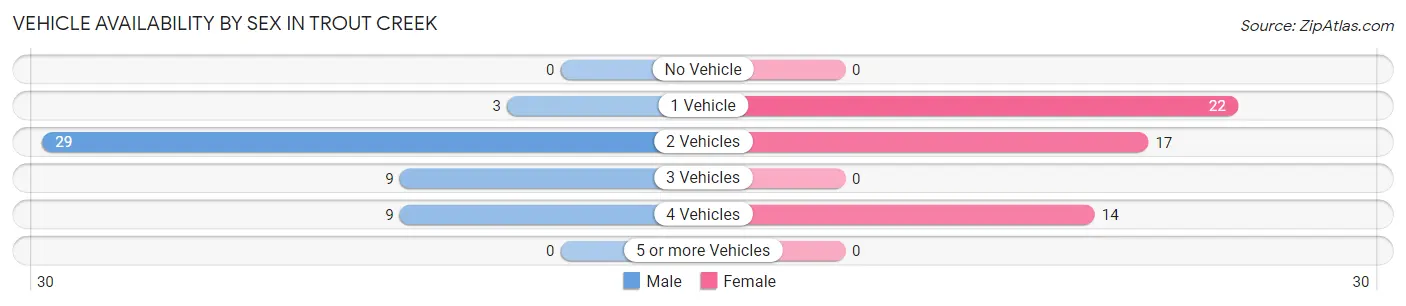
| Vehicles Available | Male | Female |
| No Vehicle | 0 (0.0%) | 0 (0.0%) |
| 1 Vehicle | 3 (6.0%) | 22 (41.5%) |
| 2 Vehicles | 29 (58.0%) | 17 (32.1%) |
| 3 Vehicles | 9 (18.0%) | 0 (0.0%) |
| 4 Vehicles | 9 (18.0%) | 14 (26.4%) |
| 5 or more Vehicles | 0 (0.0%) | 0 (0.0%) |
| Total | 50 (100.0%) | 53 (100.0%) |
Commute Time in Trout Creek
The most frequently occuring commute durations in Trout Creek are 5 to 9 minutes (30 commuters, 32.3%), less than 5 minutes (26 commuters, 28.0%), and 25 to 29 minutes (26 commuters, 28.0%).
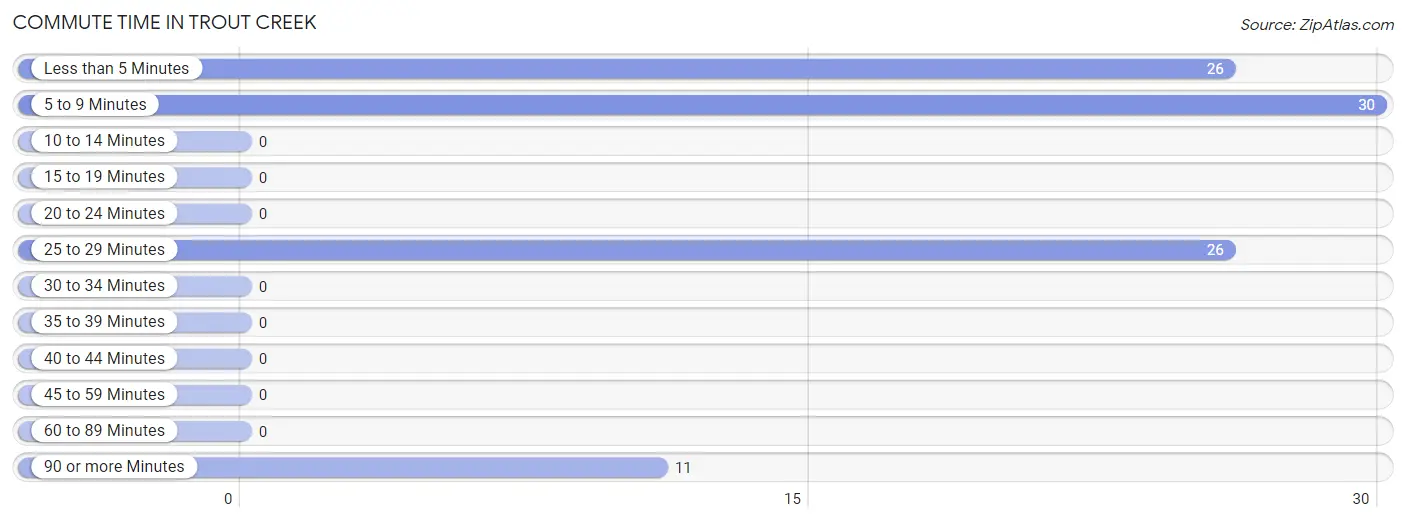
| Commute Time | # Commuters | % Commuters |
| Less than 5 Minutes | 26 | 28.0% |
| 5 to 9 Minutes | 30 | 32.3% |
| 10 to 14 Minutes | 0 | 0.0% |
| 15 to 19 Minutes | 0 | 0.0% |
| 20 to 24 Minutes | 0 | 0.0% |
| 25 to 29 Minutes | 26 | 28.0% |
| 30 to 34 Minutes | 0 | 0.0% |
| 35 to 39 Minutes | 0 | 0.0% |
| 40 to 44 Minutes | 0 | 0.0% |
| 45 to 59 Minutes | 0 | 0.0% |
| 60 to 89 Minutes | 0 | 0.0% |
| 90 or more Minutes | 11 | 11.8% |
Commute Time by Sex in Trout Creek
The most common commute times in Trout Creek are 25 to 29 minutes (18 commuters, 36.0%) for males and 5 to 9 minutes (14 commuters, 32.6%) for females.
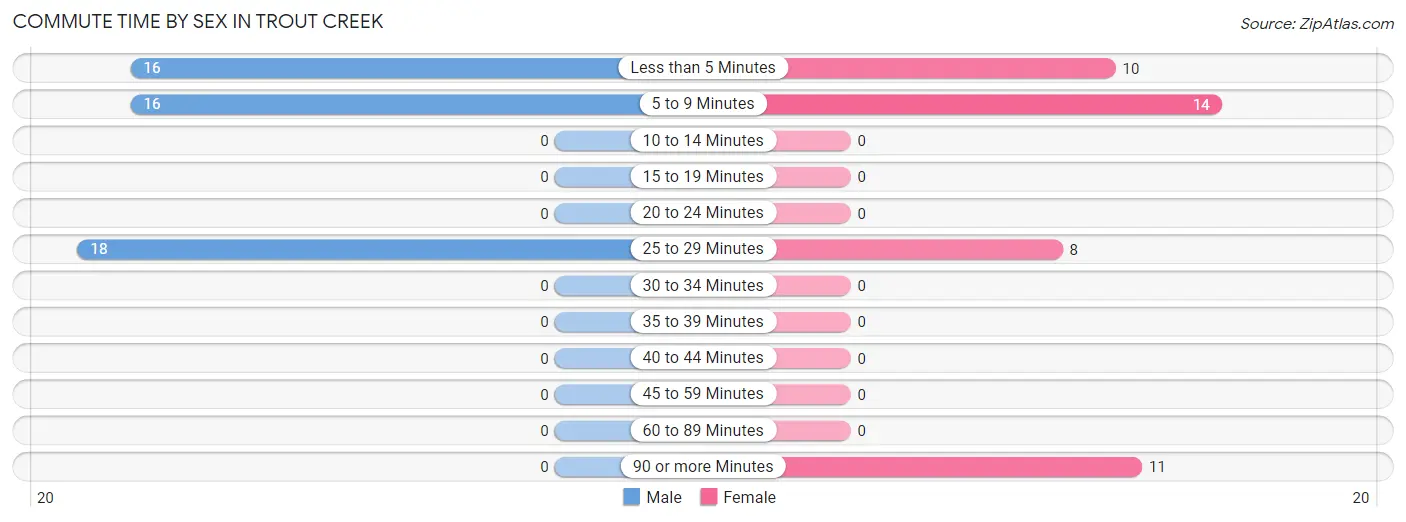
| Commute Time | Male | Female |
| Less than 5 Minutes | 16 (32.0%) | 10 (23.3%) |
| 5 to 9 Minutes | 16 (32.0%) | 14 (32.6%) |
| 10 to 14 Minutes | 0 (0.0%) | 0 (0.0%) |
| 15 to 19 Minutes | 0 (0.0%) | 0 (0.0%) |
| 20 to 24 Minutes | 0 (0.0%) | 0 (0.0%) |
| 25 to 29 Minutes | 18 (36.0%) | 8 (18.6%) |
| 30 to 34 Minutes | 0 (0.0%) | 0 (0.0%) |
| 35 to 39 Minutes | 0 (0.0%) | 0 (0.0%) |
| 40 to 44 Minutes | 0 (0.0%) | 0 (0.0%) |
| 45 to 59 Minutes | 0 (0.0%) | 0 (0.0%) |
| 60 to 89 Minutes | 0 (0.0%) | 0 (0.0%) |
| 90 or more Minutes | 0 (0.0%) | 11 (25.6%) |
Time of Departure to Work by Sex in Trout Creek
The most frequent times of departure to work in Trout Creek are 9:00 AM to 9:59 AM (16, 32.0%) for males and 7:00 AM to 7:29 AM (18, 41.9%) for females.
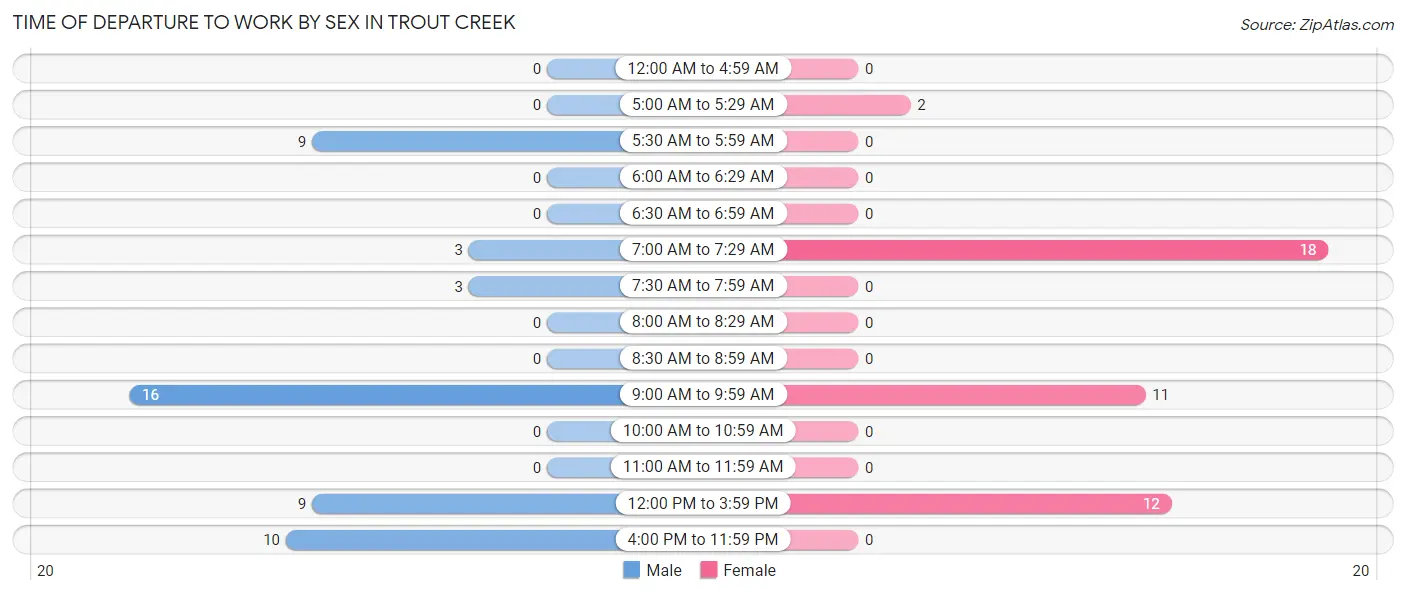
| Time of Departure | Male | Female |
| 12:00 AM to 4:59 AM | 0 (0.0%) | 0 (0.0%) |
| 5:00 AM to 5:29 AM | 0 (0.0%) | 2 (4.6%) |
| 5:30 AM to 5:59 AM | 9 (18.0%) | 0 (0.0%) |
| 6:00 AM to 6:29 AM | 0 (0.0%) | 0 (0.0%) |
| 6:30 AM to 6:59 AM | 0 (0.0%) | 0 (0.0%) |
| 7:00 AM to 7:29 AM | 3 (6.0%) | 18 (41.9%) |
| 7:30 AM to 7:59 AM | 3 (6.0%) | 0 (0.0%) |
| 8:00 AM to 8:29 AM | 0 (0.0%) | 0 (0.0%) |
| 8:30 AM to 8:59 AM | 0 (0.0%) | 0 (0.0%) |
| 9:00 AM to 9:59 AM | 16 (32.0%) | 11 (25.6%) |
| 10:00 AM to 10:59 AM | 0 (0.0%) | 0 (0.0%) |
| 11:00 AM to 11:59 AM | 0 (0.0%) | 0 (0.0%) |
| 12:00 PM to 3:59 PM | 9 (18.0%) | 12 (27.9%) |
| 4:00 PM to 11:59 PM | 10 (20.0%) | 0 (0.0%) |
| Total | 50 (100.0%) | 43 (100.0%) |
Housing Occupancy in Trout Creek
Occupancy by Ownership in Trout Creek
Of the total 117 dwellings in Trout Creek, owner-occupied units account for 110 (94.0%), while renter-occupied units make up 7 (6.0%).
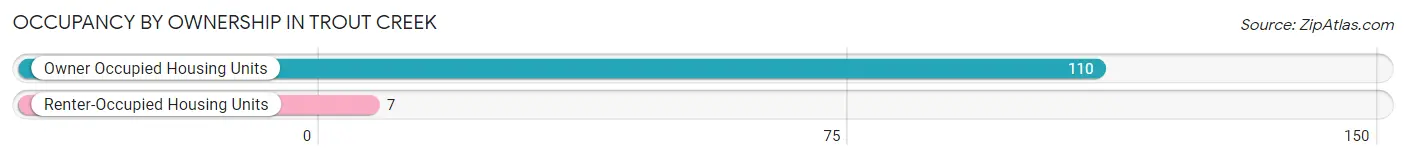
| Occupancy | # Housing Units | % Housing Units |
| Owner Occupied Housing Units | 110 | 94.0% |
| Renter-Occupied Housing Units | 7 | 6.0% |
| Total Occupied Housing Units | 117 | 100.0% |
Occupancy by Household Size in Trout Creek
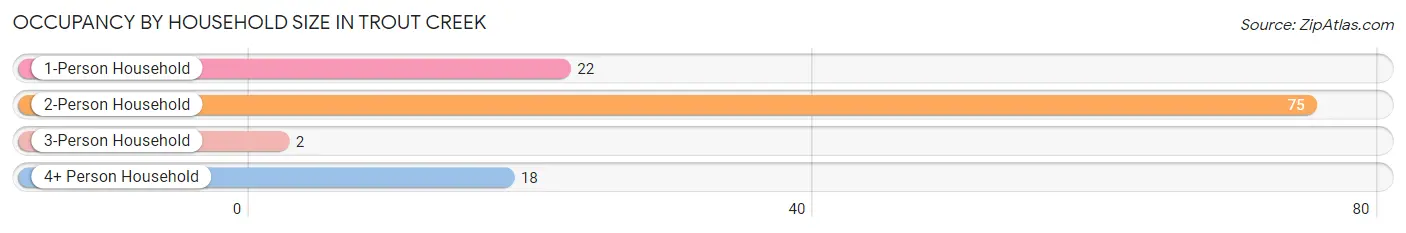
| Household Size | # Housing Units | % Housing Units |
| 1-Person Household | 22 | 18.8% |
| 2-Person Household | 75 | 64.1% |
| 3-Person Household | 2 | 1.7% |
| 4+ Person Household | 18 | 15.4% |
| Total Housing Units | 117 | 100.0% |
Occupancy by Ownership by Household Size in Trout Creek
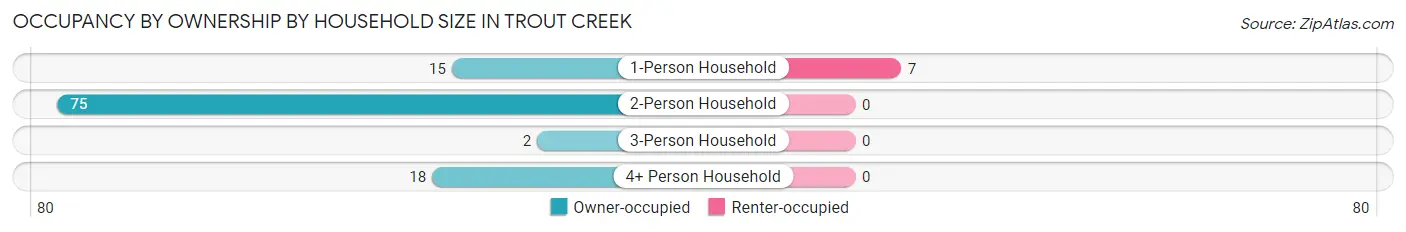
| Household Size | Owner-occupied | Renter-occupied |
| 1-Person Household | 15 (68.2%) | 7 (31.8%) |
| 2-Person Household | 75 (100.0%) | 0 (0.0%) |
| 3-Person Household | 2 (100.0%) | 0 (0.0%) |
| 4+ Person Household | 18 (100.0%) | 0 (0.0%) |
| Total Housing Units | 110 (94.0%) | 7 (6.0%) |
Occupancy by Educational Attainment in Trout Creek
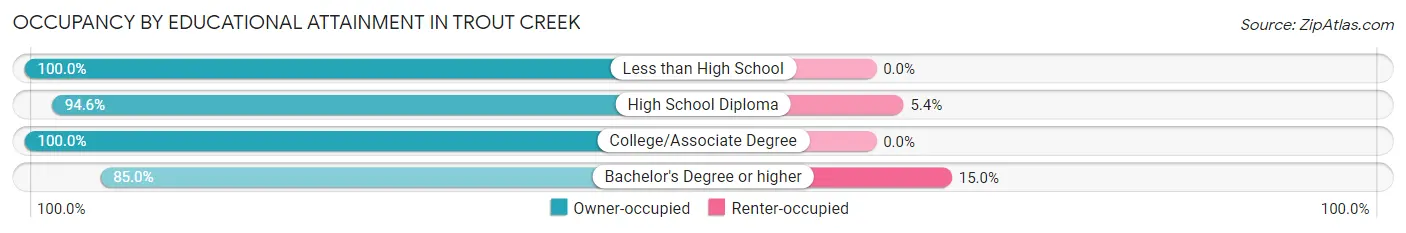
| Household Size | Owner-occupied | Renter-occupied |
| Less than High School | 2 (100.0%) | 0 (0.0%) |
| High School Diploma | 70 (94.6%) | 4 (5.4%) |
| College/Associate Degree | 21 (100.0%) | 0 (0.0%) |
| Bachelor's Degree or higher | 17 (85.0%) | 3 (15.0%) |
Occupancy by Age of Householder in Trout Creek
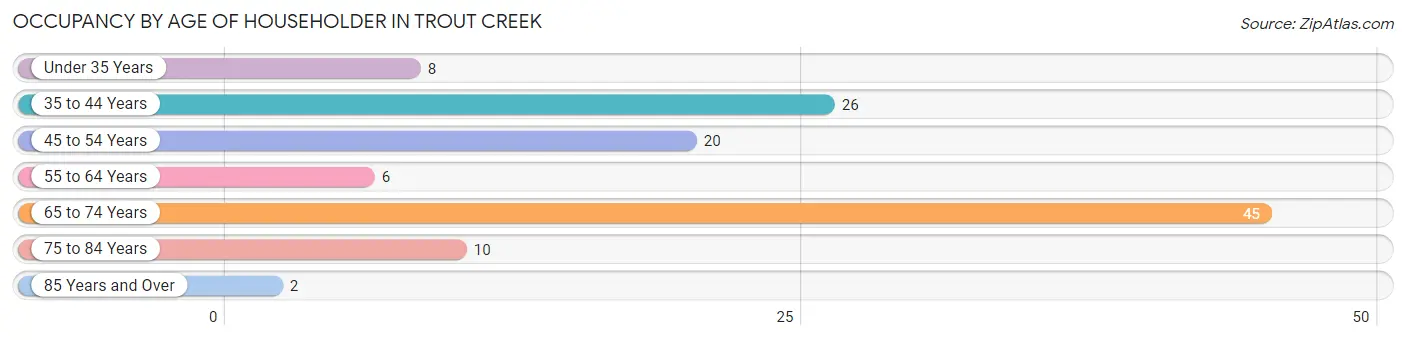
| Age Bracket | # Households | % Households |
| Under 35 Years | 8 | 6.8% |
| 35 to 44 Years | 26 | 22.2% |
| 45 to 54 Years | 20 | 17.1% |
| 55 to 64 Years | 6 | 5.1% |
| 65 to 74 Years | 45 | 38.5% |
| 75 to 84 Years | 10 | 8.6% |
| 85 Years and Over | 2 | 1.7% |
| Total | 117 | 100.0% |
Housing Finances in Trout Creek
Median Income by Occupancy in Trout Creek
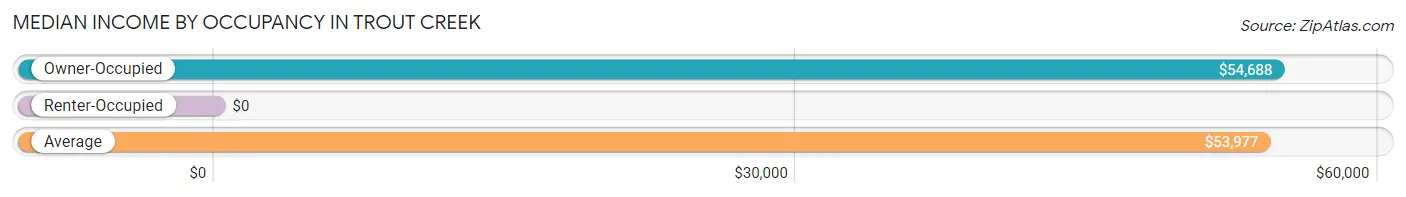
| Occupancy Type | # Households | Median Income |
| Owner-Occupied | 110 (94.0%) | $54,688 |
| Renter-Occupied | 7 (6.0%) | $0 |
| Average | 117 (100.0%) | $53,977 |
Occupancy by Householder Income Bracket in Trout Creek
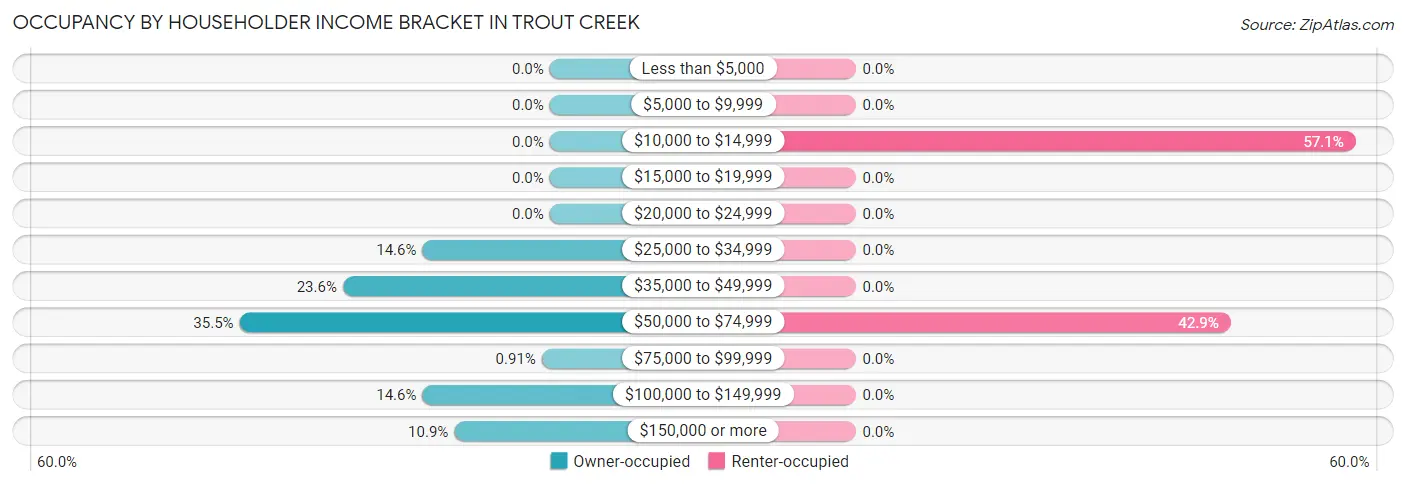
| Income Bracket | Owner-occupied | Renter-occupied |
| Less than $5,000 | 0 (0.0%) | 0 (0.0%) |
| $5,000 to $9,999 | 0 (0.0%) | 0 (0.0%) |
| $10,000 to $14,999 | 0 (0.0%) | 4 (57.1%) |
| $15,000 to $19,999 | 0 (0.0%) | 0 (0.0%) |
| $20,000 to $24,999 | 0 (0.0%) | 0 (0.0%) |
| $25,000 to $34,999 | 16 (14.5%) | 0 (0.0%) |
| $35,000 to $49,999 | 26 (23.6%) | 0 (0.0%) |
| $50,000 to $74,999 | 39 (35.4%) | 3 (42.9%) |
| $75,000 to $99,999 | 1 (0.9%) | 0 (0.0%) |
| $100,000 to $149,999 | 16 (14.5%) | 0 (0.0%) |
| $150,000 or more | 12 (10.9%) | 0 (0.0%) |
| Total | 110 (100.0%) | 7 (100.0%) |
Monthly Housing Cost Tiers in Trout Creek
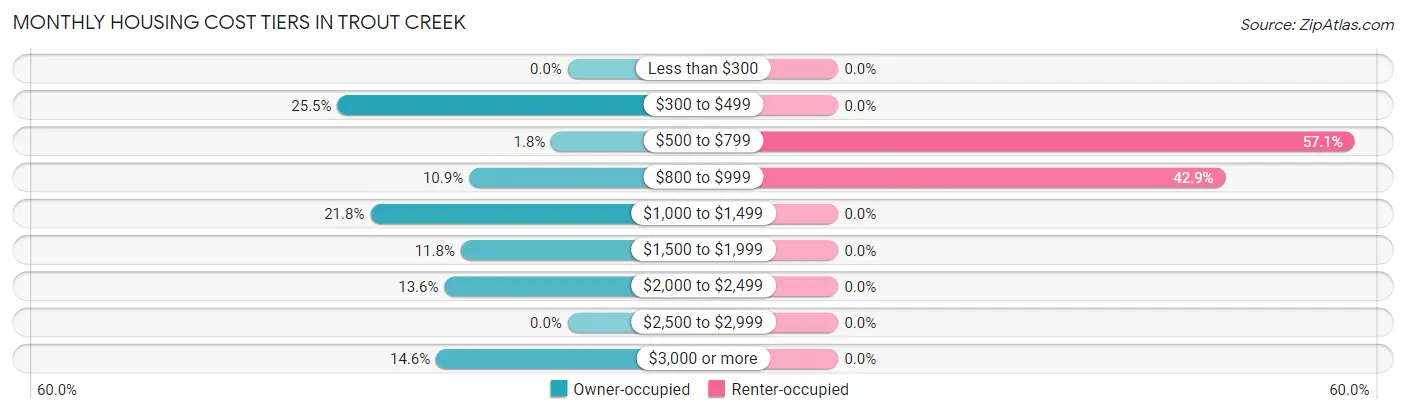
| Monthly Cost | Owner-occupied | Renter-occupied |
| Less than $300 | 0 (0.0%) | 0 (0.0%) |
| $300 to $499 | 28 (25.5%) | 0 (0.0%) |
| $500 to $799 | 2 (1.8%) | 4 (57.1%) |
| $800 to $999 | 12 (10.9%) | 3 (42.9%) |
| $1,000 to $1,499 | 24 (21.8%) | 0 (0.0%) |
| $1,500 to $1,999 | 13 (11.8%) | 0 (0.0%) |
| $2,000 to $2,499 | 15 (13.6%) | 0 (0.0%) |
| $2,500 to $2,999 | 0 (0.0%) | 0 (0.0%) |
| $3,000 or more | 16 (14.5%) | 0 (0.0%) |
| Total | 110 (100.0%) | 7 (100.0%) |
Physical Housing Characteristics in Trout Creek
Housing Structures in Trout Creek
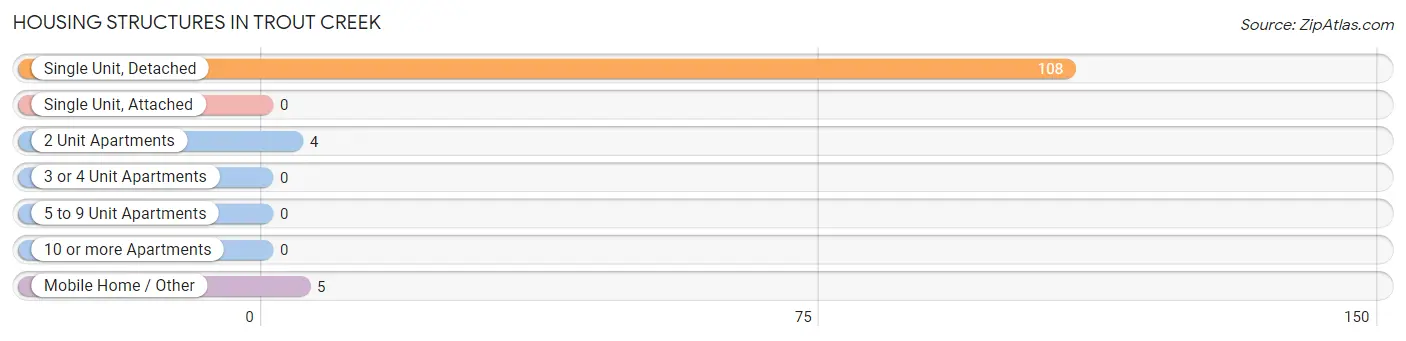
| Structure Type | # Housing Units | % Housing Units |
| Single Unit, Detached | 108 | 92.3% |
| Single Unit, Attached | 0 | 0.0% |
| 2 Unit Apartments | 4 | 3.4% |
| 3 or 4 Unit Apartments | 0 | 0.0% |
| 5 to 9 Unit Apartments | 0 | 0.0% |
| 10 or more Apartments | 0 | 0.0% |
| Mobile Home / Other | 5 | 4.3% |
| Total | 117 | 100.0% |
Housing Structures by Occupancy in Trout Creek
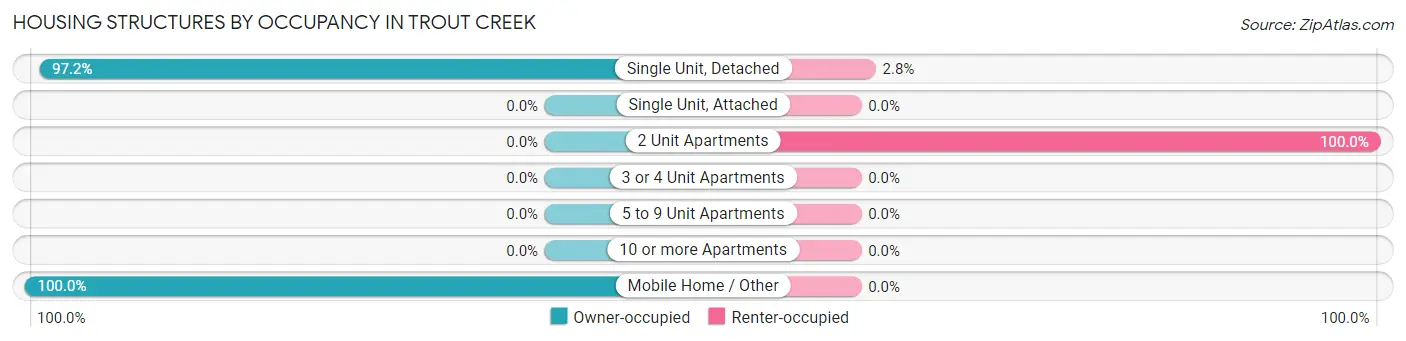
| Structure Type | Owner-occupied | Renter-occupied |
| Single Unit, Detached | 105 (97.2%) | 3 (2.8%) |
| Single Unit, Attached | 0 (0.0%) | 0 (0.0%) |
| 2 Unit Apartments | 0 (0.0%) | 4 (100.0%) |
| 3 or 4 Unit Apartments | 0 (0.0%) | 0 (0.0%) |
| 5 to 9 Unit Apartments | 0 (0.0%) | 0 (0.0%) |
| 10 or more Apartments | 0 (0.0%) | 0 (0.0%) |
| Mobile Home / Other | 5 (100.0%) | 0 (0.0%) |
| Total | 110 (94.0%) | 7 (6.0%) |
Housing Structures by Number of Rooms in Trout Creek
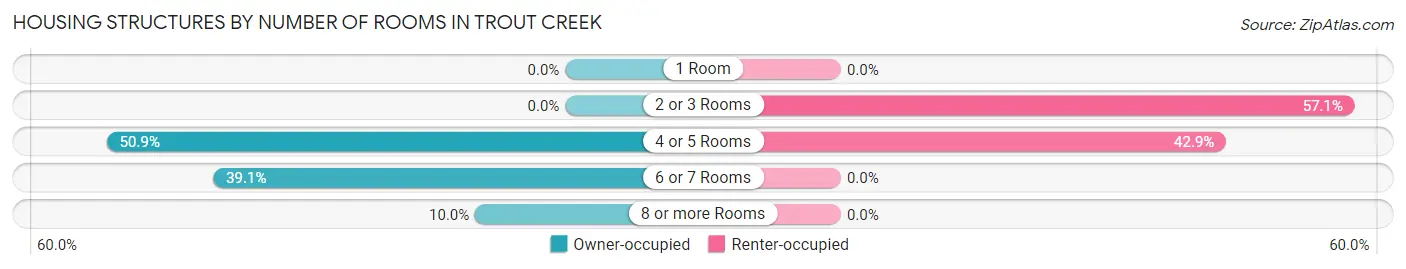
| Number of Rooms | Owner-occupied | Renter-occupied |
| 1 Room | 0 (0.0%) | 0 (0.0%) |
| 2 or 3 Rooms | 0 (0.0%) | 4 (57.1%) |
| 4 or 5 Rooms | 56 (50.9%) | 3 (42.9%) |
| 6 or 7 Rooms | 43 (39.1%) | 0 (0.0%) |
| 8 or more Rooms | 11 (10.0%) | 0 (0.0%) |
| Total | 110 (100.0%) | 7 (100.0%) |
Housing Structure by Heating Type in Trout Creek
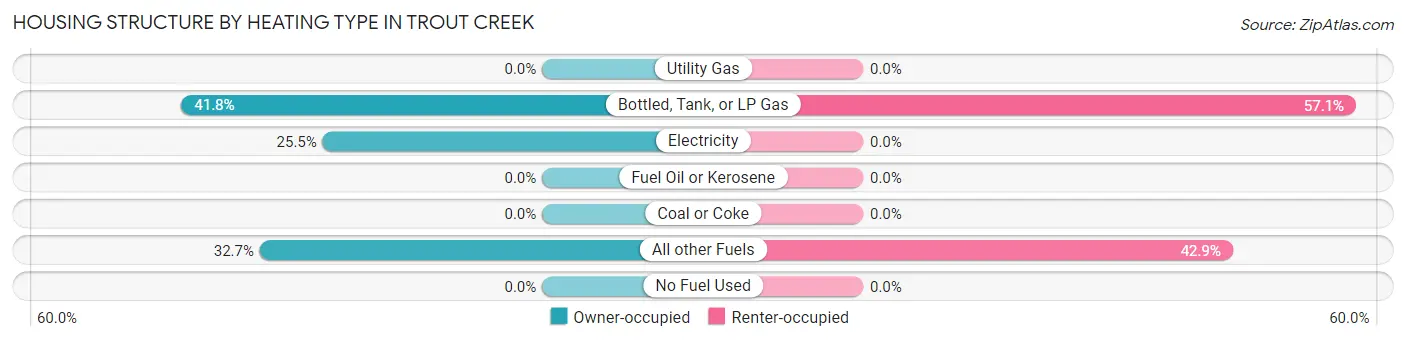
| Heating Type | Owner-occupied | Renter-occupied |
| Utility Gas | 0 (0.0%) | 0 (0.0%) |
| Bottled, Tank, or LP Gas | 46 (41.8%) | 4 (57.1%) |
| Electricity | 28 (25.5%) | 0 (0.0%) |
| Fuel Oil or Kerosene | 0 (0.0%) | 0 (0.0%) |
| Coal or Coke | 0 (0.0%) | 0 (0.0%) |
| All other Fuels | 36 (32.7%) | 3 (42.9%) |
| No Fuel Used | 0 (0.0%) | 0 (0.0%) |
| Total | 110 (100.0%) | 7 (100.0%) |
Household Vehicle Usage in Trout Creek
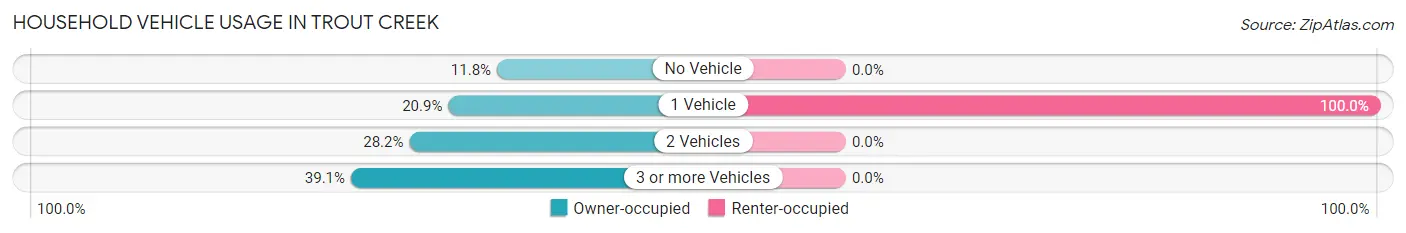
| Vehicles per Household | Owner-occupied | Renter-occupied |
| No Vehicle | 13 (11.8%) | 0 (0.0%) |
| 1 Vehicle | 23 (20.9%) | 7 (100.0%) |
| 2 Vehicles | 31 (28.2%) | 0 (0.0%) |
| 3 or more Vehicles | 43 (39.1%) | 0 (0.0%) |
| Total | 110 (100.0%) | 7 (100.0%) |
Real Estate & Mortgages in Trout Creek
Real Estate and Mortgage Overview in Trout Creek
| Characteristic | Without Mortgage | With Mortgage |
| Housing Units | 29 | 81 |
| Median Property Value | - | - |
| Median Household Income | $46,477 | $12 |
| Monthly Housing Costs | $398 | $16 |
| Real Estate Taxes | $1,827 | $0 |
Property Value by Mortgage Status in Trout Creek
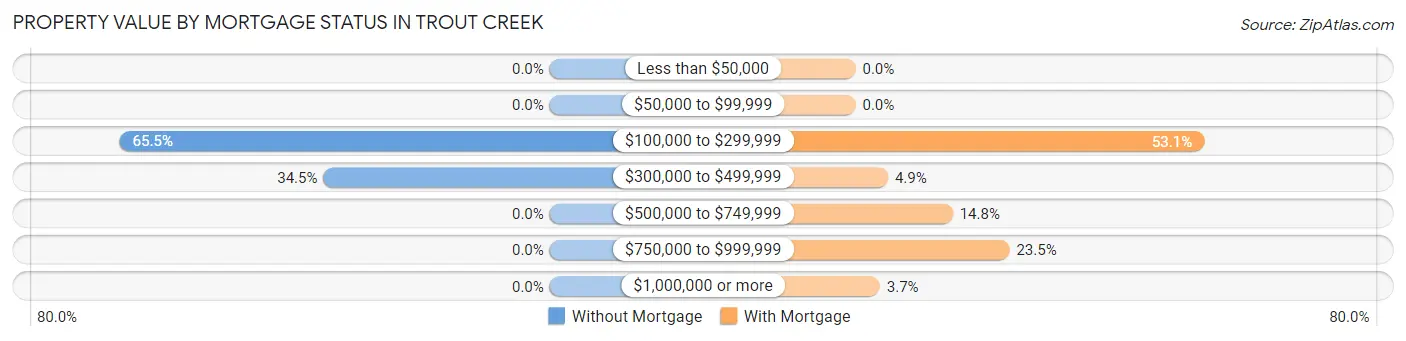
| Property Value | Without Mortgage | With Mortgage |
| Less than $50,000 | 0 (0.0%) | 0 (0.0%) |
| $50,000 to $99,999 | 0 (0.0%) | 0 (0.0%) |
| $100,000 to $299,999 | 19 (65.5%) | 43 (53.1%) |
| $300,000 to $499,999 | 10 (34.5%) | 4 (4.9%) |
| $500,000 to $749,999 | 0 (0.0%) | 12 (14.8%) |
| $750,000 to $999,999 | 0 (0.0%) | 19 (23.5%) |
| $1,000,000 or more | 0 (0.0%) | 3 (3.7%) |
| Total | 29 (100.0%) | 81 (100.0%) |
Household Income by Mortgage Status in Trout Creek
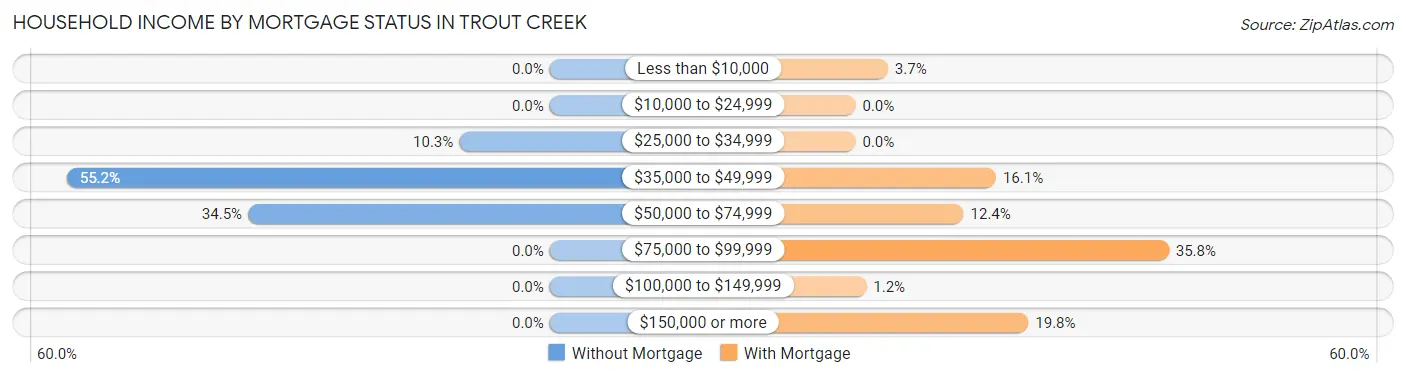
| Household Income | Without Mortgage | With Mortgage |
| Less than $10,000 | 0 (0.0%) | 3 (3.7%) |
| $10,000 to $24,999 | 0 (0.0%) | 0 (0.0%) |
| $25,000 to $34,999 | 3 (10.3%) | 0 (0.0%) |
| $35,000 to $49,999 | 16 (55.2%) | 13 (16.1%) |
| $50,000 to $74,999 | 10 (34.5%) | 10 (12.3%) |
| $75,000 to $99,999 | 0 (0.0%) | 29 (35.8%) |
| $100,000 to $149,999 | 0 (0.0%) | 1 (1.2%) |
| $150,000 or more | 0 (0.0%) | 16 (19.8%) |
| Total | 29 (100.0%) | 81 (100.0%) |
Property Value to Household Income Ratio in Trout Creek
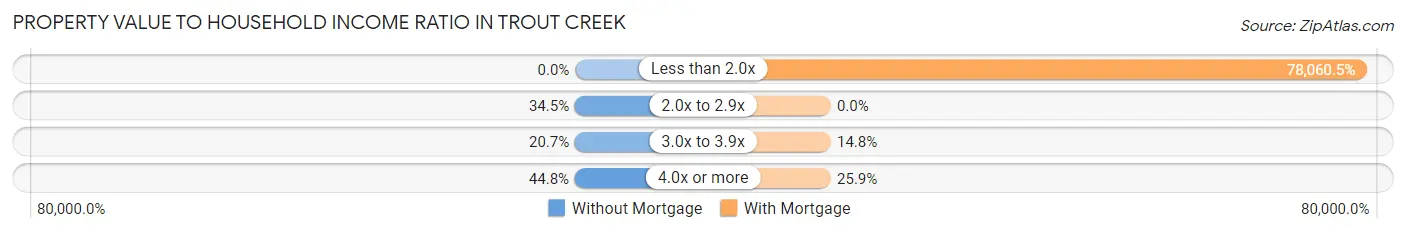
| Value-to-Income Ratio | Without Mortgage | With Mortgage |
| Less than 2.0x | 0 (0.0%) | 63,229 (78,060.5%) |
| 2.0x to 2.9x | 10 (34.5%) | 0 (0.0%) |
| 3.0x to 3.9x | 6 (20.7%) | 12 (14.8%) |
| 4.0x or more | 13 (44.8%) | 21 (25.9%) |
| Total | 29 (100.0%) | 81 (100.0%) |
Real Estate Taxes by Mortgage Status in Trout Creek
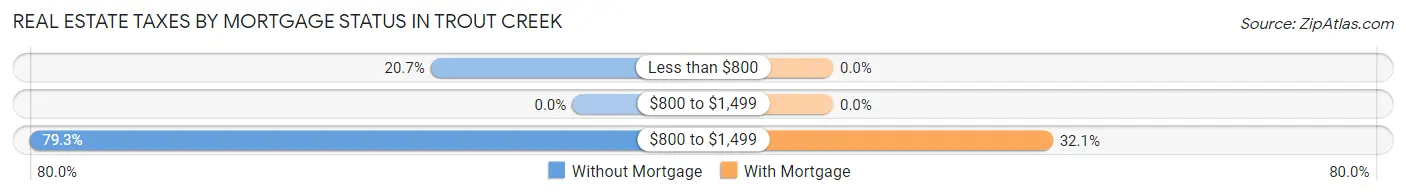
| Property Taxes | Without Mortgage | With Mortgage |
| Less than $800 | 6 (20.7%) | 0 (0.0%) |
| $800 to $1,499 | 0 (0.0%) | 0 (0.0%) |
| $800 to $1,499 | 23 (79.3%) | 26 (32.1%) |
| Total | 29 (100.0%) | 81 (100.0%) |
Health & Disability in Trout Creek
Health Insurance Coverage by Age in Trout Creek
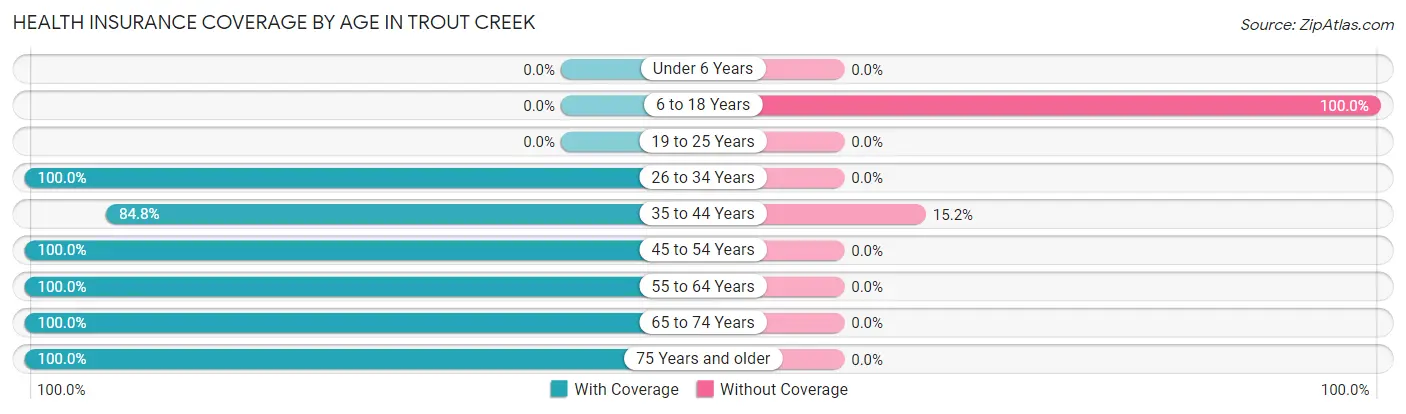
| Age Bracket | With Coverage | Without Coverage |
| Under 6 Years | 0 (0.0%) | 0 (0.0%) |
| 6 to 18 Years | 0 (0.0%) | 43 (100.0%) |
| 19 to 25 Years | 0 (0.0%) | 0 (0.0%) |
| 26 to 34 Years | 18 (100.0%) | 0 (0.0%) |
| 35 to 44 Years | 78 (84.8%) | 14 (15.2%) |
| 45 to 54 Years | 31 (100.0%) | 0 (0.0%) |
| 55 to 64 Years | 12 (100.0%) | 0 (0.0%) |
| 65 to 74 Years | 74 (100.0%) | 0 (0.0%) |
| 75 Years and older | 28 (100.0%) | 0 (0.0%) |
| Total | 241 (80.9%) | 57 (19.1%) |
Health Insurance Coverage by Citizenship Status in Trout Creek
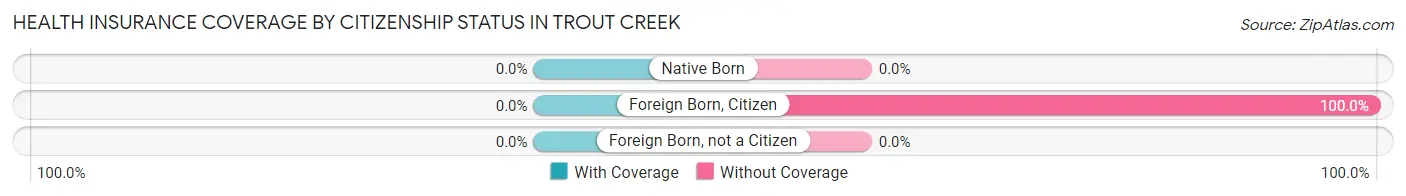
| Citizenship Status | With Coverage | Without Coverage |
| Native Born | 0 (0.0%) | 0 (0.0%) |
| Foreign Born, Citizen | 0 (0.0%) | 43 (100.0%) |
| Foreign Born, not a Citizen | 0 (0.0%) | 0 (0.0%) |
Health Insurance Coverage by Household Income in Trout Creek
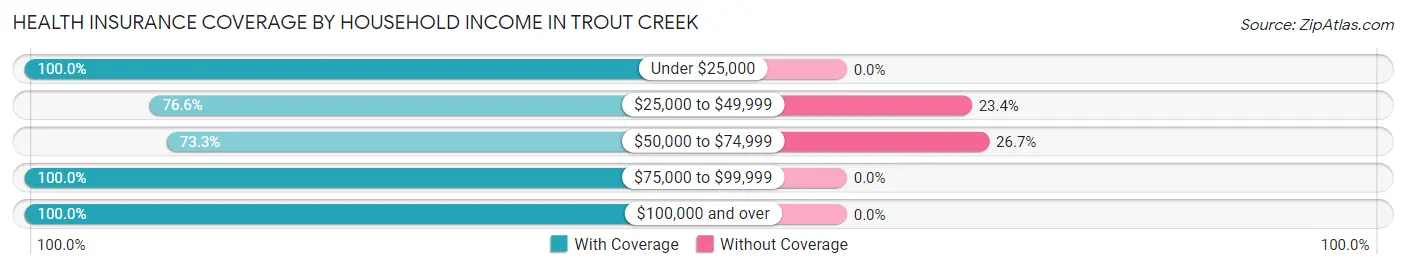
| Household Income | With Coverage | Without Coverage |
| Under $25,000 | 4 (100.0%) | 0 (0.0%) |
| $25,000 to $49,999 | 108 (76.6%) | 33 (23.4%) |
| $50,000 to $74,999 | 66 (73.3%) | 24 (26.7%) |
| $75,000 to $99,999 | 15 (100.0%) | 0 (0.0%) |
| $100,000 and over | 48 (100.0%) | 0 (0.0%) |
Public vs Private Health Insurance Coverage by Age in Trout Creek
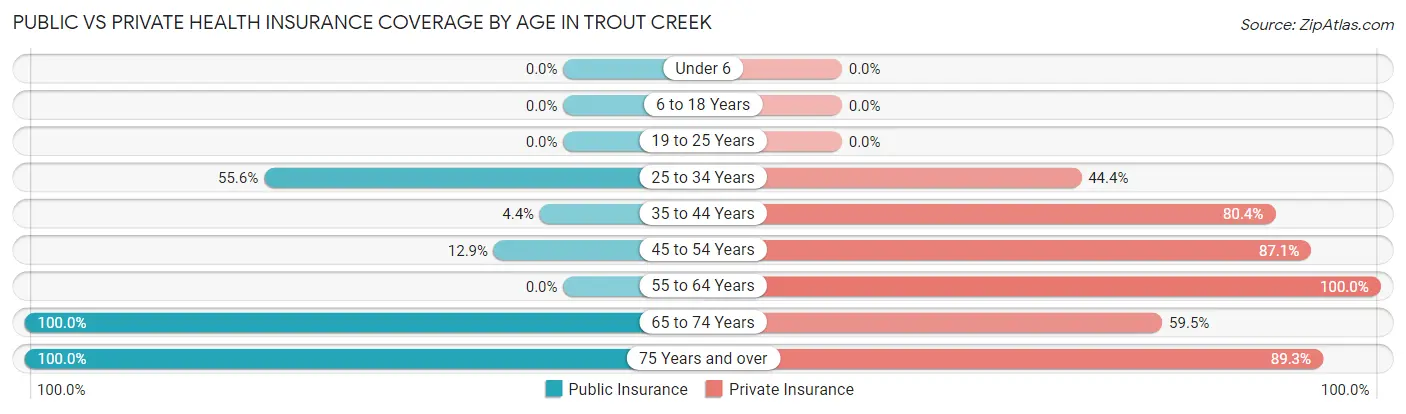
| Age Bracket | Public Insurance | Private Insurance |
| Under 6 | 0 (0.0%) | 0 (0.0%) |
| 6 to 18 Years | 0 (0.0%) | 0 (0.0%) |
| 19 to 25 Years | 0 (0.0%) | 0 (0.0%) |
| 25 to 34 Years | 10 (55.6%) | 8 (44.4%) |
| 35 to 44 Years | 4 (4.3%) | 74 (80.4%) |
| 45 to 54 Years | 4 (12.9%) | 27 (87.1%) |
| 55 to 64 Years | 0 (0.0%) | 12 (100.0%) |
| 65 to 74 Years | 74 (100.0%) | 44 (59.5%) |
| 75 Years and over | 28 (100.0%) | 25 (89.3%) |
| Total | 120 (40.3%) | 190 (63.8%) |
Disability Status by Sex by Age in Trout Creek
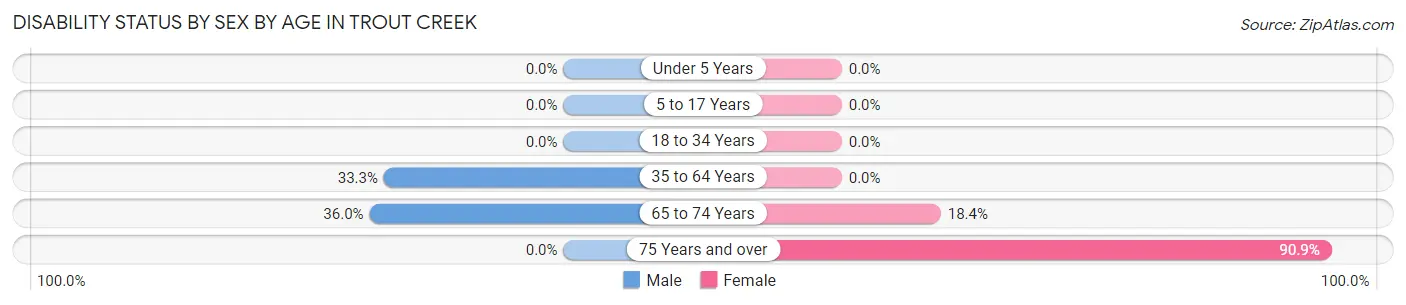
| Age Bracket | Male | Female |
| Under 5 Years | 0 (0.0%) | 0 (0.0%) |
| 5 to 17 Years | 0 (0.0%) | 0 (0.0%) |
| 18 to 34 Years | 0 (0.0%) | 0 (0.0%) |
| 35 to 64 Years | 16 (33.3%) | 0 (0.0%) |
| 65 to 74 Years | 9 (36.0%) | 9 (18.4%) |
| 75 Years and over | 0 (0.0%) | 10 (90.9%) |
Disability Class by Sex by Age in Trout Creek
Disability Class: Hearing Difficulty
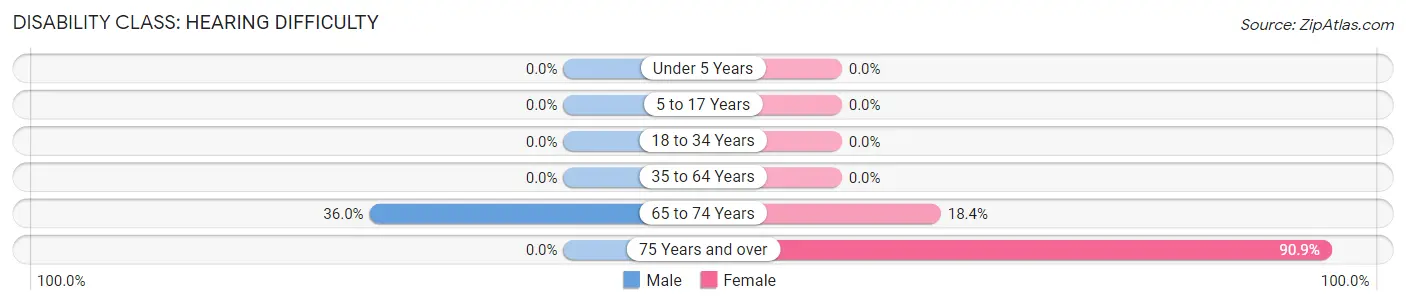
| Age Bracket | Male | Female |
| Under 5 Years | 0 (0.0%) | 0 (0.0%) |
| 5 to 17 Years | 0 (0.0%) | 0 (0.0%) |
| 18 to 34 Years | 0 (0.0%) | 0 (0.0%) |
| 35 to 64 Years | 0 (0.0%) | 0 (0.0%) |
| 65 to 74 Years | 9 (36.0%) | 9 (18.4%) |
| 75 Years and over | 0 (0.0%) | 10 (90.9%) |
Disability Class: Vision Difficulty
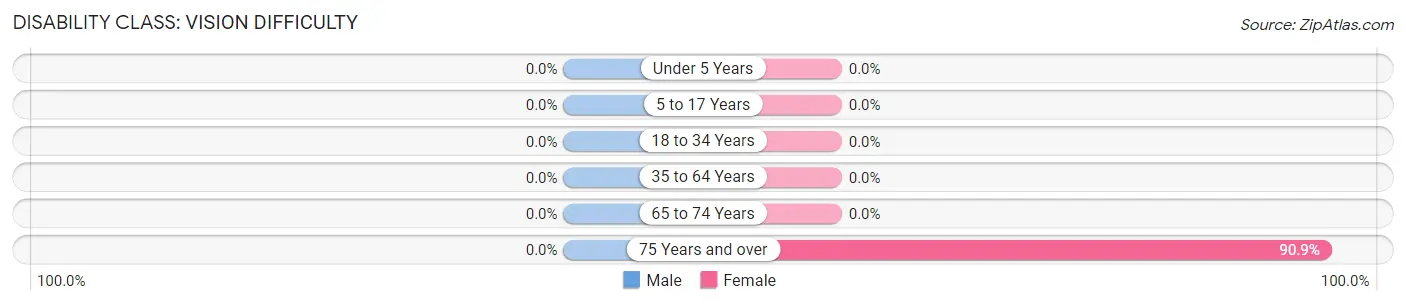
| Age Bracket | Male | Female |
| Under 5 Years | 0 (0.0%) | 0 (0.0%) |
| 5 to 17 Years | 0 (0.0%) | 0 (0.0%) |
| 18 to 34 Years | 0 (0.0%) | 0 (0.0%) |
| 35 to 64 Years | 0 (0.0%) | 0 (0.0%) |
| 65 to 74 Years | 0 (0.0%) | 0 (0.0%) |
| 75 Years and over | 0 (0.0%) | 10 (90.9%) |
Disability Class: Cognitive Difficulty
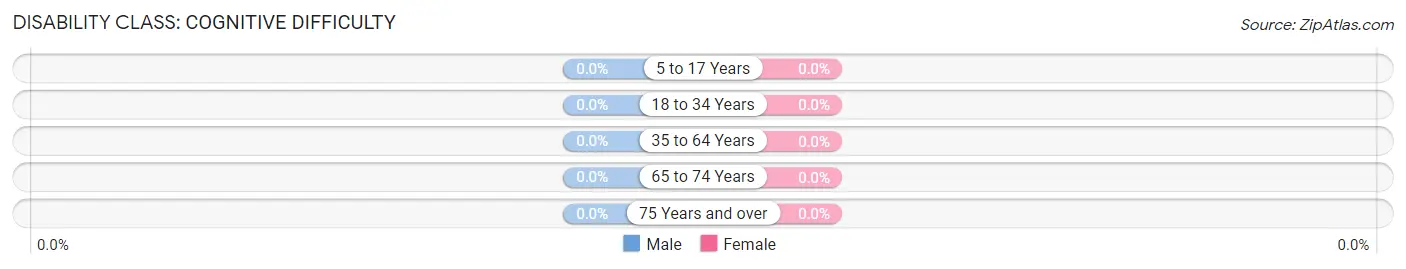
| Age Bracket | Male | Female |
| 5 to 17 Years | 0 (0.0%) | 0 (0.0%) |
| 18 to 34 Years | 0 (0.0%) | 0 (0.0%) |
| 35 to 64 Years | 0 (0.0%) | 0 (0.0%) |
| 65 to 74 Years | 0 (0.0%) | 0 (0.0%) |
| 75 Years and over | 0 (0.0%) | 0 (0.0%) |
Disability Class: Ambulatory Difficulty
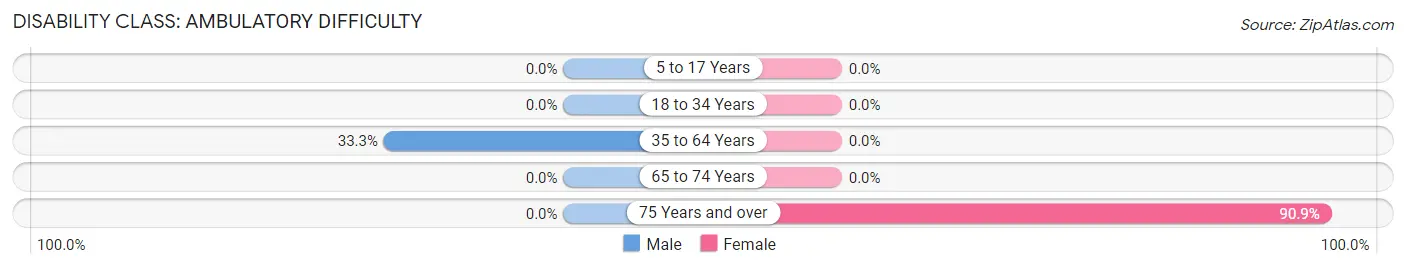
| Age Bracket | Male | Female |
| 5 to 17 Years | 0 (0.0%) | 0 (0.0%) |
| 18 to 34 Years | 0 (0.0%) | 0 (0.0%) |
| 35 to 64 Years | 16 (33.3%) | 0 (0.0%) |
| 65 to 74 Years | 0 (0.0%) | 0 (0.0%) |
| 75 Years and over | 0 (0.0%) | 10 (90.9%) |
Disability Class: Self-Care Difficulty
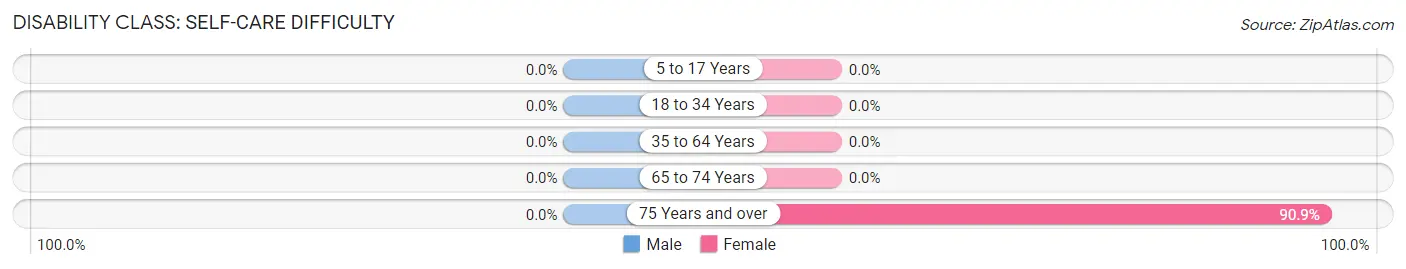
| Age Bracket | Male | Female |
| 5 to 17 Years | 0 (0.0%) | 0 (0.0%) |
| 18 to 34 Years | 0 (0.0%) | 0 (0.0%) |
| 35 to 64 Years | 0 (0.0%) | 0 (0.0%) |
| 65 to 74 Years | 0 (0.0%) | 0 (0.0%) |
| 75 Years and over | 0 (0.0%) | 10 (90.9%) |
Technology Access in Trout Creek
Computing Device Access in Trout Creek
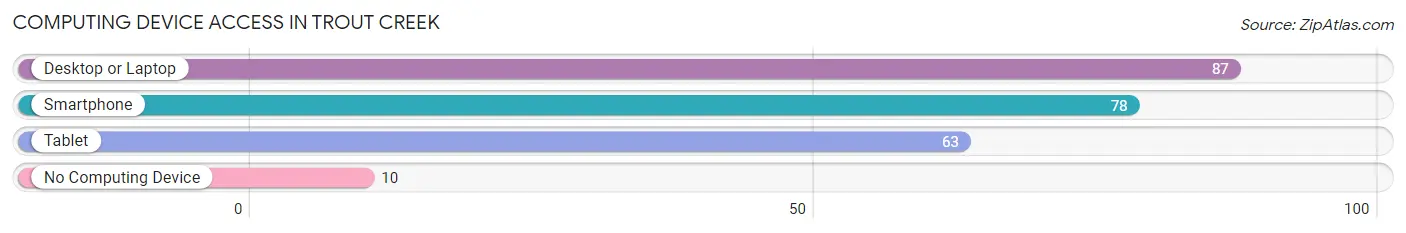
| Device Type | # Households | % Households |
| Desktop or Laptop | 87 | 74.4% |
| Smartphone | 78 | 66.7% |
| Tablet | 63 | 53.8% |
| No Computing Device | 10 | 8.6% |
| Total | 117 | 100.0% |
Internet Access in Trout Creek
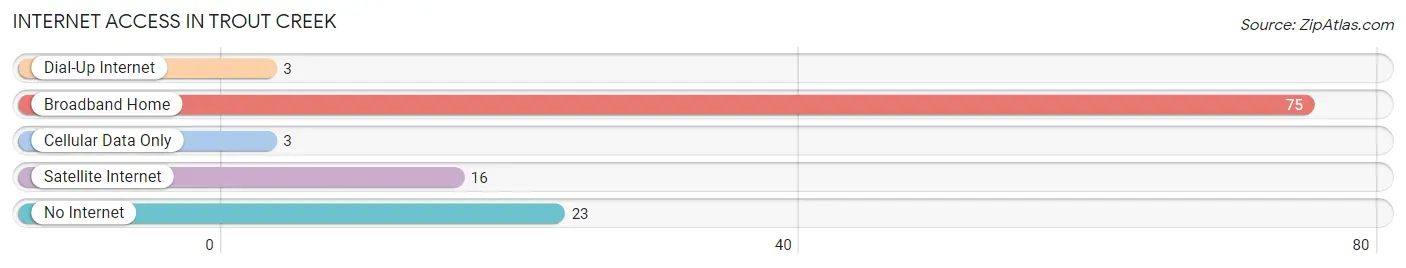
| Internet Type | # Households | % Households |
| Dial-Up Internet | 3 | 2.6% |
| Broadband Home | 75 | 64.1% |
| Cellular Data Only | 3 | 2.6% |
| Satellite Internet | 16 | 13.7% |
| No Internet | 23 | 19.7% |
| Total | 117 | 100.0% |
Trout Creek Summary
Trout Creek is a small town located in the northwest corner of Montana, in the heart of the Kootenai National Forest. It is situated in the Flathead Valley, near the Idaho border, and is surrounded by the Cabinet Mountains and the Purcell Mountains. The town is home to a population of approximately 500 people, and is known for its outdoor recreation opportunities, including fishing, hunting, camping, and hiking.
History
Trout Creek was first settled in the late 1800s by homesteaders who were drawn to the area by its abundance of natural resources. The town was officially incorporated in 1909, and was named after the nearby Trout Creek, which was a popular spot for fishing. The town quickly grew, and by the 1920s, it had become a popular destination for tourists and outdoor enthusiasts.
In the 1950s, the town began to experience a decline in population as many of its residents moved away in search of better economic opportunities. However, in the late 1970s, the town experienced a resurgence in popularity as people began to rediscover its natural beauty and recreational opportunities.
Geography
Trout Creek is located in the northwest corner of Montana, in the heart of the Kootenai National Forest. It is situated in the Flathead Valley, near the Idaho border, and is surrounded by the Cabinet Mountains and the Purcell Mountains. The town is located at an elevation of 3,400 feet, and has a total area of 0.7 square miles.
The climate in Trout Creek is generally mild, with warm summers and cold winters. The average high temperature in the summer is around 80 degrees Fahrenheit, while the average low temperature in the winter is around 20 degrees Fahrenheit.
Economy
Trout Creek’s economy is largely based on tourism and outdoor recreation. The town is home to several popular fishing spots, as well as numerous hiking and camping opportunities. In addition, the town is home to several small businesses, including restaurants, shops, and lodging.
Demographics
As of the 2010 census, the population of Trout Creek was 498. The racial makeup of the town was 95.2% White, 0.2% African American, 0.8% Native American, 0.2% Asian, 0.2% Pacific Islander, and 3.4% from other races. The median household income was $31,250, and the median family income was $37,500. The per capita income was $17,818.
Conclusion
Trout Creek is a small town located in the northwest corner of Montana, in the heart of the Kootenai National Forest. It is known for its outdoor recreation opportunities, including fishing, hunting, camping, and hiking. The town’s economy is largely based on tourism and outdoor recreation, and it is home to several small businesses. The population of Trout Creek is approximately 500 people, and the town has a median household income of $31,250.
Common Questions
What is Per Capita Income in Trout Creek?
Per Capita income in Trout Creek is $30,052.
What is the Median Family Income in Trout Creek?
Median Family Income in Trout Creek is $53,906.
What is the Median Household income in Trout Creek?
Median Household Income in Trout Creek is $53,977.
What is Income or Wage Gap in Trout Creek?
Income or Wage Gap in Trout Creek is 3.7%.
Women in Trout Creek earn 96.3 cents for every dollar earned by a man.
What is Inequality or Gini Index in Trout Creek?
Inequality or Gini Index in Trout Creek is 0.39.
What is the Total Population of Trout Creek?
Total Population of Trout Creek is 298.
What is the Total Male Population of Trout Creek?
Total Male Population of Trout Creek is 119.
What is the Total Female Population of Trout Creek?
Total Female Population of Trout Creek is 179.
What is the Ratio of Males per 100 Females in Trout Creek?
There are 66.48 Males per 100 Females in Trout Creek.
What is the Ratio of Females per 100 Males in Trout Creek?
There are 150.42 Females per 100 Males in Trout Creek.
What is the Median Population Age in Trout Creek?
Median Population Age in Trout Creek is 44.7 Years.
What is the Average Family Size in Trout Creek
Average Family Size in Trout Creek is 2.9 People.
What is the Average Household Size in Trout Creek
Average Household Size in Trout Creek is 2.5 People.
How Large is the Labor Force in Trout Creek?
There are 103 People in the Labor Forcein in Trout Creek.
What is the Percentage of People in the Labor Force in Trout Creek?
40.4% of People are in the Labor Force in Trout Creek.