Swan Lake, MT Map & Demographics
Swan Lake Map
Swan Lake Overview
$35,013
PER CAPITA INCOME
$60,000
AVG FAMILY INCOME
$76,071
AVG HOUSEHOLD INCOME
0.38
INEQUALITY / GINI INDEX
216
TOTAL POPULATION
127
MALE POPULATION
89
FEMALE POPULATION
142.70
MALES / 100 FEMALES
70.08
FEMALES / 100 MALES
43.4
MEDIAN AGE
2.9
AVG FAMILY SIZE
2.4
AVG HOUSEHOLD SIZE
96
LABOR FORCE [ PEOPLE ]
50.8%
PERCENT IN LABOR FORCE
Swan Lake Area Codes
Income in Swan Lake
Income Overview in Swan Lake
Per Capita Income in Swan Lake is $35,013, while median incomes of families and households are $60,000 and $76,071 respectively.
| Characteristic | Number | Measure |
| Per Capita Income | 216 | $35,013 |
| Median Family Income | 52 | $60,000 |
| Mean Family Income | 52 | $92,421 |
| Median Household Income | 84 | $76,071 |
| Mean Household Income | 84 | $81,242 |
| Income Deficit | 52 | $0 |
| Wage / Income Gap (%) | 216 | 0.00% |
| Wage / Income Gap ($) | 216 | 100.00¢ per $1 |
| Gini / Inequality Index | 216 | 0.38 |
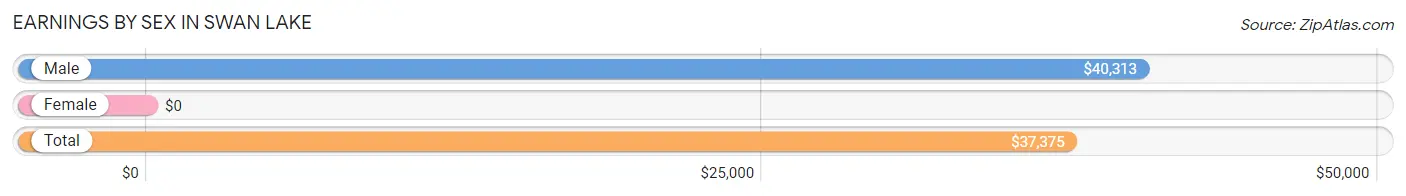
Earnings by Sex in Swan Lake
| Sex | Number | Average Earnings |
| Male | 69 (59.0%) | $40,313 |
| Female | 48 (41.0%) | $0 |
| Total | 117 (100.0%) | $37,375 |
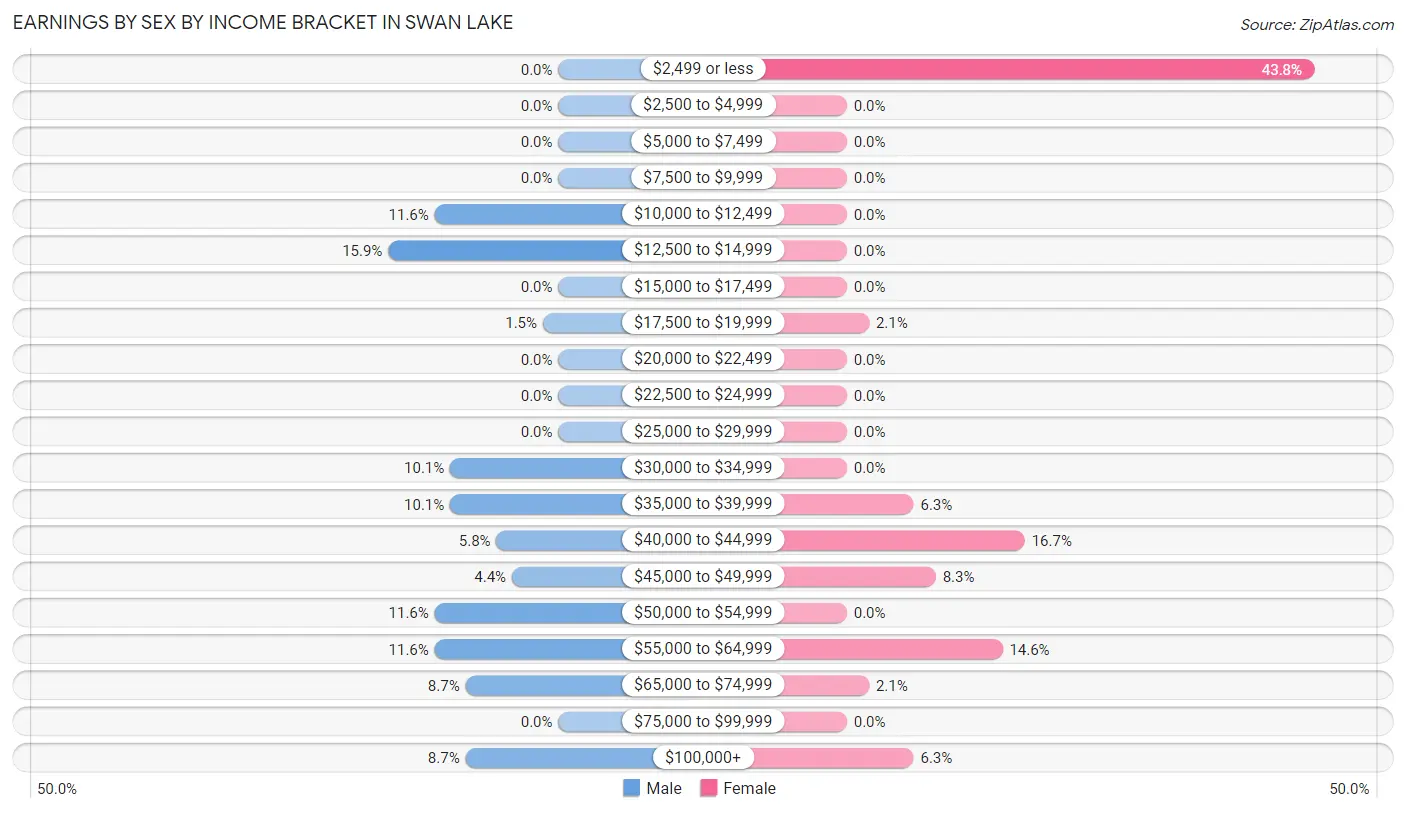
Earnings by Sex by Income Bracket in Swan Lake
The most common earnings brackets in Swan Lake are $12,500 to $14,999 for men (11 | 15.9%) and $2,499 or less for women (21 | 43.8%).
| Income | Male | Female |
| $2,499 or less | 0 (0.0%) | 21 (43.8%) |
| $2,500 to $4,999 | 0 (0.0%) | 0 (0.0%) |
| $5,000 to $7,499 | 0 (0.0%) | 0 (0.0%) |
| $7,500 to $9,999 | 0 (0.0%) | 0 (0.0%) |
| $10,000 to $12,499 | 8 (11.6%) | 0 (0.0%) |
| $12,500 to $14,999 | 11 (15.9%) | 0 (0.0%) |
| $15,000 to $17,499 | 0 (0.0%) | 0 (0.0%) |
| $17,500 to $19,999 | 1 (1.5%) | 1 (2.1%) |
| $20,000 to $22,499 | 0 (0.0%) | 0 (0.0%) |
| $22,500 to $24,999 | 0 (0.0%) | 0 (0.0%) |
| $25,000 to $29,999 | 0 (0.0%) | 0 (0.0%) |
| $30,000 to $34,999 | 7 (10.1%) | 0 (0.0%) |
| $35,000 to $39,999 | 7 (10.1%) | 3 (6.2%) |
| $40,000 to $44,999 | 4 (5.8%) | 8 (16.7%) |
| $45,000 to $49,999 | 3 (4.3%) | 4 (8.3%) |
| $50,000 to $54,999 | 8 (11.6%) | 0 (0.0%) |
| $55,000 to $64,999 | 8 (11.6%) | 7 (14.6%) |
| $65,000 to $74,999 | 6 (8.7%) | 1 (2.1%) |
| $75,000 to $99,999 | 0 (0.0%) | 0 (0.0%) |
| $100,000+ | 6 (8.7%) | 3 (6.2%) |
| Total | 69 (100.0%) | 48 (100.0%) |
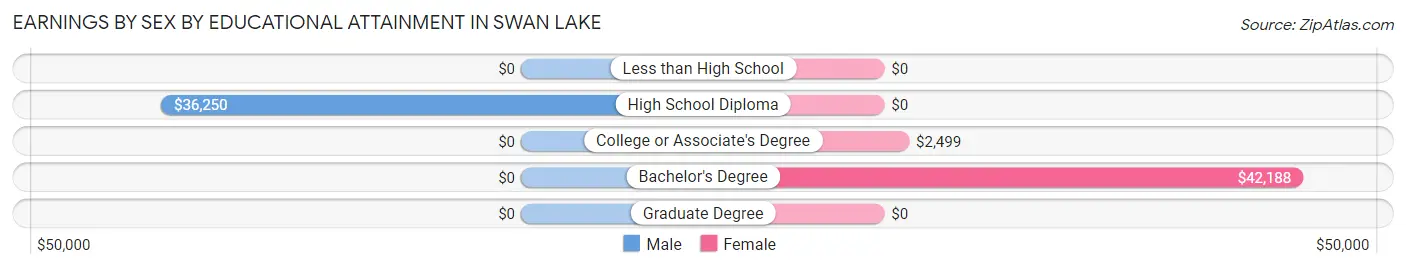
Earnings by Sex by Educational Attainment in Swan Lake
| Educational Attainment | Male Income | Female Income |
| Less than High School | - | - |
| High School Diploma | $36,250 | $0 |
| College or Associate's Degree | - | - |
| Bachelor's Degree | - | - |
| Graduate Degree | - | - |
| Total | $40,313 | $0 |
Family Income in Swan Lake
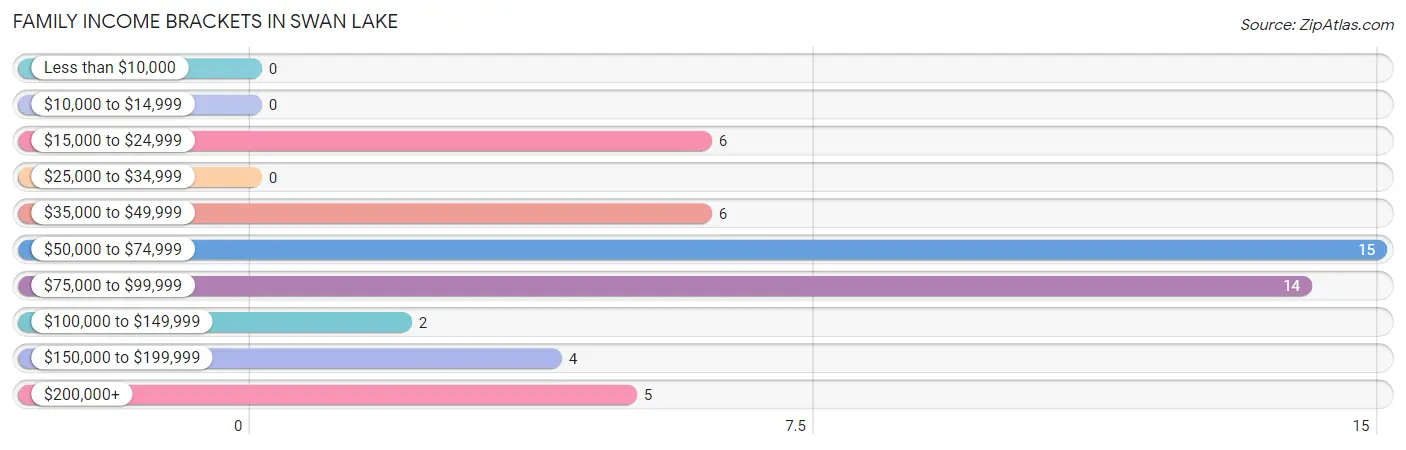
Family Income Brackets in Swan Lake
According to the Swan Lake family income data, there are 15 families falling into the $50,000 to $74,999 income range, which is the most common income bracket and makes up 28.8% of all families.
| Income Bracket | # Families | % Families |
| Less than $10,000 | 0 | 0.0% |
| $10,000 to $14,999 | 0 | 0.0% |
| $15,000 to $24,999 | 6 | 11.5% |
| $25,000 to $34,999 | 0 | 0.0% |
| $35,000 to $49,999 | 6 | 11.5% |
| $50,000 to $74,999 | 15 | 28.8% |
| $75,000 to $99,999 | 14 | 26.9% |
| $100,000 to $149,999 | 2 | 3.8% |
| $150,000 to $199,999 | 4 | 7.7% |
| $200,000+ | 5 | 9.6% |
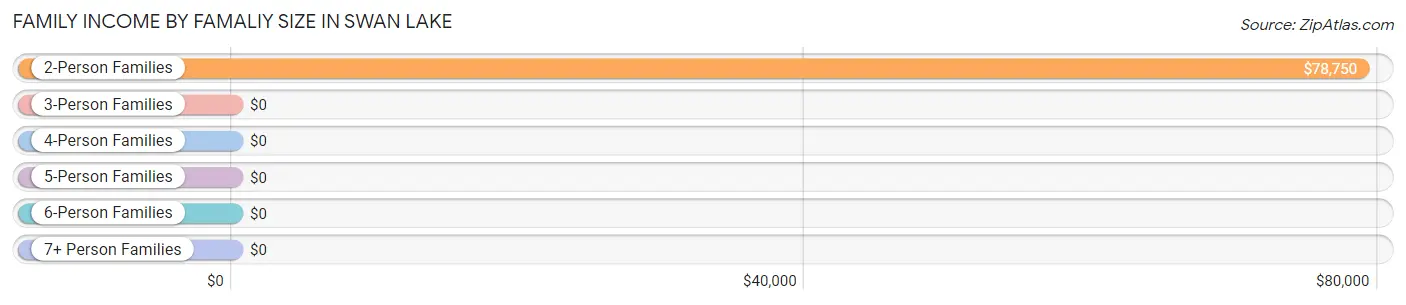
Family Income by Famaliy Size in Swan Lake
2-person families (36 | 69.2%) account for the highest median family income in Swan Lake with $78,750 per family, while 2-person families (36 | 69.2%) have the highest median income of $39,375 per family member.
| Income Bracket | # Families | Median Income |
| 2-Person Families | 36 (69.2%) | $78,750 |
| 3-Person Families | 15 (28.8%) | $0 |
| 4-Person Families | 0 (0.0%) | $0 |
| 5-Person Families | 1 (1.9%) | $0 |
| 6-Person Families | 0 (0.0%) | $0 |
| 7+ Person Families | 0 (0.0%) | $0 |
| Total | 52 (100.0%) | $60,000 |
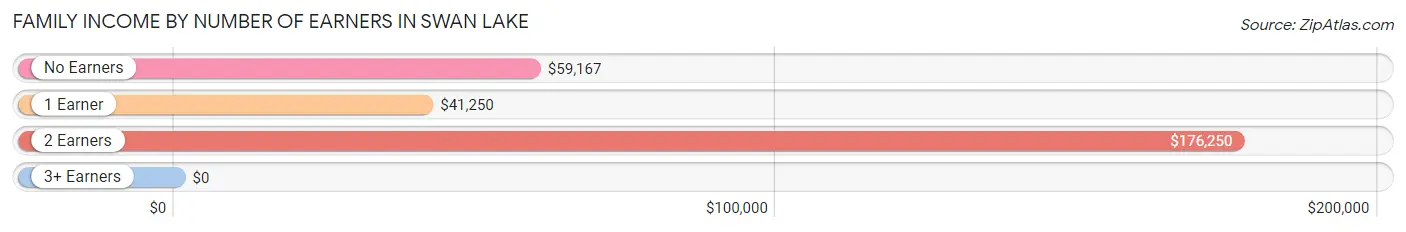
Family Income by Number of Earners in Swan Lake
| Number of Earners | # Families | Median Income |
| No Earners | 24 (46.2%) | $59,167 |
| 1 Earner | 16 (30.8%) | $41,250 |
| 2 Earners | 12 (23.1%) | $176,250 |
| 3+ Earners | 0 (0.0%) | $0 |
| Total | 52 (100.0%) | $60,000 |
Household Income in Swan Lake
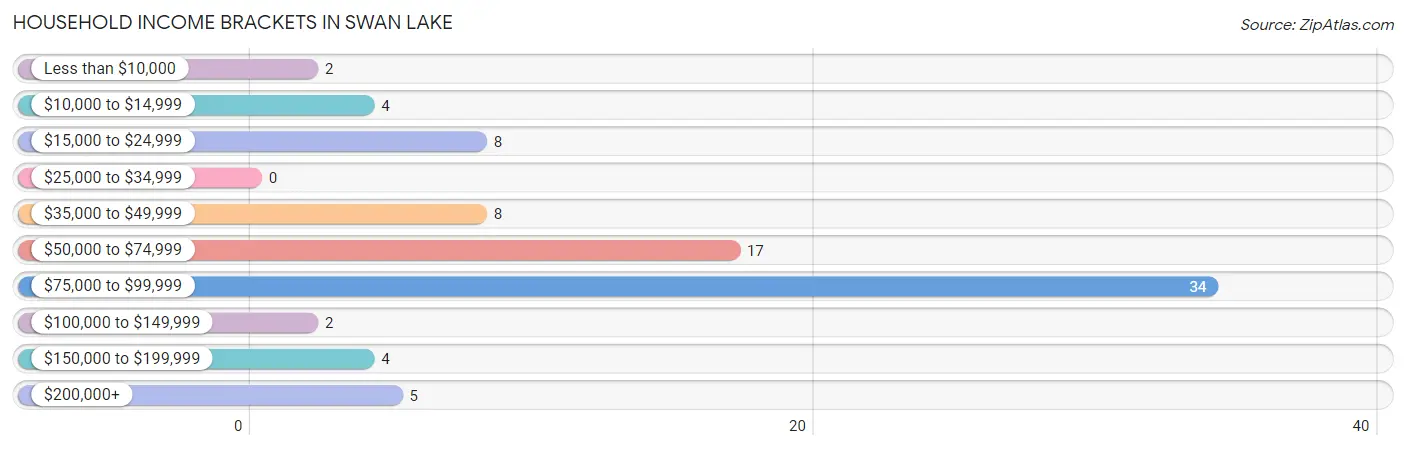
Household Income Brackets in Swan Lake
With 34 households falling in the category, the $75,000 to $99,999 income range is the most frequent in Swan Lake, accounting for 40.5% of all households.
| Income Bracket | # Households | % Households |
| Less than $10,000 | 2 | 2.4% |
| $10,000 to $14,999 | 4 | 4.8% |
| $15,000 to $24,999 | 8 | 9.5% |
| $25,000 to $34,999 | 0 | 0.0% |
| $35,000 to $49,999 | 8 | 9.5% |
| $50,000 to $74,999 | 17 | 20.2% |
| $75,000 to $99,999 | 34 | 40.5% |
| $100,000 to $149,999 | 2 | 2.4% |
| $150,000 to $199,999 | 4 | 4.8% |
| $200,000+ | 5 | 6.0% |
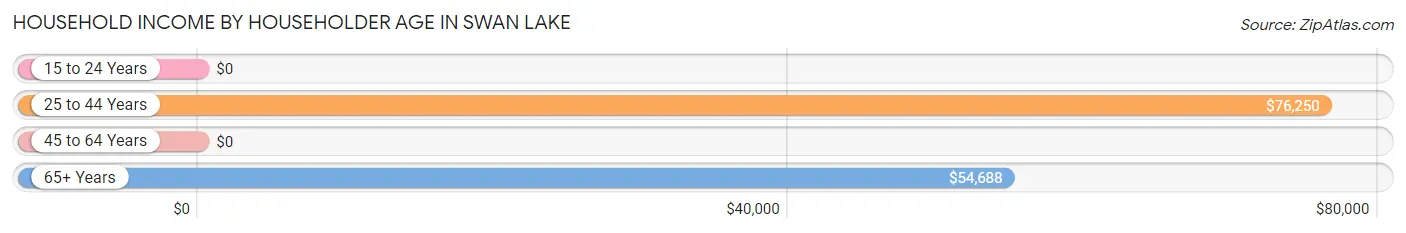
Household Income by Householder Age in Swan Lake
The median household income in Swan Lake is $76,071, with the highest median household income of $76,250 found in the 25 to 44 years age bracket for the primary householder. A total of 27 households (32.1%) fall into this category.
| Income Bracket | # Households | Median Income |
| 15 to 24 Years | 0 (0.0%) | $0 |
| 25 to 44 Years | 27 (32.1%) | $76,250 |
| 45 to 64 Years | 19 (22.6%) | $0 |
| 65+ Years | 38 (45.2%) | $54,688 |
| Total | 84 (100.0%) | $76,071 |
Poverty in Swan Lake
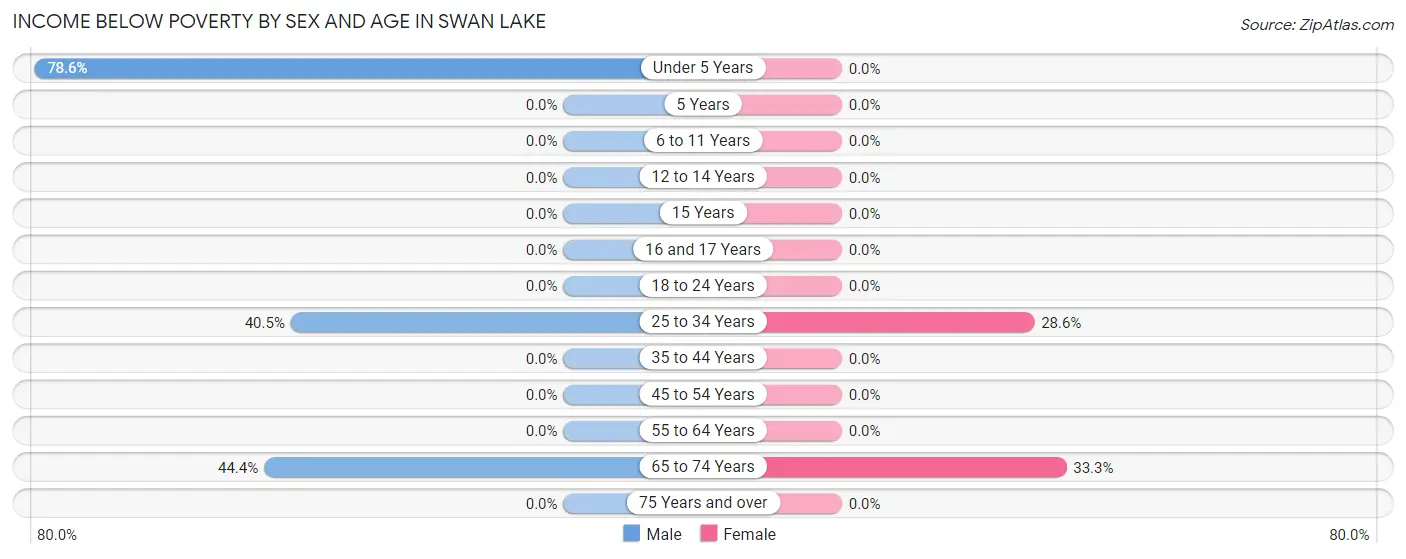
Income Below Poverty by Sex and Age in Swan Lake
With 25.2% poverty level for males and 9.0% for females among the residents of Swan Lake, under 5 year old males and 65 to 74 year old females are the most vulnerable to poverty, with 11 males (78.6%) and 2 females (33.3%) in their respective age groups living below the poverty level.
| Age Bracket | Male | Female |
| Under 5 Years | 11 (78.6%) | 0 (0.0%) |
| 5 Years | 0 (0.0%) | 0 (0.0%) |
| 6 to 11 Years | 0 (0.0%) | 0 (0.0%) |
| 12 to 14 Years | 0 (0.0%) | 0 (0.0%) |
| 15 Years | 0 (0.0%) | 0 (0.0%) |
| 16 and 17 Years | 0 (0.0%) | 0 (0.0%) |
| 18 to 24 Years | 0 (0.0%) | 0 (0.0%) |
| 25 to 34 Years | 17 (40.5%) | 6 (28.6%) |
| 35 to 44 Years | 0 (0.0%) | 0 (0.0%) |
| 45 to 54 Years | 0 (0.0%) | 0 (0.0%) |
| 55 to 64 Years | 0 (0.0%) | 0 (0.0%) |
| 65 to 74 Years | 4 (44.4%) | 2 (33.3%) |
| 75 Years and over | 0 (0.0%) | 0 (0.0%) |
| Total | 32 (25.2%) | 8 (9.0%) |
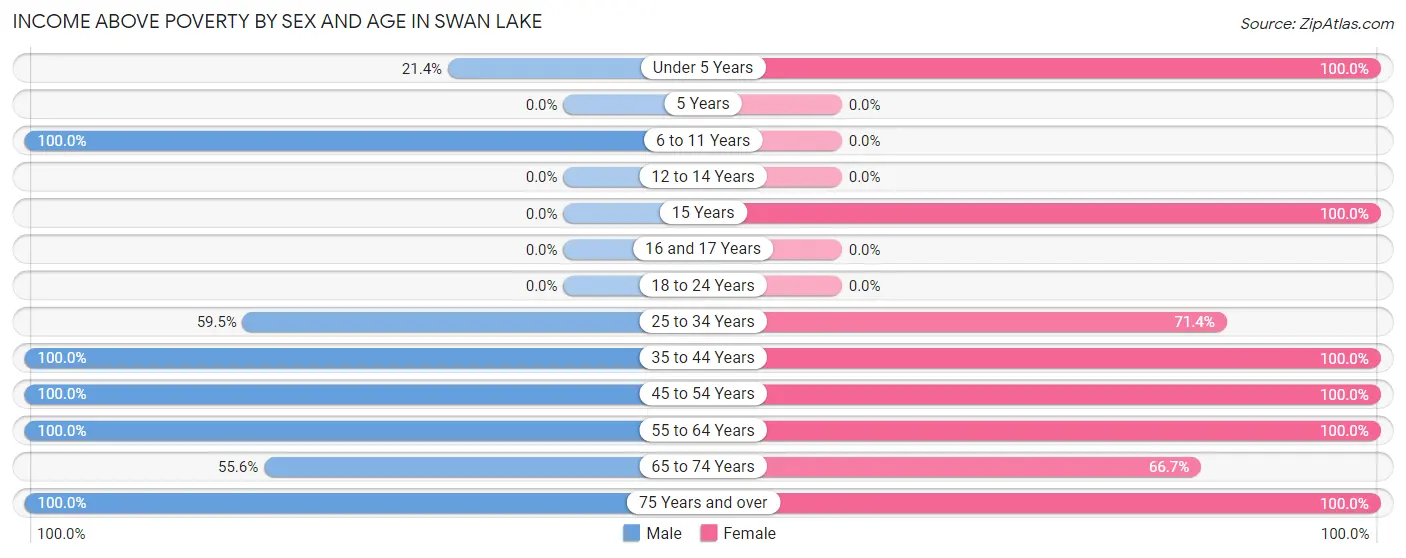
Income Above Poverty by Sex and Age in Swan Lake
According to the poverty statistics in Swan Lake, males aged 6 to 11 years and females aged under 5 years are the age groups that are most secure financially, with 100.0% of males and 100.0% of females in these age groups living above the poverty line.
| Age Bracket | Male | Female |
| Under 5 Years | 3 (21.4%) | 1 (100.0%) |
| 5 Years | 0 (0.0%) | 0 (0.0%) |
| 6 to 11 Years | 4 (100.0%) | 0 (0.0%) |
| 12 to 14 Years | 0 (0.0%) | 0 (0.0%) |
| 15 Years | 0 (0.0%) | 8 (100.0%) |
| 16 and 17 Years | 0 (0.0%) | 0 (0.0%) |
| 18 to 24 Years | 0 (0.0%) | 0 (0.0%) |
| 25 to 34 Years | 25 (59.5%) | 15 (71.4%) |
| 35 to 44 Years | 8 (100.0%) | 21 (100.0%) |
| 45 to 54 Years | 11 (100.0%) | 4 (100.0%) |
| 55 to 64 Years | 7 (100.0%) | 9 (100.0%) |
| 65 to 74 Years | 5 (55.6%) | 4 (66.7%) |
| 75 Years and over | 32 (100.0%) | 19 (100.0%) |
| Total | 95 (74.8%) | 81 (91.0%) |
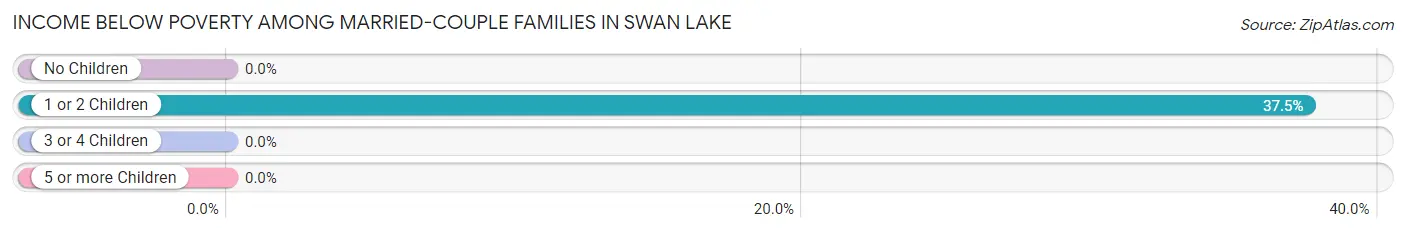
Income Below Poverty Among Married-Couple Families in Swan Lake
The poverty statistics for married-couple families in Swan Lake show that 12.2% or 6 of the total 49 families live below the poverty line. Families with 1 or 2 children have the highest poverty rate of 37.5%, comprising of 6 families. On the other hand, families with no children have the lowest poverty rate of 0.0%, which includes 0 families.
| Children | Above Poverty | Below Poverty |
| No Children | 33 (100.0%) | 0 (0.0%) |
| 1 or 2 Children | 10 (62.5%) | 6 (37.5%) |
| 3 or 4 Children | 0 (0.0%) | 0 (0.0%) |
| 5 or more Children | 0 (0.0%) | 0 (0.0%) |
| Total | 43 (87.8%) | 6 (12.2%) |
Income Below Poverty Among Single-Parent Households in Swan Lake
| Children | Single Father | Single Mother |
| No Children | 0 (0.0%) | 0 (0.0%) |
| 1 or 2 Children | 0 (0.0%) | 0 (0.0%) |
| 3 or 4 Children | 0 (0.0%) | 0 (0.0%) |
| 5 or more Children | 0 (0.0%) | 0 (0.0%) |
| Total | 0 (0.0%) | 0 (0.0%) |
Income Below Poverty Among Married-Couple vs Single-Parent Households in Swan Lake
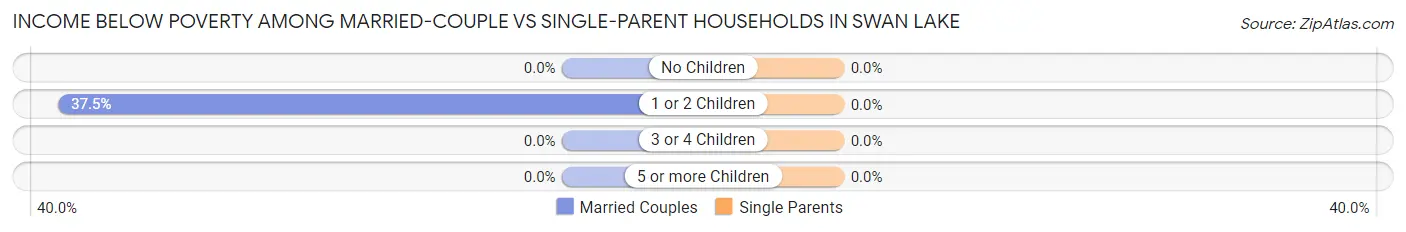
| Children | Married-Couple Families | Single-Parent Households |
| No Children | 0 (0.0%) | 0 (0.0%) |
| 1 or 2 Children | 6 (37.5%) | 0 (0.0%) |
| 3 or 4 Children | 0 (0.0%) | 0 (0.0%) |
| 5 or more Children | 0 (0.0%) | 0 (0.0%) |
| Total | 6 (12.2%) | 0 (0.0%) |
Race in Swan Lake
The most populous races in Swan Lake are White / Caucasian (214 | 99.1%), and Two or more Races (2 | 0.9%).
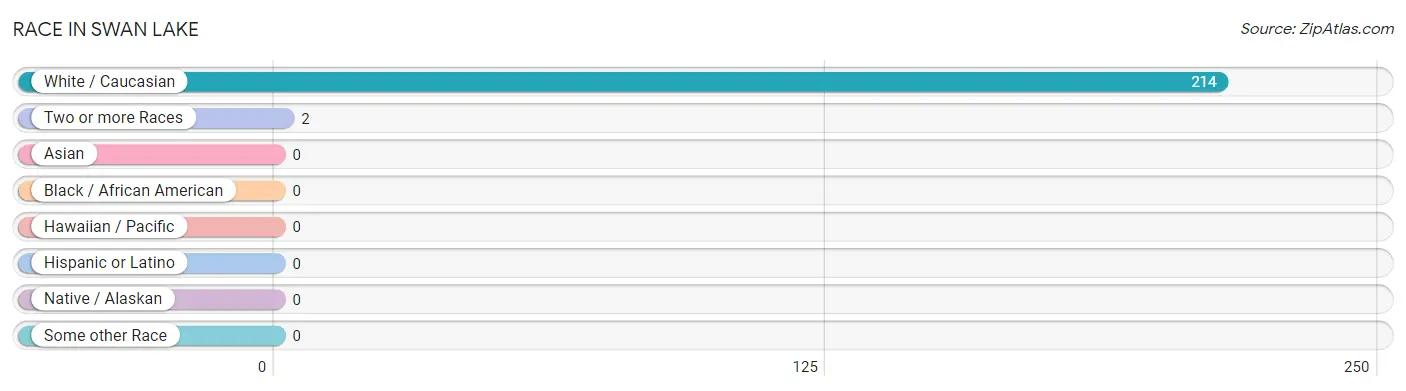
| Race | # Population | % Population |
| Asian | 0 | 0.0% |
| Black / African American | 0 | 0.0% |
| Hawaiian / Pacific | 0 | 0.0% |
| Hispanic or Latino | 0 | 0.0% |
| Native / Alaskan | 0 | 0.0% |
| White / Caucasian | 214 | 99.1% |
| Two or more Races | 2 | 0.9% |
| Some other Race | 0 | 0.0% |
| Total | 216 | 100.0% |
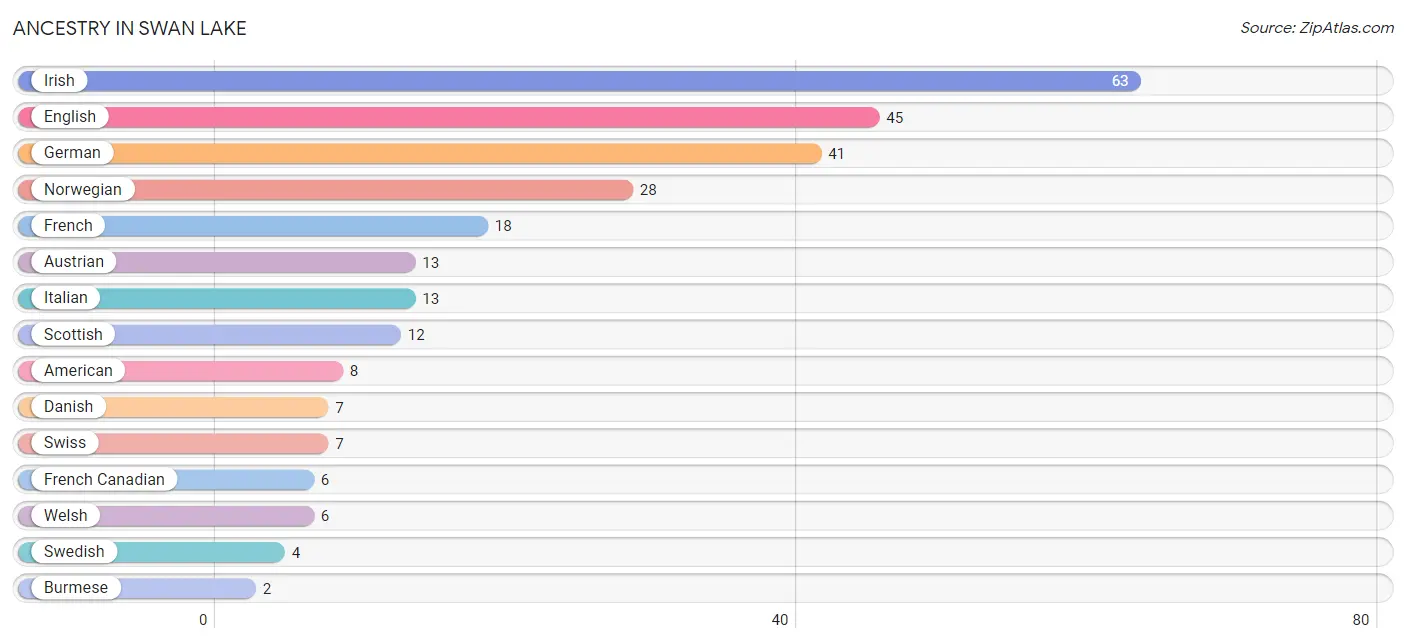
Ancestry in Swan Lake
The most populous ancestries reported in Swan Lake are Irish (63 | 29.2%), English (45 | 20.8%), German (41 | 19.0%), Norwegian (28 | 13.0%), and French (18 | 8.3%), together accounting for 90.3% of all Swan Lake residents.
| Ancestry | # Population | % Population |
| American | 8 | 3.7% |
| Austrian | 13 | 6.0% |
| Burmese | 2 | 0.9% |
| Danish | 7 | 3.2% |
| English | 45 | 20.8% |
| European | 2 | 0.9% |
| French | 18 | 8.3% |
| French Canadian | 6 | 2.8% |
| German | 41 | 19.0% |
| Irish | 63 | 29.2% |
| Italian | 13 | 6.0% |
| Norwegian | 28 | 13.0% |
| Romanian | 1 | 0.5% |
| Scottish | 12 | 5.6% |
| Swedish | 4 | 1.8% |
| Swiss | 7 | 3.2% |
| Welsh | 6 | 2.8% | View All 17 Rows |
Immigrants in Swan Lake
The most numerous immigrant groups reported in Swan Lake came from , and Canada (2 | 0.9%), together accounting for 0.9% of all Swan Lake residents.

| Immigration Origin | # Population | % Population |
| Canada | 2 | 0.9% | View All 1 Rows |
Sex and Age in Swan Lake
Sex and Age in Swan Lake
The most populous age groups in Swan Lake are 30 to 34 Years (34 | 26.8%) for men and 40 to 44 Years (19 | 21.3%) for women.
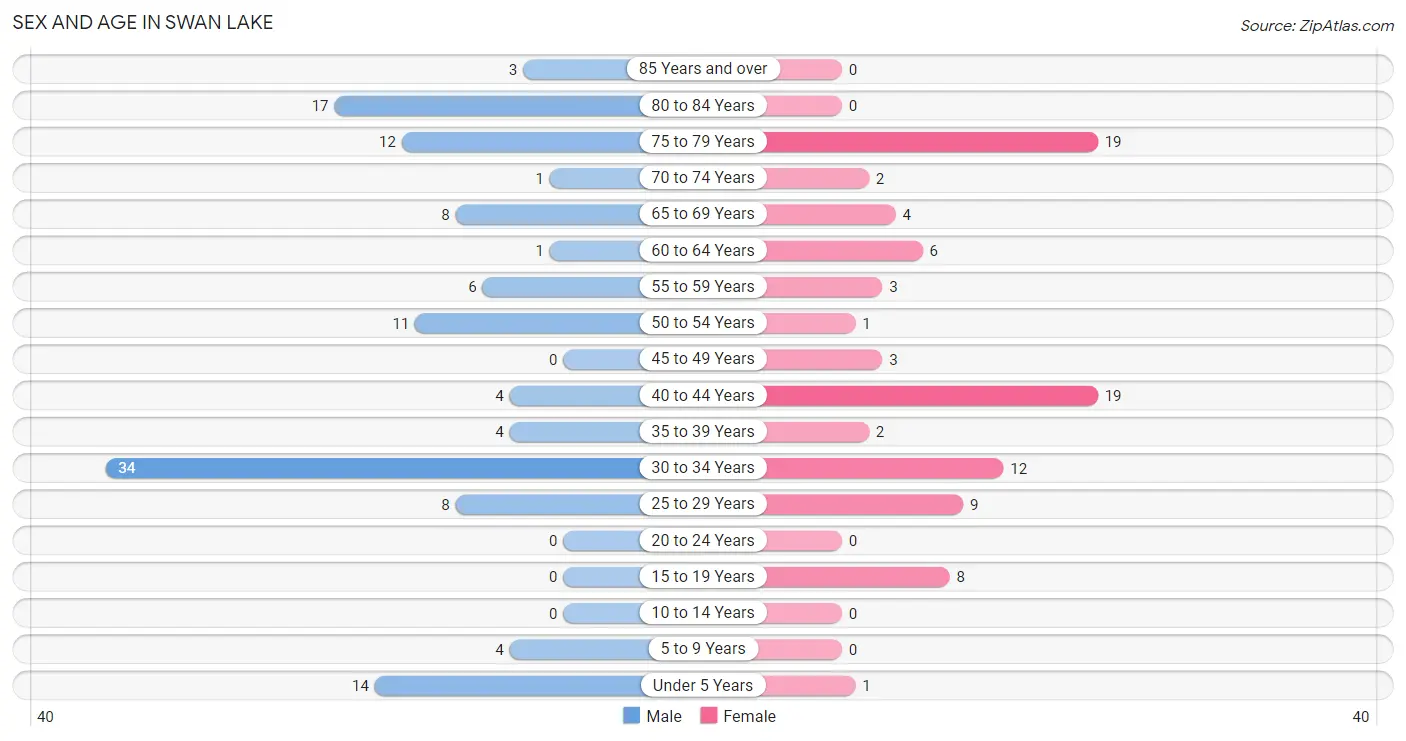
| Age Bracket | Male | Female |
| Under 5 Years | 14 (11.0%) | 1 (1.1%) |
| 5 to 9 Years | 4 (3.2%) | 0 (0.0%) |
| 10 to 14 Years | 0 (0.0%) | 0 (0.0%) |
| 15 to 19 Years | 0 (0.0%) | 8 (9.0%) |
| 20 to 24 Years | 0 (0.0%) | 0 (0.0%) |
| 25 to 29 Years | 8 (6.3%) | 9 (10.1%) |
| 30 to 34 Years | 34 (26.8%) | 12 (13.5%) |
| 35 to 39 Years | 4 (3.2%) | 2 (2.2%) |
| 40 to 44 Years | 4 (3.2%) | 19 (21.3%) |
| 45 to 49 Years | 0 (0.0%) | 3 (3.4%) |
| 50 to 54 Years | 11 (8.7%) | 1 (1.1%) |
| 55 to 59 Years | 6 (4.7%) | 3 (3.4%) |
| 60 to 64 Years | 1 (0.8%) | 6 (6.7%) |
| 65 to 69 Years | 8 (6.3%) | 4 (4.5%) |
| 70 to 74 Years | 1 (0.8%) | 2 (2.2%) |
| 75 to 79 Years | 12 (9.5%) | 19 (21.3%) |
| 80 to 84 Years | 17 (13.4%) | 0 (0.0%) |
| 85 Years and over | 3 (2.4%) | 0 (0.0%) |
| Total | 127 (100.0%) | 89 (100.0%) |
Families and Households in Swan Lake
Median Family Size in Swan Lake
The median family size in Swan Lake is 2.92 persons per family, with single male/father families (1 | 1.9%) accounting for the largest median family size of 3 persons per family. On the other hand, single female/mother families (2 | 3.8%) represent the smallest median family size with 2.50 persons per family.
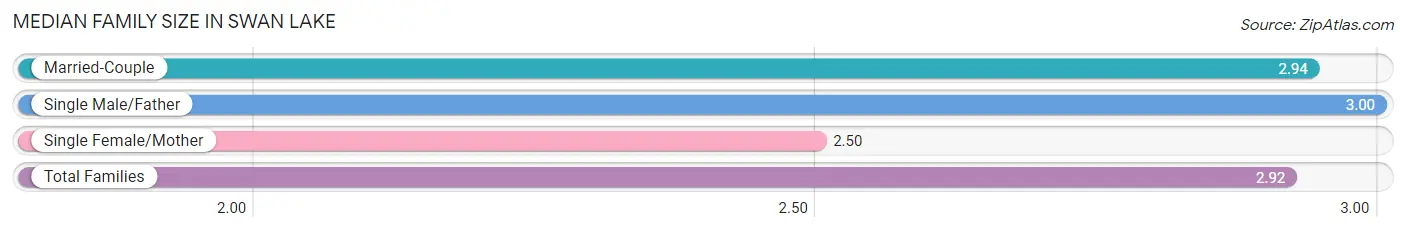
| Family Type | # Families | Family Size |
| Married-Couple | 49 (94.2%) | 2.94 |
| Single Male/Father | 1 (1.9%) | 3.00 |
| Single Female/Mother | 2 (3.8%) | 2.50 |
| Total Families | 52 (100.0%) | 2.92 |
Median Household Size in Swan Lake
The median household size in Swan Lake is 2.38 persons per household, with single male/father households (1 | 1.2%) accounting for the largest median household size of 3 persons per household. non-family households (32 | 38.1%) represent the smallest median household size with 1.50 persons per household.
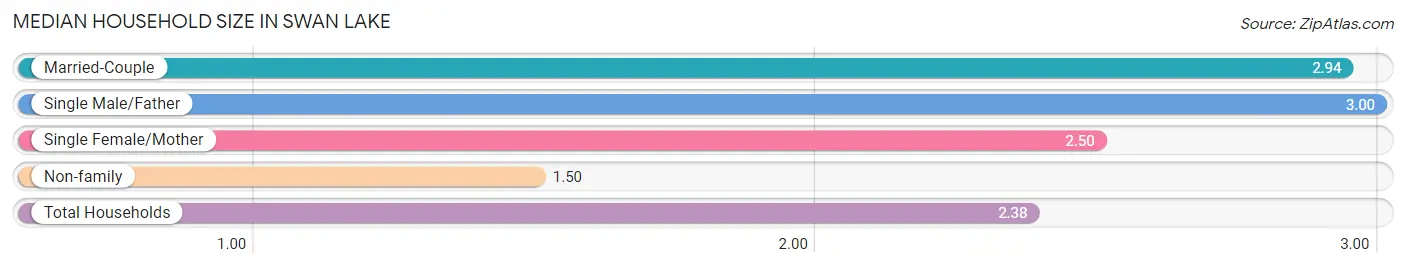
| Household Type | # Households | Household Size |
| Married-Couple | 49 (58.3%) | 2.94 |
| Single Male/Father | 1 (1.2%) | 3.00 |
| Single Female/Mother | 2 (2.4%) | 2.50 |
| Non-family | 32 (38.1%) | 1.50 |
| Total Households | 84 (100.0%) | 2.38 |
Household Size by Marriage Status in Swan Lake
Out of a total of 84 households in Swan Lake, 52 (61.9%) are family households, while 32 (38.1%) are nonfamily households. The most numerous type of family households are 2-person households, comprising 36, and the most common type of nonfamily households are 1-person households, comprising 16.
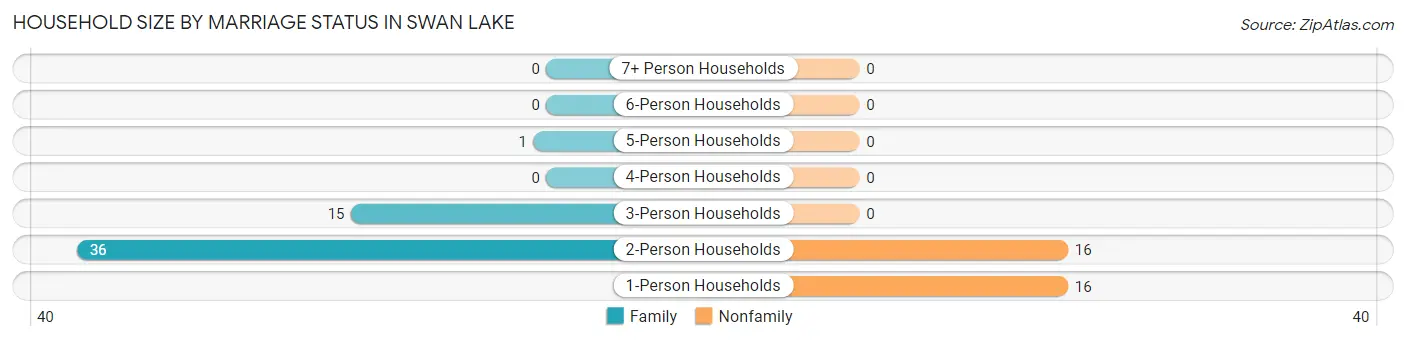
| Household Size | Family Households | Nonfamily Households |
| 1-Person Households | - | 16 (19.1%) |
| 2-Person Households | 36 (42.9%) | 16 (19.1%) |
| 3-Person Households | 15 (17.9%) | 0 (0.0%) |
| 4-Person Households | 0 (0.0%) | 0 (0.0%) |
| 5-Person Households | 1 (1.2%) | 0 (0.0%) |
| 6-Person Households | 0 (0.0%) | 0 (0.0%) |
| 7+ Person Households | 0 (0.0%) | 0 (0.0%) |
| Total | 52 (61.9%) | 32 (38.1%) |
Female Fertility in Swan Lake
Fertility by Age in Swan Lake
Average fertility rate in Swan Lake is 38.0 births per 1,000 women. Women in the age bracket of 35 to 50 years have the highest fertility rate with 83.0 births per 1,000 women. Women in the age bracket of 35 to 50 years acount for 100.0% of all women with births.
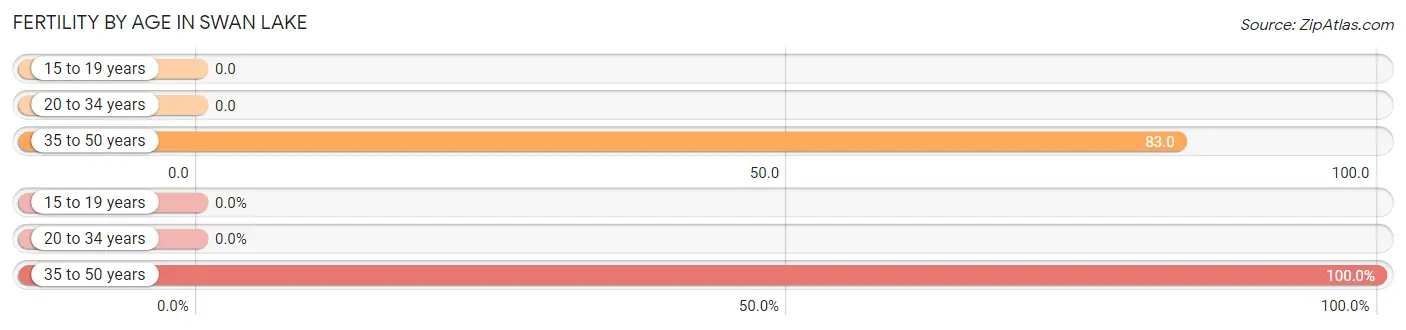
| Age Bracket | Women with Births | Births / 1,000 Women |
| 15 to 19 years | 0 (0.0%) | 0.0 |
| 20 to 34 years | 0 (0.0%) | 0.0 |
| 35 to 50 years | 2 (100.0%) | 83.0 |
| Total | 2 (100.0%) | 38.0 |
Fertility by Age by Marriage Status in Swan Lake
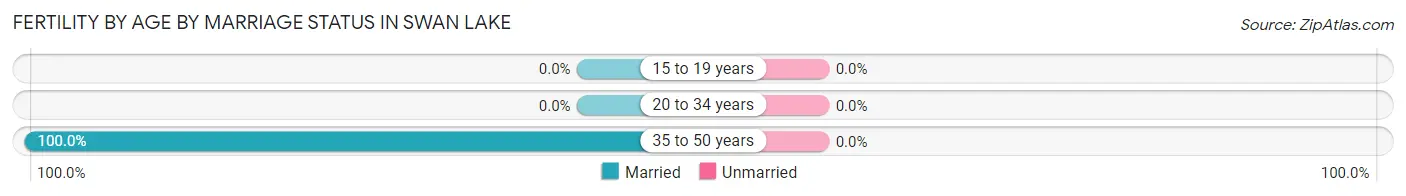
| Age Bracket | Married | Unmarried |
| 15 to 19 years | 0 (0.0%) | 0 (0.0%) |
| 20 to 34 years | 0 (0.0%) | 0 (0.0%) |
| 35 to 50 years | 2 (100.0%) | 0 (0.0%) |
| Total | 2 (100.0%) | 0 (0.0%) |
Fertility by Education in Swan Lake
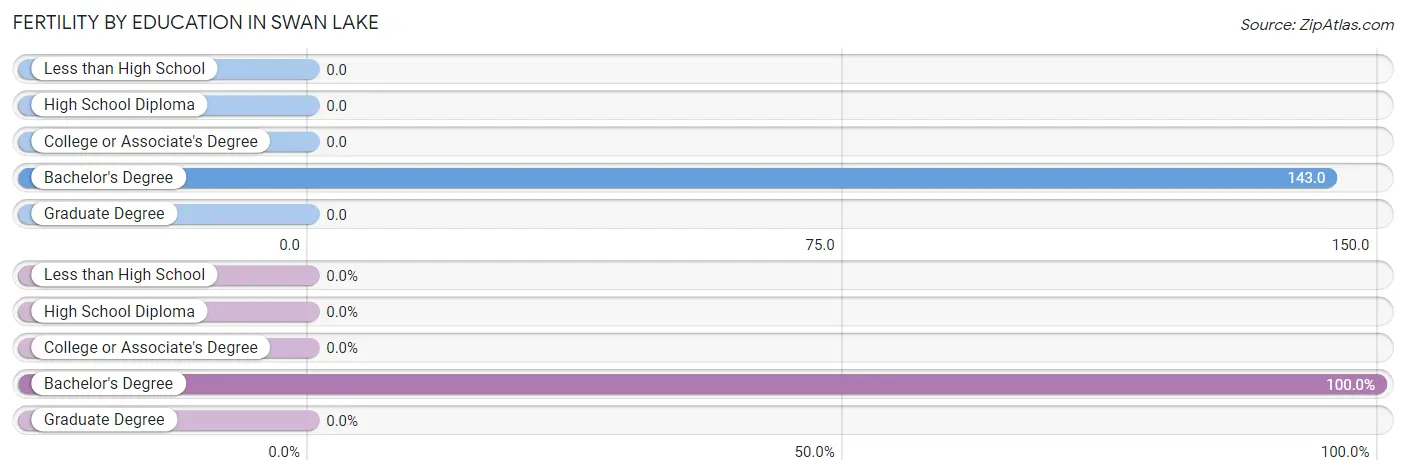
| Educational Attainment | Women with Births | Births / 1,000 Women |
| Less than High School | 0 (0.0%) | 0.0 |
| High School Diploma | 0 (0.0%) | 0.0 |
| College or Associate's Degree | 0 (0.0%) | 0.0 |
| Bachelor's Degree | 2 (100.0%) | 143.0 |
| Graduate Degree | 0 (0.0%) | 0.0 |
| Total | 2 (100.0%) | 38.0 |
Fertility by Education by Marriage Status in Swan Lake
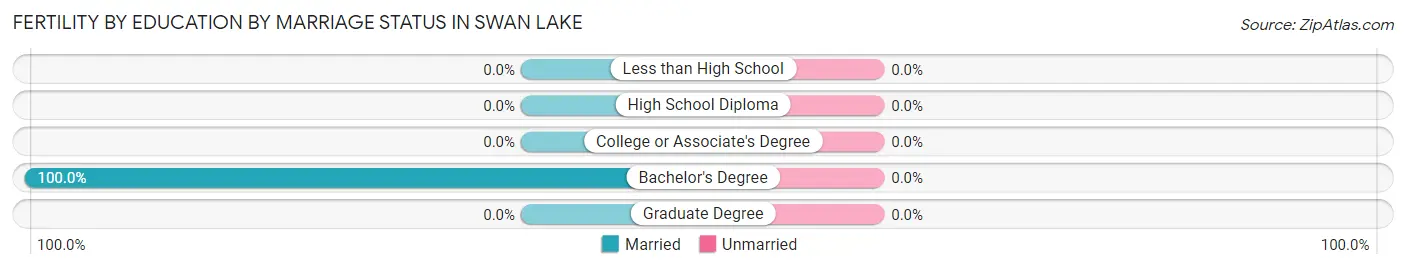
| Educational Attainment | Married | Unmarried |
| Less than High School | 0 (0.0%) | 0 (0.0%) |
| High School Diploma | 0 (0.0%) | 0 (0.0%) |
| College or Associate's Degree | 0 (0.0%) | 0 (0.0%) |
| Bachelor's Degree | 2 (100.0%) | 0 (0.0%) |
| Graduate Degree | 0 (0.0%) | 0 (0.0%) |
| Total | 2 (100.0%) | 0 (0.0%) |
Employment Characteristics in Swan Lake
Employment by Class of Employer in Swan Lake
Among the 96 employed individuals in Swan Lake, private company employees (53 | 55.2%), not-for-profit organizations (22 | 22.9%), and self-employed (not incorporated) (9 | 9.4%) make up the most common classes of employment.
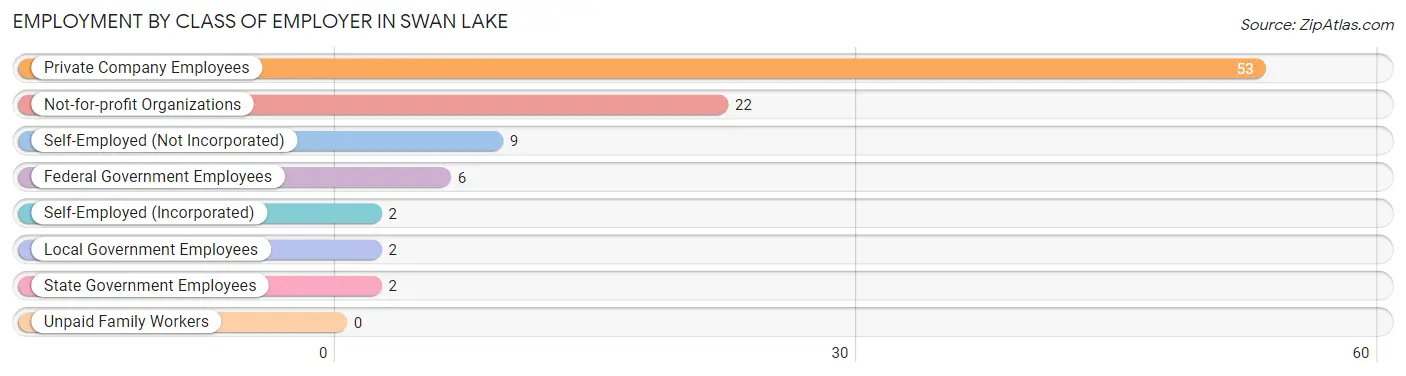
| Employer Class | # Employees | % Employees |
| Private Company Employees | 53 | 55.2% |
| Self-Employed (Incorporated) | 2 | 2.1% |
| Self-Employed (Not Incorporated) | 9 | 9.4% |
| Not-for-profit Organizations | 22 | 22.9% |
| Local Government Employees | 2 | 2.1% |
| State Government Employees | 2 | 2.1% |
| Federal Government Employees | 6 | 6.2% |
| Unpaid Family Workers | 0 | 0.0% |
| Total | 96 | 100.0% |
Employment Status by Age in Swan Lake
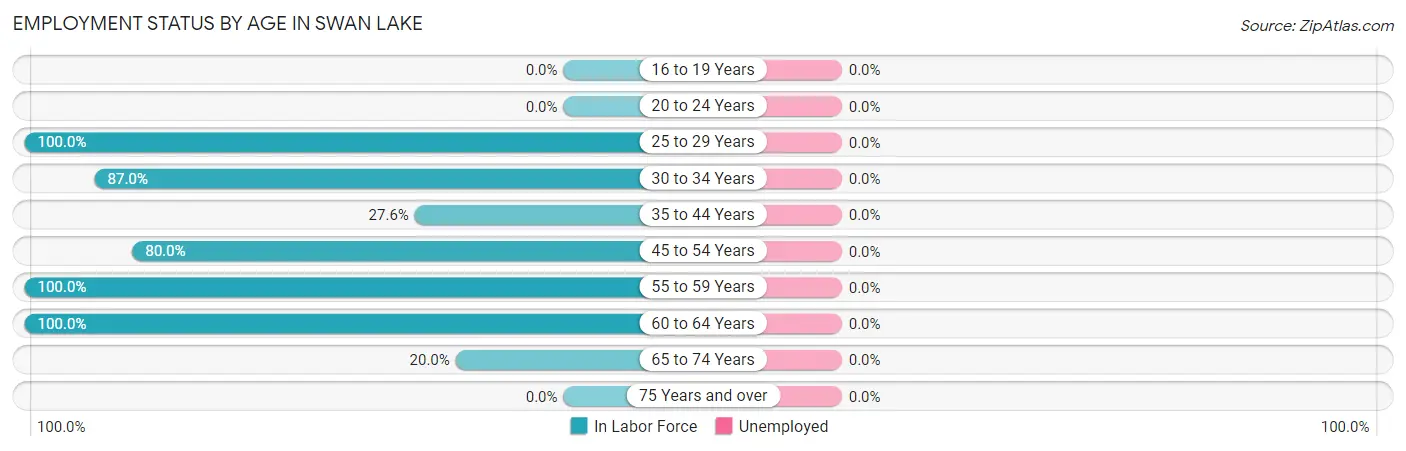
| Age Bracket | In Labor Force | Unemployed |
| 16 to 19 Years | 0 (0.0%) | 0 (0.0%) |
| 20 to 24 Years | 0 (0.0%) | 0 (0.0%) |
| 25 to 29 Years | 17 (100.0%) | 0 (0.0%) |
| 30 to 34 Years | 40 (87.0%) | 0 (0.0%) |
| 35 to 44 Years | 8 (27.6%) | 0 (0.0%) |
| 45 to 54 Years | 12 (80.0%) | 0 (0.0%) |
| 55 to 59 Years | 9 (100.0%) | 0 (0.0%) |
| 60 to 64 Years | 7 (100.0%) | 0 (0.0%) |
| 65 to 74 Years | 3 (20.0%) | 0 (0.0%) |
| 75 Years and over | 0 (0.0%) | 0 (0.0%) |
| Total | 96 (50.8%) | 0 (0.0%) |
Employment Status by Educational Attainment in Swan Lake
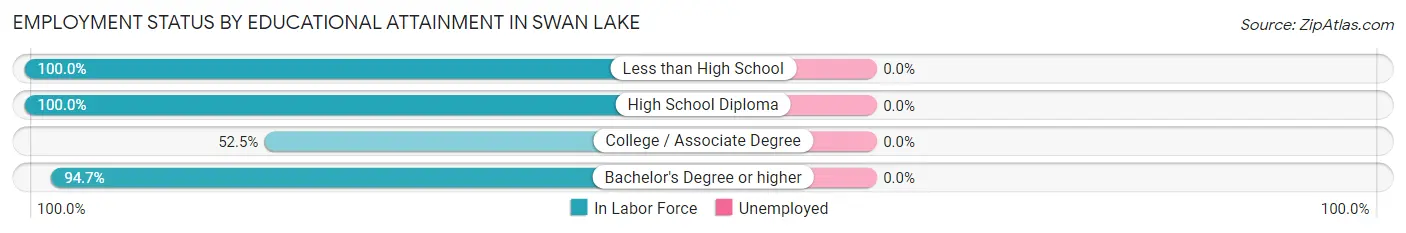
| Educational Attainment | In Labor Force | Unemployed |
| Less than High School | 8 (100.0%) | 0 (0.0%) |
| High School Diploma | 18 (100.0%) | 0 (0.0%) |
| College / Associate Degree | 31 (52.5%) | 0 (0.0%) |
| Bachelor's Degree or higher | 36 (94.7%) | 0 (0.0%) |
| Total | 93 (75.6%) | 0 (0.0%) |
Employment Occupations by Sex in Swan Lake
Management, Business, Science and Arts Occupations
The most common Management, Business, Science and Arts occupations in Swan Lake are Management (11 | 11.5%), Business & Financial (9 | 9.4%), Community & Social Service (8 | 8.3%), Education, Arts & Media (8 | 8.3%), and Computers, Engineering & Science (7 | 7.3%).

Management, Business, Science and Arts Occupations by Sex
Within the Management, Business, Science and Arts occupations in Swan Lake, the most male-oriented occupations are Computers, Engineering & Science (100.0%), Computers & Mathematics (100.0%), and Community & Social Service (100.0%), while the most female-oriented occupations are Management (81.8%), Business & Financial (66.7%), and Health Diagnosing & Treating (50.0%).
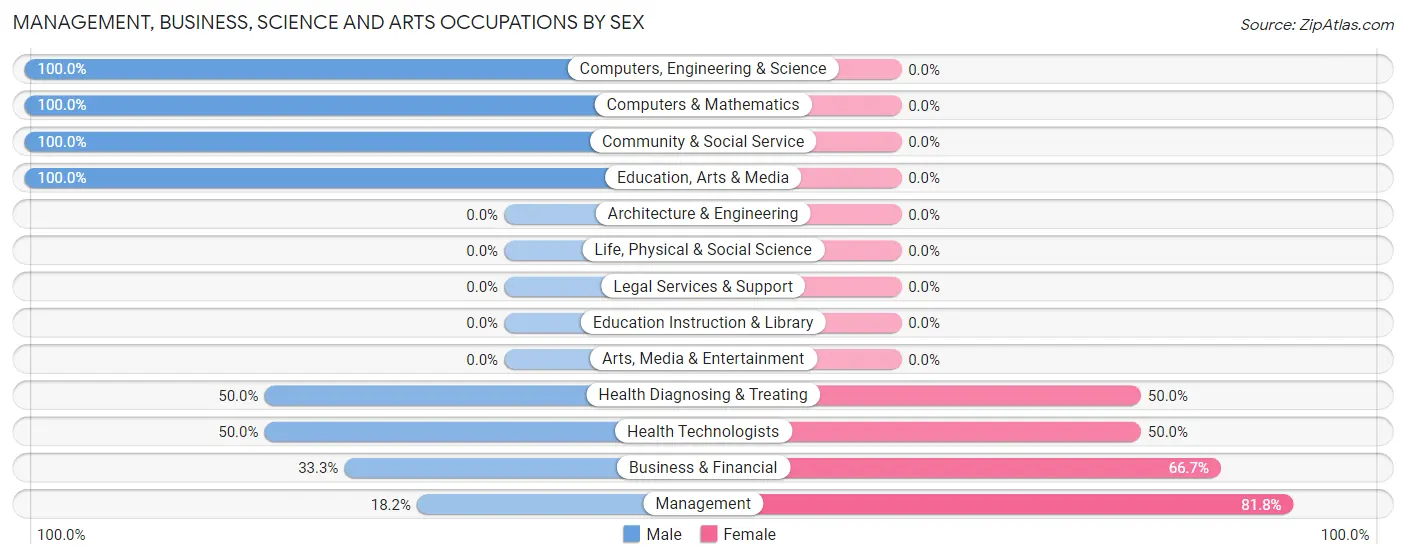
| Occupation | Male | Female |
| Management | 2 (18.2%) | 9 (81.8%) |
| Business & Financial | 3 (33.3%) | 6 (66.7%) |
| Computers, Engineering & Science | 7 (100.0%) | 0 (0.0%) |
| Computers & Mathematics | 7 (100.0%) | 0 (0.0%) |
| Architecture & Engineering | 0 (0.0%) | 0 (0.0%) |
| Life, Physical & Social Science | 0 (0.0%) | 0 (0.0%) |
| Community & Social Service | 8 (100.0%) | 0 (0.0%) |
| Education, Arts & Media | 8 (100.0%) | 0 (0.0%) |
| Legal Services & Support | 0 (0.0%) | 0 (0.0%) |
| Education Instruction & Library | 0 (0.0%) | 0 (0.0%) |
| Arts, Media & Entertainment | 0 (0.0%) | 0 (0.0%) |
| Health Diagnosing & Treating | 3 (50.0%) | 3 (50.0%) |
| Health Technologists | 3 (50.0%) | 3 (50.0%) |
| Total (Category) | 23 (56.1%) | 18 (43.9%) |
| Total (Overall) | 69 (71.9%) | 27 (28.1%) |
Services Occupations
The most common Services occupations in Swan Lake are Food Preparation & Serving (10 | 10.4%), Personal Care & Service (4 | 4.2%), Security & Protection (2 | 2.1%), and Firefighting & Prevention (2 | 2.1%).
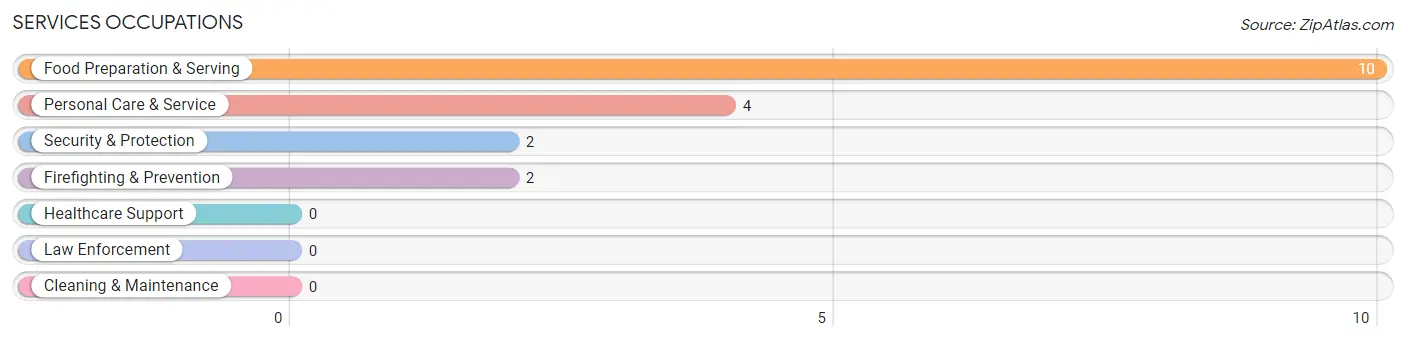
Services Occupations by Sex
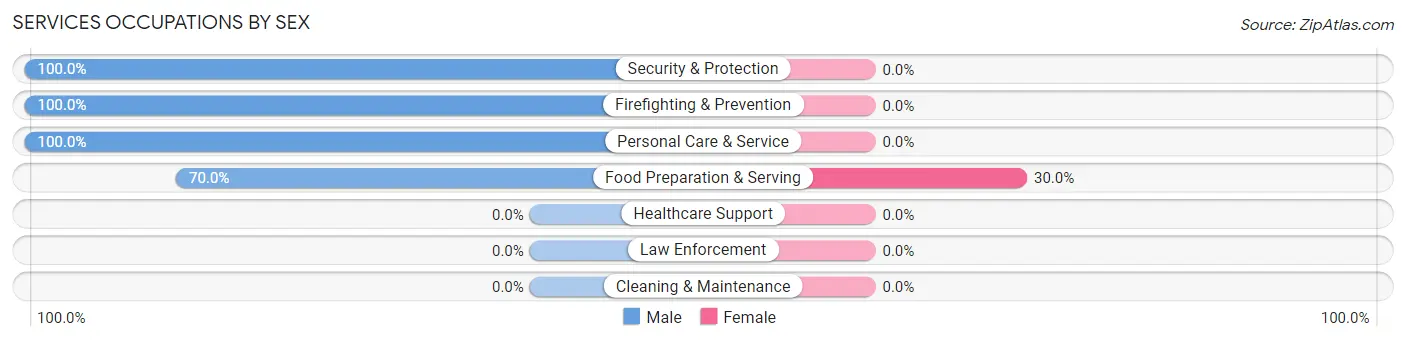
| Occupation | Male | Female |
| Healthcare Support | 0 (0.0%) | 0 (0.0%) |
| Security & Protection | 2 (100.0%) | 0 (0.0%) |
| Firefighting & Prevention | 2 (100.0%) | 0 (0.0%) |
| Law Enforcement | 0 (0.0%) | 0 (0.0%) |
| Food Preparation & Serving | 7 (70.0%) | 3 (30.0%) |
| Cleaning & Maintenance | 0 (0.0%) | 0 (0.0%) |
| Personal Care & Service | 4 (100.0%) | 0 (0.0%) |
| Total (Category) | 13 (81.2%) | 3 (18.8%) |
| Total (Overall) | 69 (71.9%) | 27 (28.1%) |
Sales and Office Occupations
The most common Sales and Office occupations in Swan Lake are Office & Administration (6 | 6.2%), and Sales & Related (1 | 1.0%).
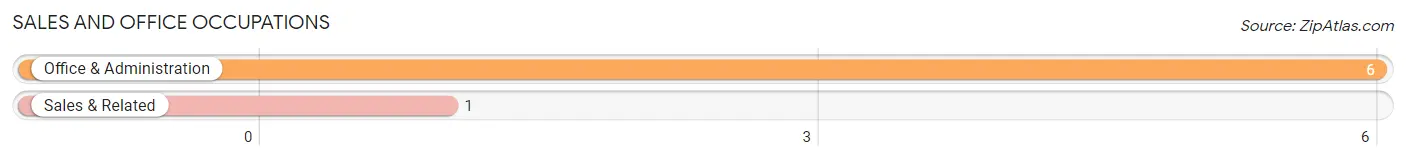
Sales and Office Occupations by Sex
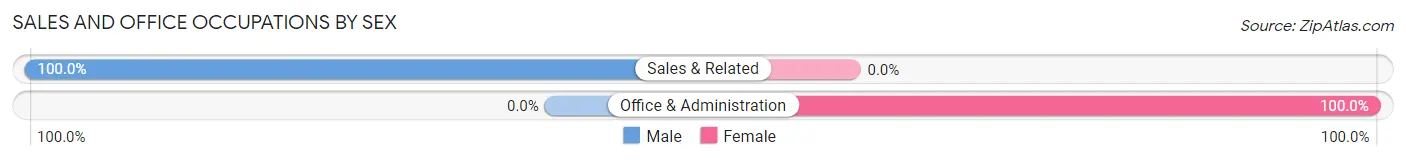
| Occupation | Male | Female |
| Sales & Related | 1 (100.0%) | 0 (0.0%) |
| Office & Administration | 0 (0.0%) | 6 (100.0%) |
| Total (Category) | 1 (14.3%) | 6 (85.7%) |
| Total (Overall) | 69 (71.9%) | 27 (28.1%) |
Natural Resources, Construction and Maintenance Occupations
The most common Natural Resources, Construction and Maintenance occupations in Swan Lake are Construction & Extraction (9 | 9.4%), and Installation, Maintenance & Repair (2 | 2.1%).
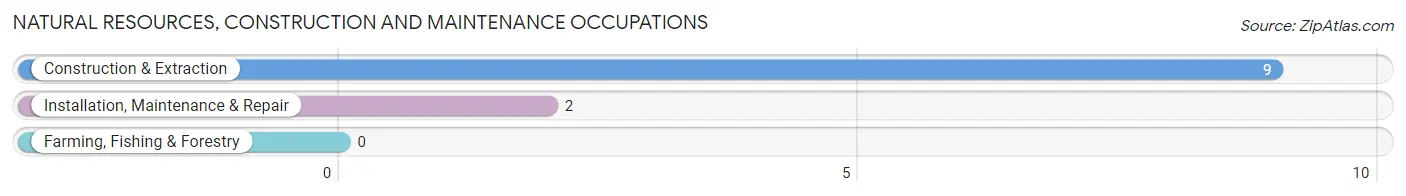
Natural Resources, Construction and Maintenance Occupations by Sex
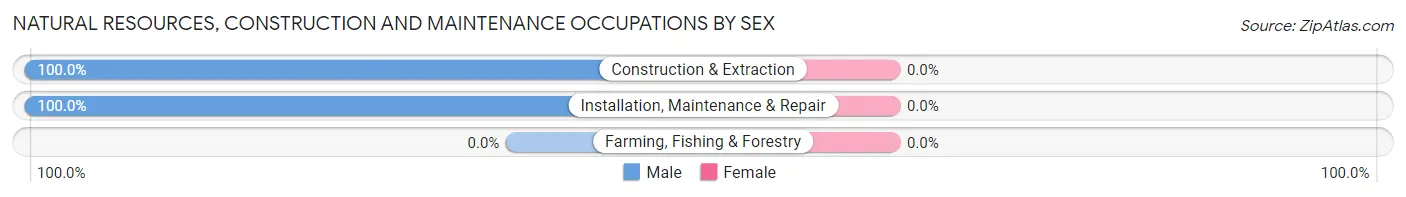
| Occupation | Male | Female |
| Farming, Fishing & Forestry | 0 (0.0%) | 0 (0.0%) |
| Construction & Extraction | 9 (100.0%) | 0 (0.0%) |
| Installation, Maintenance & Repair | 2 (100.0%) | 0 (0.0%) |
| Total (Category) | 11 (100.0%) | 0 (0.0%) |
| Total (Overall) | 69 (71.9%) | 27 (28.1%) |
Production, Transportation and Moving Occupations
The most common Production, Transportation and Moving occupations in Swan Lake are Material Moving (15 | 15.6%), Transportation (5 | 5.2%), and Production (1 | 1.0%).
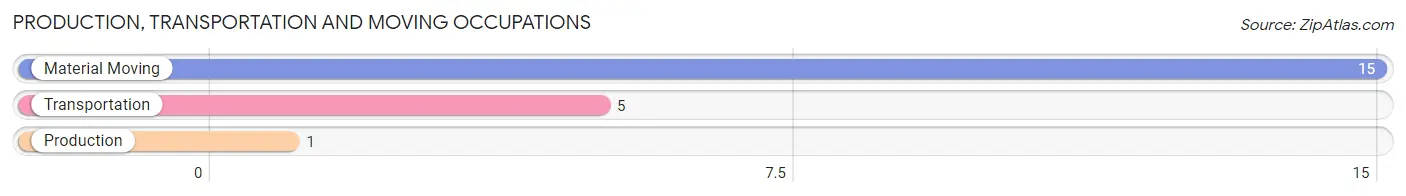
Production, Transportation and Moving Occupations by Sex
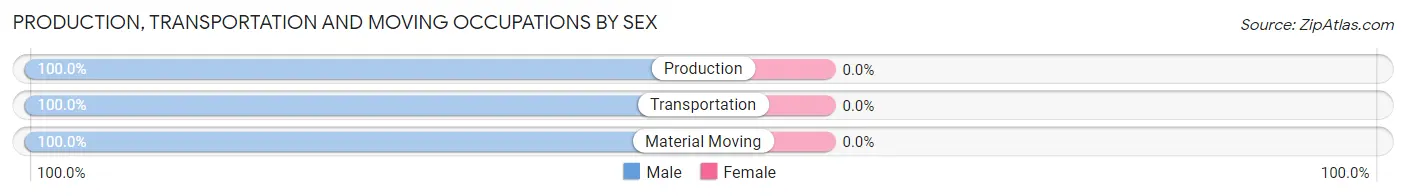
| Occupation | Male | Female |
| Production | 1 (100.0%) | 0 (0.0%) |
| Transportation | 5 (100.0%) | 0 (0.0%) |
| Material Moving | 15 (100.0%) | 0 (0.0%) |
| Total (Category) | 21 (100.0%) | 0 (0.0%) |
| Total (Overall) | 69 (71.9%) | 27 (28.1%) |
Employment Industries by Sex in Swan Lake
Employment Industries in Swan Lake
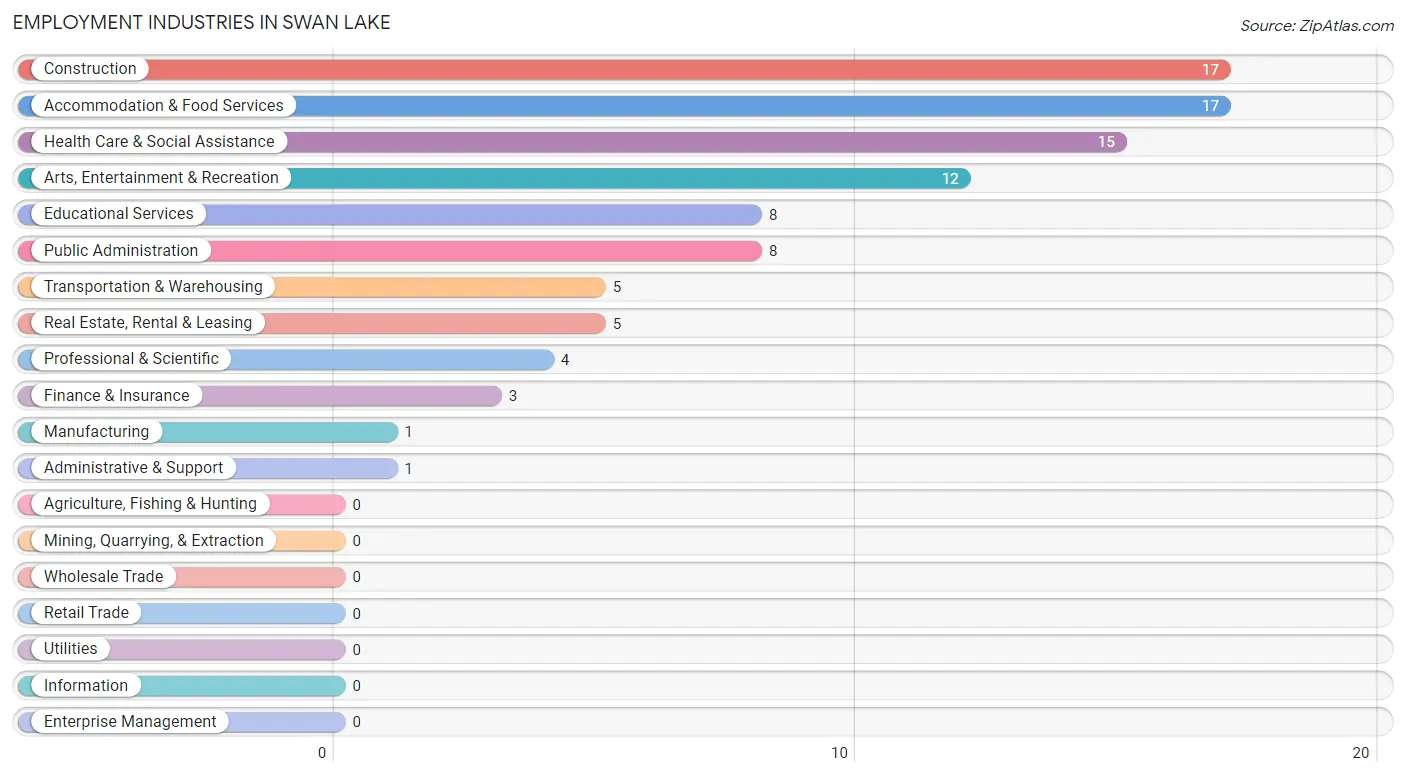
The major employment industries in Swan Lake include Construction (17 | 17.7%), Accommodation & Food Services (17 | 17.7%), Health Care & Social Assistance (15 | 15.6%), Arts, Entertainment & Recreation (12 | 12.5%), and Educational Services (8 | 8.3%).
Employment Industries by Sex in Swan Lake
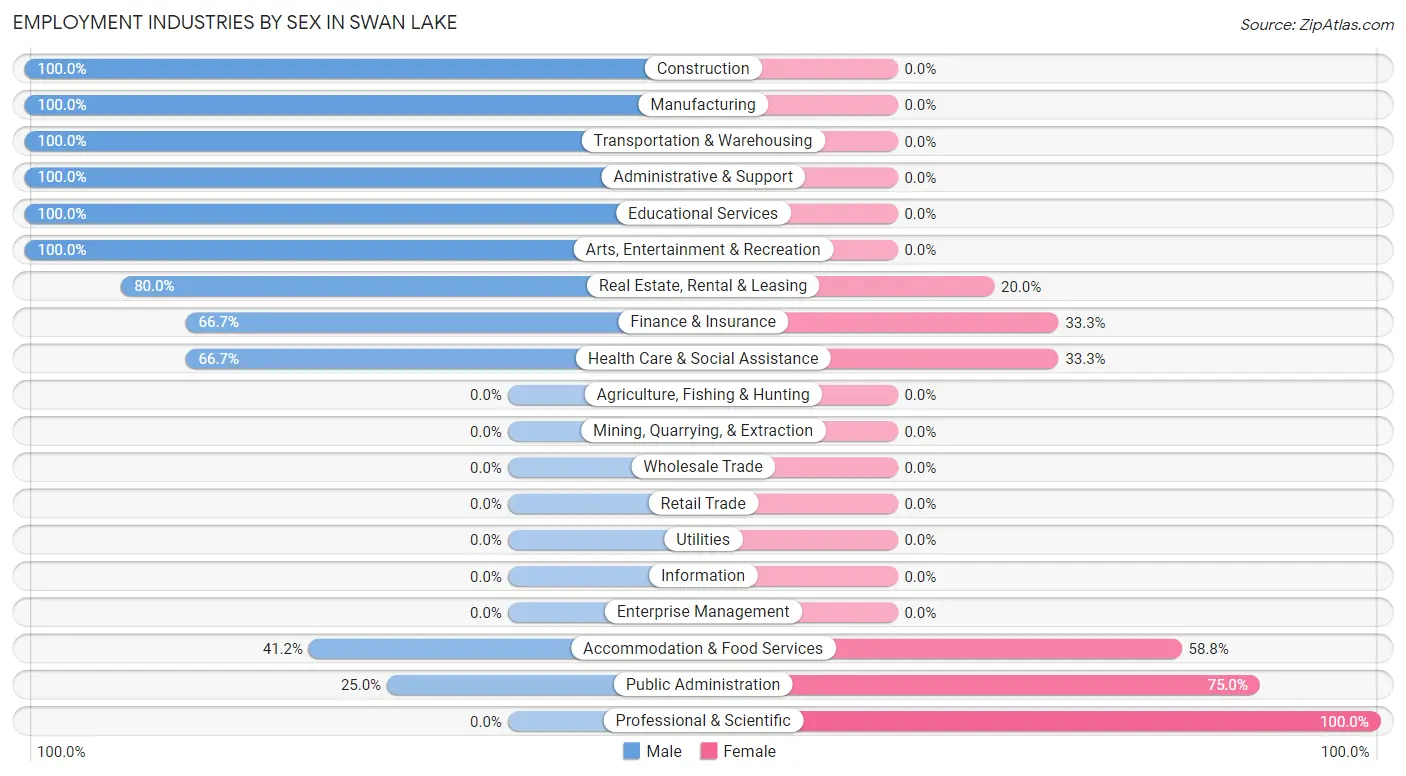
The Swan Lake industries that see more men than women are Construction (100.0%), Manufacturing (100.0%), and Transportation & Warehousing (100.0%), whereas the industries that tend to have a higher number of women are Professional & Scientific (100.0%), Public Administration (75.0%), and Accommodation & Food Services (58.8%).
| Industry | Male | Female |
| Agriculture, Fishing & Hunting | 0 (0.0%) | 0 (0.0%) |
| Mining, Quarrying, & Extraction | 0 (0.0%) | 0 (0.0%) |
| Construction | 17 (100.0%) | 0 (0.0%) |
| Manufacturing | 1 (100.0%) | 0 (0.0%) |
| Wholesale Trade | 0 (0.0%) | 0 (0.0%) |
| Retail Trade | 0 (0.0%) | 0 (0.0%) |
| Transportation & Warehousing | 5 (100.0%) | 0 (0.0%) |
| Utilities | 0 (0.0%) | 0 (0.0%) |
| Information | 0 (0.0%) | 0 (0.0%) |
| Finance & Insurance | 2 (66.7%) | 1 (33.3%) |
| Real Estate, Rental & Leasing | 4 (80.0%) | 1 (20.0%) |
| Professional & Scientific | 0 (0.0%) | 4 (100.0%) |
| Enterprise Management | 0 (0.0%) | 0 (0.0%) |
| Administrative & Support | 1 (100.0%) | 0 (0.0%) |
| Educational Services | 8 (100.0%) | 0 (0.0%) |
| Health Care & Social Assistance | 10 (66.7%) | 5 (33.3%) |
| Arts, Entertainment & Recreation | 12 (100.0%) | 0 (0.0%) |
| Accommodation & Food Services | 7 (41.2%) | 10 (58.8%) |
| Public Administration | 2 (25.0%) | 6 (75.0%) |
| Total | 69 (71.9%) | 27 (28.1%) |
Education in Swan Lake
School Enrollment in Swan Lake
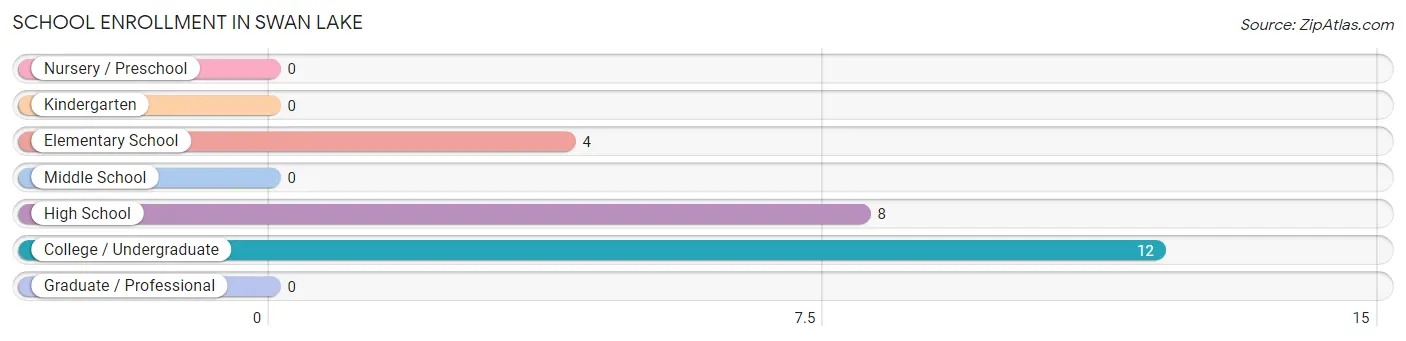
The most common levels of schooling among the 24 students in Swan Lake are college / undergraduate (12 | 50.0%), high school (8 | 33.3%), and elementary school (4 | 16.7%).
| School Level | # Students | % Students |
| Nursery / Preschool | 0 | 0.0% |
| Kindergarten | 0 | 0.0% |
| Elementary School | 4 | 16.7% |
| Middle School | 0 | 0.0% |
| High School | 8 | 33.3% |
| College / Undergraduate | 12 | 50.0% |
| Graduate / Professional | 0 | 0.0% |
| Total | 24 | 100.0% |
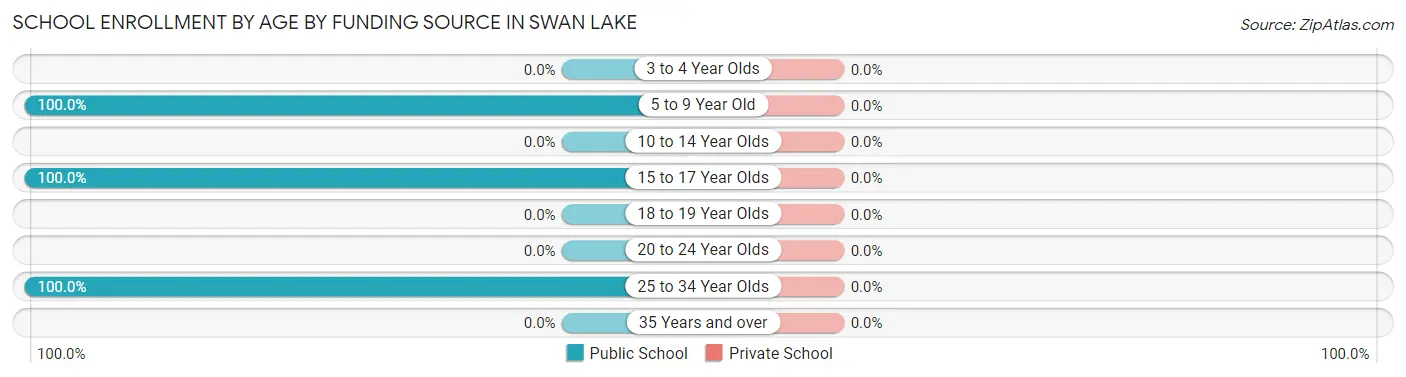
School Enrollment by Age by Funding Source in Swan Lake
| Age Bracket | Public School | Private School |
| 3 to 4 Year Olds | 0 (0.0%) | 0 (0.0%) |
| 5 to 9 Year Old | 4 (100.0%) | 0 (0.0%) |
| 10 to 14 Year Olds | 0 (0.0%) | 0 (0.0%) |
| 15 to 17 Year Olds | 8 (100.0%) | 0 (0.0%) |
| 18 to 19 Year Olds | 0 (0.0%) | 0 (0.0%) |
| 20 to 24 Year Olds | 0 (0.0%) | 0 (0.0%) |
| 25 to 34 Year Olds | 12 (100.0%) | 0 (0.0%) |
| 35 Years and over | 0 (0.0%) | 0 (0.0%) |
| Total | 24 (100.0%) | 0 (0.0%) |
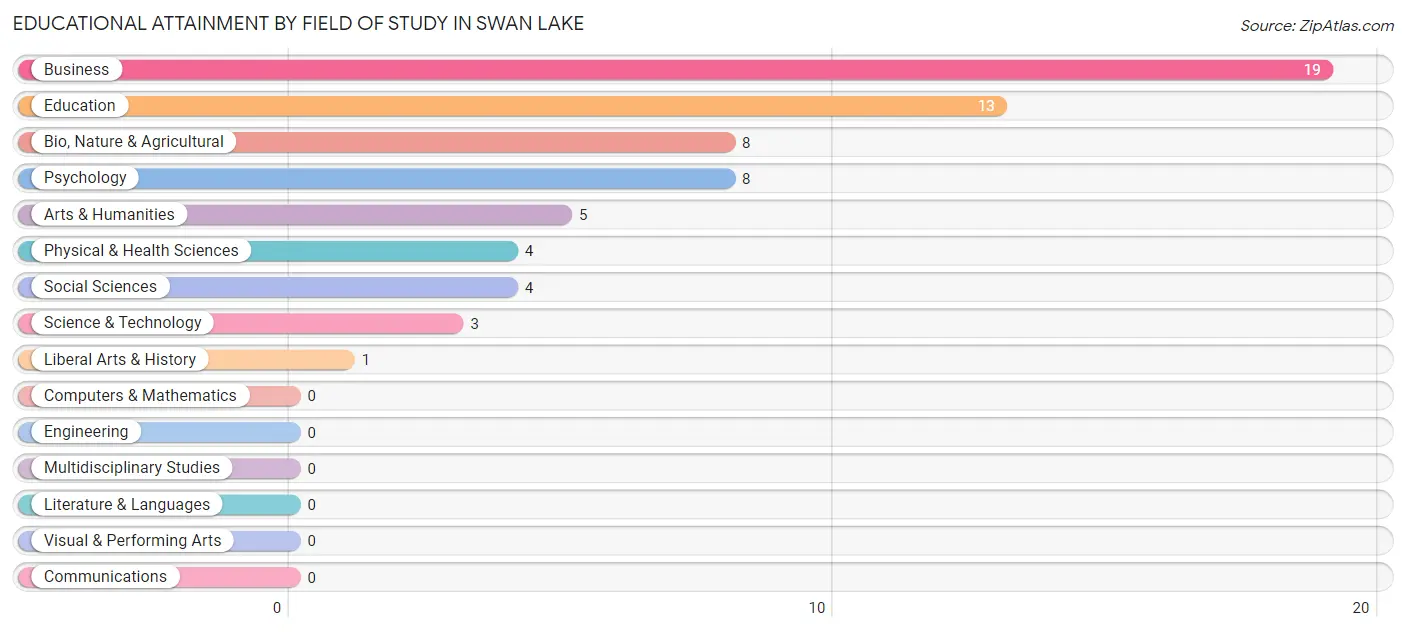
Educational Attainment by Field of Study in Swan Lake
Business (19 | 29.2%), education (13 | 20.0%), bio, nature & agricultural (8 | 12.3%), psychology (8 | 12.3%), and arts & humanities (5 | 7.7%) are the most common fields of study among 65 individuals in Swan Lake who have obtained a bachelor's degree or higher.
| Field of Study | # Graduates | % Graduates |
| Computers & Mathematics | 0 | 0.0% |
| Bio, Nature & Agricultural | 8 | 12.3% |
| Physical & Health Sciences | 4 | 6.1% |
| Psychology | 8 | 12.3% |
| Social Sciences | 4 | 6.1% |
| Engineering | 0 | 0.0% |
| Multidisciplinary Studies | 0 | 0.0% |
| Science & Technology | 3 | 4.6% |
| Business | 19 | 29.2% |
| Education | 13 | 20.0% |
| Literature & Languages | 0 | 0.0% |
| Liberal Arts & History | 1 | 1.5% |
| Visual & Performing Arts | 0 | 0.0% |
| Communications | 0 | 0.0% |
| Arts & Humanities | 5 | 7.7% |
| Total | 65 | 100.0% |
Transportation & Commute in Swan Lake
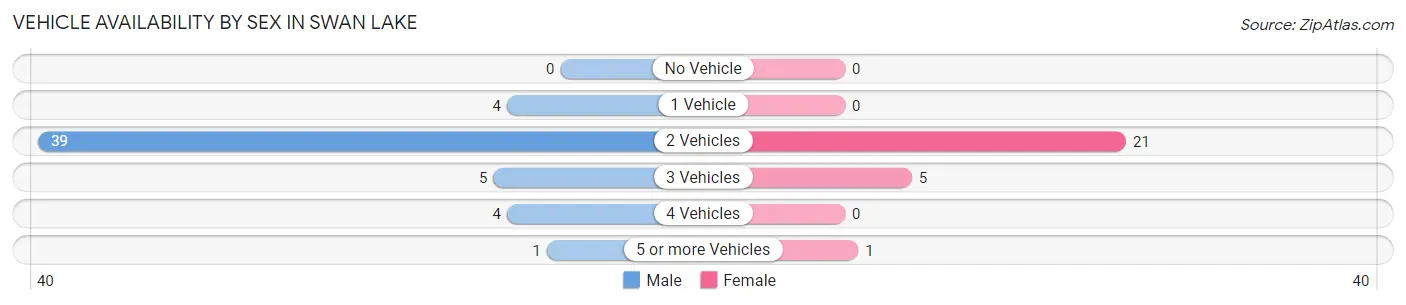
Vehicle Availability by Sex in Swan Lake
The most prevalent vehicle ownership categories in Swan Lake are males with 2 vehicles (39, accounting for 73.6%) and females with 2 vehicles (21, making up 144.4%).
| Vehicles Available | Male | Female |
| No Vehicle | 0 (0.0%) | 0 (0.0%) |
| 1 Vehicle | 4 (7.5%) | 0 (0.0%) |
| 2 Vehicles | 39 (73.6%) | 21 (77.8%) |
| 3 Vehicles | 5 (9.4%) | 5 (18.5%) |
| 4 Vehicles | 4 (7.5%) | 0 (0.0%) |
| 5 or more Vehicles | 1 (1.9%) | 1 (3.7%) |
| Total | 53 (100.0%) | 27 (100.0%) |
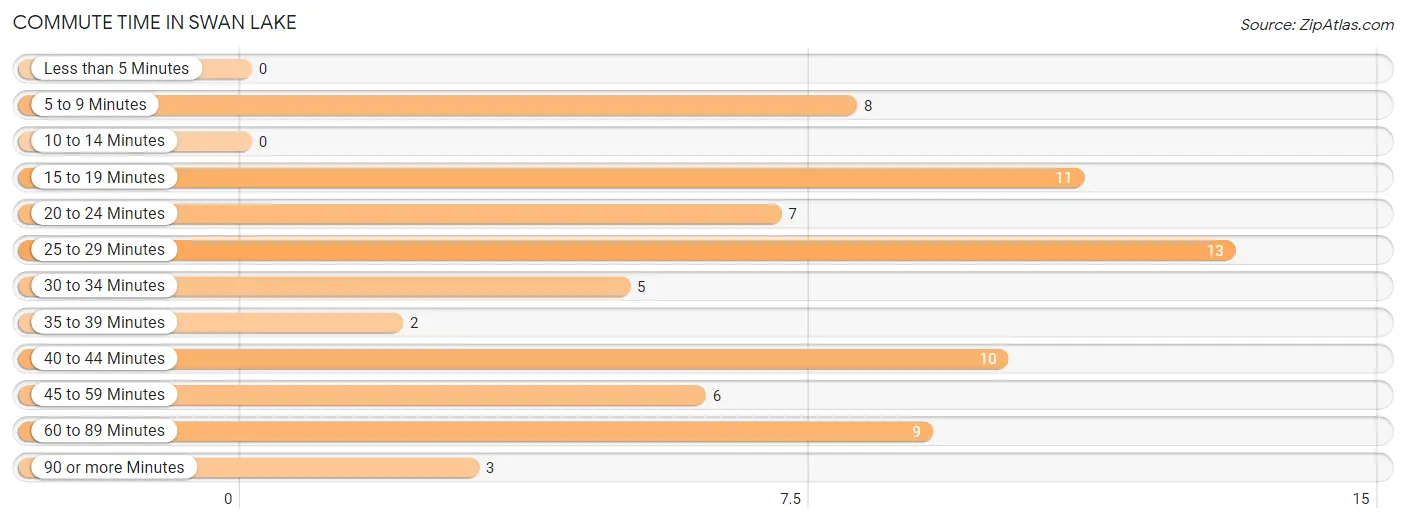
Commute Time in Swan Lake
The most frequently occuring commute durations in Swan Lake are 25 to 29 minutes (13 commuters, 17.6%), 15 to 19 minutes (11 commuters, 14.9%), and 40 to 44 minutes (10 commuters, 13.5%).
| Commute Time | # Commuters | % Commuters |
| Less than 5 Minutes | 0 | 0.0% |
| 5 to 9 Minutes | 8 | 10.8% |
| 10 to 14 Minutes | 0 | 0.0% |
| 15 to 19 Minutes | 11 | 14.9% |
| 20 to 24 Minutes | 7 | 9.5% |
| 25 to 29 Minutes | 13 | 17.6% |
| 30 to 34 Minutes | 5 | 6.8% |
| 35 to 39 Minutes | 2 | 2.7% |
| 40 to 44 Minutes | 10 | 13.5% |
| 45 to 59 Minutes | 6 | 8.1% |
| 60 to 89 Minutes | 9 | 12.2% |
| 90 or more Minutes | 3 | 4.1% |
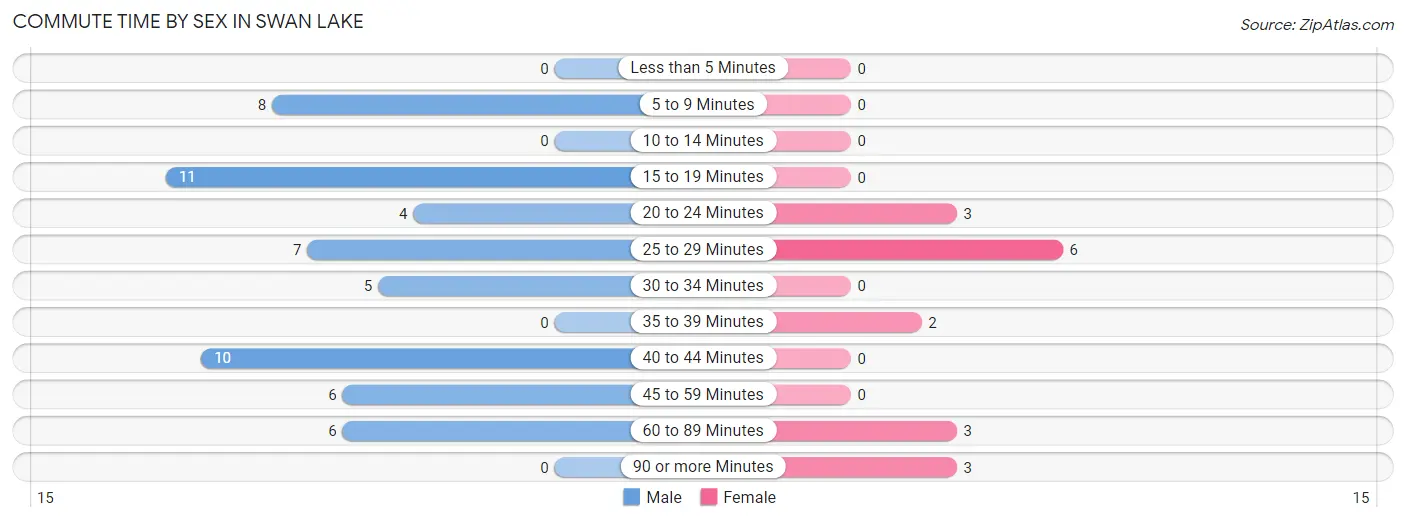
Commute Time by Sex in Swan Lake
The most common commute times in Swan Lake are 15 to 19 minutes (11 commuters, 19.3%) for males and 25 to 29 minutes (6 commuters, 35.3%) for females.
| Commute Time | Male | Female |
| Less than 5 Minutes | 0 (0.0%) | 0 (0.0%) |
| 5 to 9 Minutes | 8 (14.0%) | 0 (0.0%) |
| 10 to 14 Minutes | 0 (0.0%) | 0 (0.0%) |
| 15 to 19 Minutes | 11 (19.3%) | 0 (0.0%) |
| 20 to 24 Minutes | 4 (7.0%) | 3 (17.6%) |
| 25 to 29 Minutes | 7 (12.3%) | 6 (35.3%) |
| 30 to 34 Minutes | 5 (8.8%) | 0 (0.0%) |
| 35 to 39 Minutes | 0 (0.0%) | 2 (11.8%) |
| 40 to 44 Minutes | 10 (17.5%) | 0 (0.0%) |
| 45 to 59 Minutes | 6 (10.5%) | 0 (0.0%) |
| 60 to 89 Minutes | 6 (10.5%) | 3 (17.6%) |
| 90 or more Minutes | 0 (0.0%) | 3 (17.6%) |
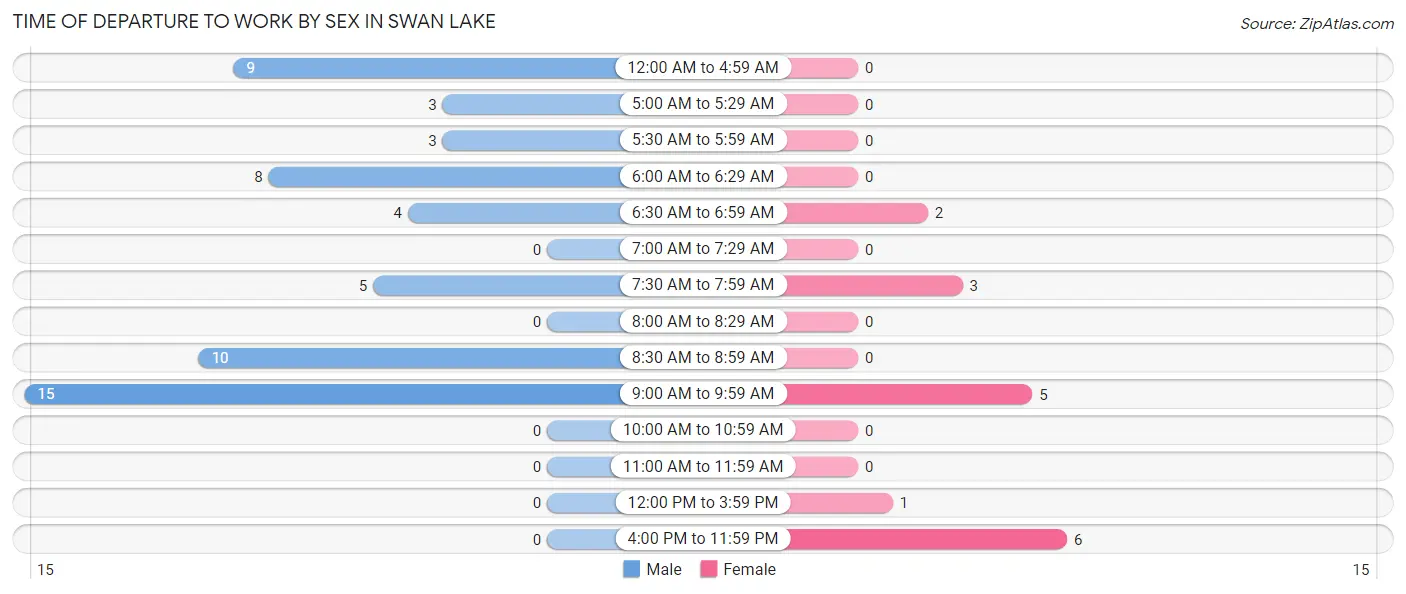
Time of Departure to Work by Sex in Swan Lake
The most frequent times of departure to work in Swan Lake are 9:00 AM to 9:59 AM (15, 26.3%) for males and 4:00 PM to 11:59 PM (6, 35.3%) for females.
| Time of Departure | Male | Female |
| 12:00 AM to 4:59 AM | 9 (15.8%) | 0 (0.0%) |
| 5:00 AM to 5:29 AM | 3 (5.3%) | 0 (0.0%) |
| 5:30 AM to 5:59 AM | 3 (5.3%) | 0 (0.0%) |
| 6:00 AM to 6:29 AM | 8 (14.0%) | 0 (0.0%) |
| 6:30 AM to 6:59 AM | 4 (7.0%) | 2 (11.8%) |
| 7:00 AM to 7:29 AM | 0 (0.0%) | 0 (0.0%) |
| 7:30 AM to 7:59 AM | 5 (8.8%) | 3 (17.6%) |
| 8:00 AM to 8:29 AM | 0 (0.0%) | 0 (0.0%) |
| 8:30 AM to 8:59 AM | 10 (17.5%) | 0 (0.0%) |
| 9:00 AM to 9:59 AM | 15 (26.3%) | 5 (29.4%) |
| 10:00 AM to 10:59 AM | 0 (0.0%) | 0 (0.0%) |
| 11:00 AM to 11:59 AM | 0 (0.0%) | 0 (0.0%) |
| 12:00 PM to 3:59 PM | 0 (0.0%) | 1 (5.9%) |
| 4:00 PM to 11:59 PM | 0 (0.0%) | 6 (35.3%) |
| Total | 57 (100.0%) | 17 (100.0%) |
Housing Occupancy in Swan Lake
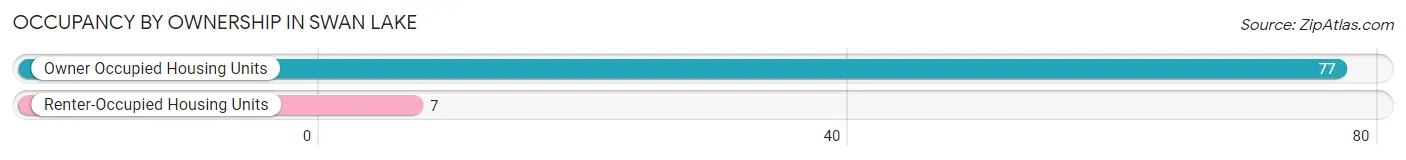
Occupancy by Ownership in Swan Lake
Of the total 84 dwellings in Swan Lake, owner-occupied units account for 77 (91.7%), while renter-occupied units make up 7 (8.3%).
| Occupancy | # Housing Units | % Housing Units |
| Owner Occupied Housing Units | 77 | 91.7% |
| Renter-Occupied Housing Units | 7 | 8.3% |
| Total Occupied Housing Units | 84 | 100.0% |
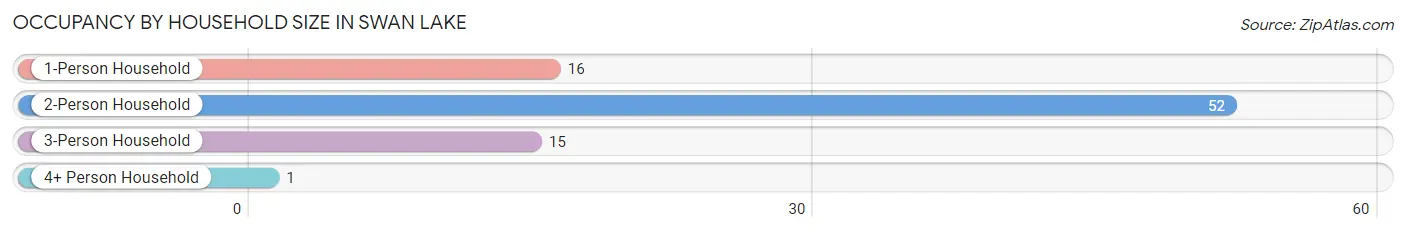
Occupancy by Household Size in Swan Lake
| Household Size | # Housing Units | % Housing Units |
| 1-Person Household | 16 | 19.1% |
| 2-Person Household | 52 | 61.9% |
| 3-Person Household | 15 | 17.9% |
| 4+ Person Household | 1 | 1.2% |
| Total Housing Units | 84 | 100.0% |
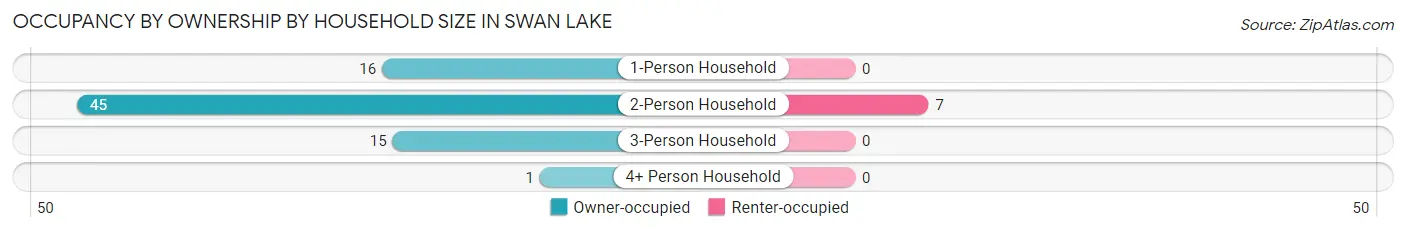
Occupancy by Ownership by Household Size in Swan Lake
| Household Size | Owner-occupied | Renter-occupied |
| 1-Person Household | 16 (100.0%) | 0 (0.0%) |
| 2-Person Household | 45 (86.5%) | 7 (13.5%) |
| 3-Person Household | 15 (100.0%) | 0 (0.0%) |
| 4+ Person Household | 1 (100.0%) | 0 (0.0%) |
| Total Housing Units | 77 (91.7%) | 7 (8.3%) |
Occupancy by Educational Attainment in Swan Lake
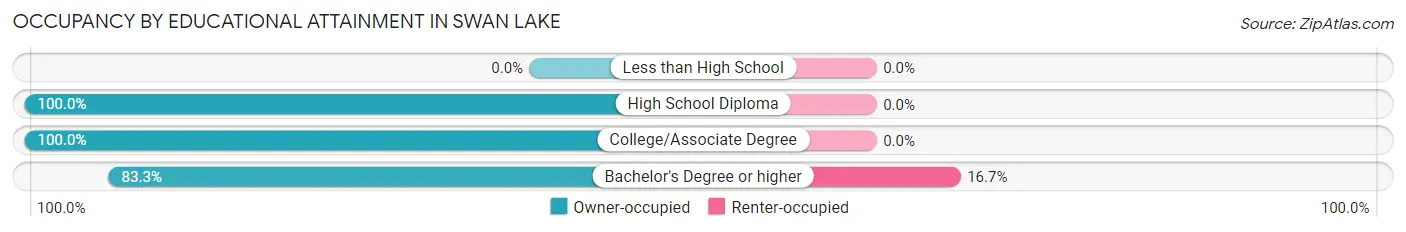
| Household Size | Owner-occupied | Renter-occupied |
| Less than High School | 0 (0.0%) | 0 (0.0%) |
| High School Diploma | 18 (100.0%) | 0 (0.0%) |
| College/Associate Degree | 24 (100.0%) | 0 (0.0%) |
| Bachelor's Degree or higher | 35 (83.3%) | 7 (16.7%) |
Occupancy by Age of Householder in Swan Lake
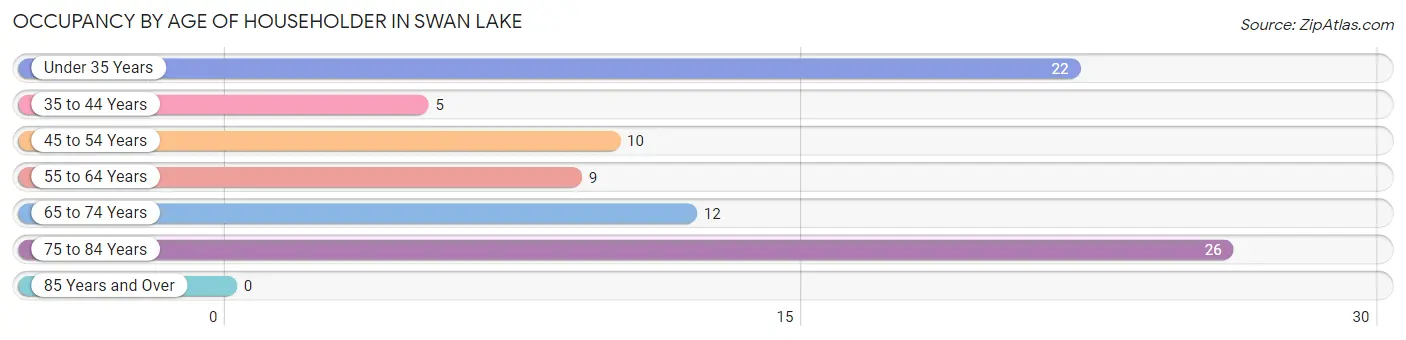
| Age Bracket | # Households | % Households |
| Under 35 Years | 22 | 26.2% |
| 35 to 44 Years | 5 | 5.9% |
| 45 to 54 Years | 10 | 11.9% |
| 55 to 64 Years | 9 | 10.7% |
| 65 to 74 Years | 12 | 14.3% |
| 75 to 84 Years | 26 | 30.9% |
| 85 Years and Over | 0 | 0.0% |
| Total | 84 | 100.0% |
Housing Finances in Swan Lake
Median Income by Occupancy in Swan Lake
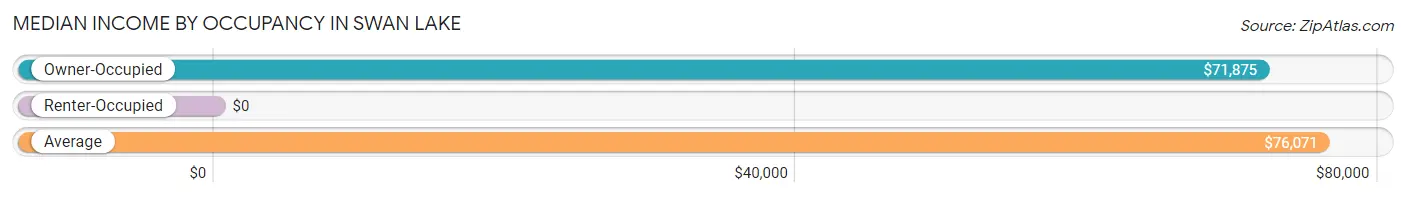
| Occupancy Type | # Households | Median Income |
| Owner-Occupied | 77 (91.7%) | $71,875 |
| Renter-Occupied | 7 (8.3%) | $0 |
| Average | 84 (100.0%) | $76,071 |
Occupancy by Householder Income Bracket in Swan Lake
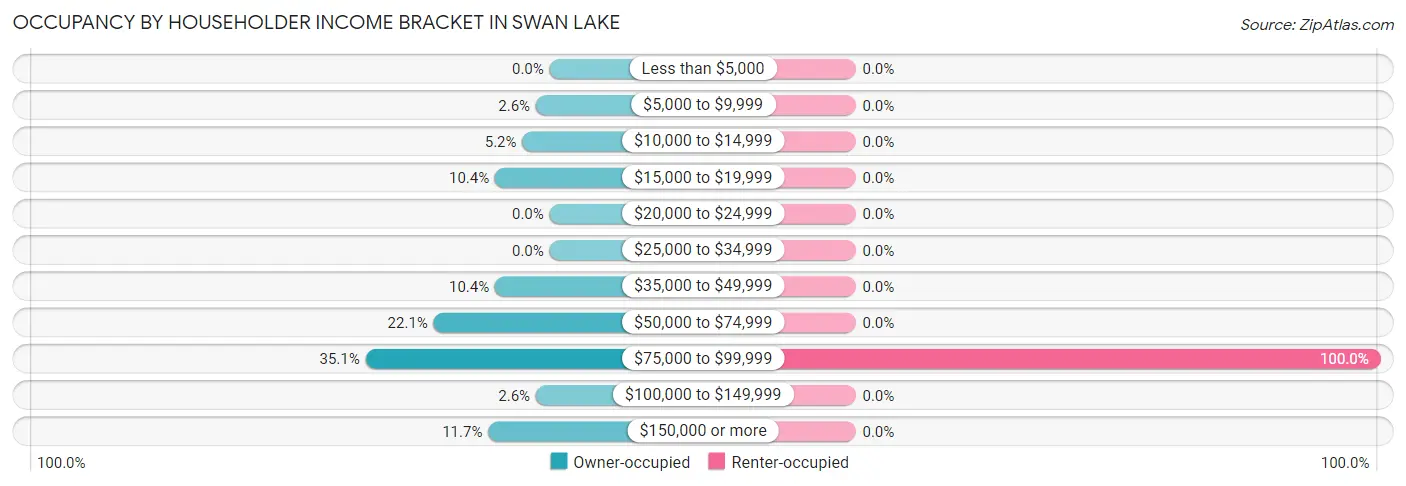
| Income Bracket | Owner-occupied | Renter-occupied |
| Less than $5,000 | 0 (0.0%) | 0 (0.0%) |
| $5,000 to $9,999 | 2 (2.6%) | 0 (0.0%) |
| $10,000 to $14,999 | 4 (5.2%) | 0 (0.0%) |
| $15,000 to $19,999 | 8 (10.4%) | 0 (0.0%) |
| $20,000 to $24,999 | 0 (0.0%) | 0 (0.0%) |
| $25,000 to $34,999 | 0 (0.0%) | 0 (0.0%) |
| $35,000 to $49,999 | 8 (10.4%) | 0 (0.0%) |
| $50,000 to $74,999 | 17 (22.1%) | 0 (0.0%) |
| $75,000 to $99,999 | 27 (35.1%) | 7 (100.0%) |
| $100,000 to $149,999 | 2 (2.6%) | 0 (0.0%) |
| $150,000 or more | 9 (11.7%) | 0 (0.0%) |
| Total | 77 (100.0%) | 7 (100.0%) |
Monthly Housing Cost Tiers in Swan Lake
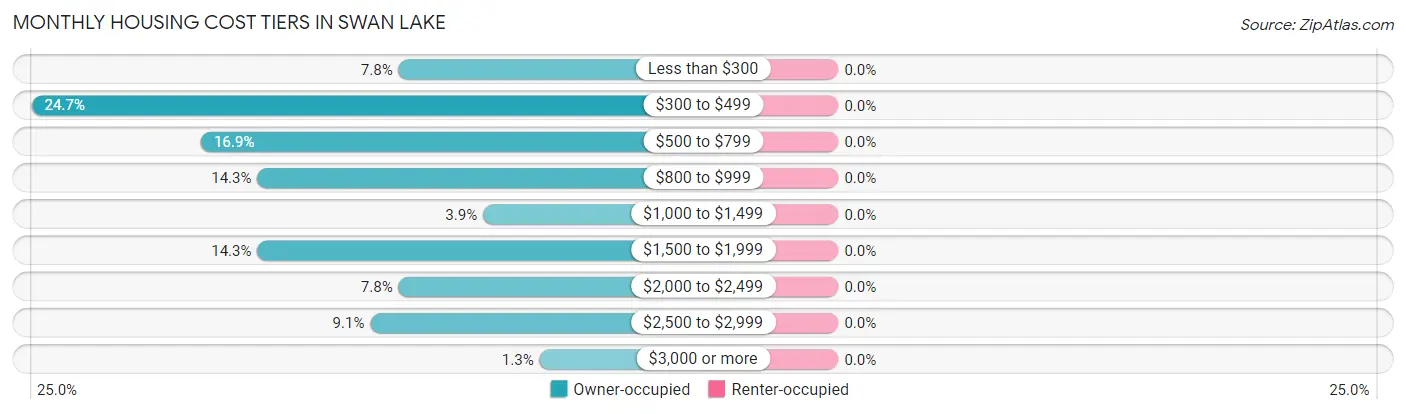
| Monthly Cost | Owner-occupied | Renter-occupied |
| Less than $300 | 6 (7.8%) | 0 (0.0%) |
| $300 to $499 | 19 (24.7%) | 0 (0.0%) |
| $500 to $799 | 13 (16.9%) | 0 (0.0%) |
| $800 to $999 | 11 (14.3%) | 0 (0.0%) |
| $1,000 to $1,499 | 3 (3.9%) | 0 (0.0%) |
| $1,500 to $1,999 | 11 (14.3%) | 0 (0.0%) |
| $2,000 to $2,499 | 6 (7.8%) | 0 (0.0%) |
| $2,500 to $2,999 | 7 (9.1%) | 0 (0.0%) |
| $3,000 or more | 1 (1.3%) | 0 (0.0%) |
| Total | 77 (100.0%) | 7 (100.0%) |
Physical Housing Characteristics in Swan Lake
Housing Structures in Swan Lake
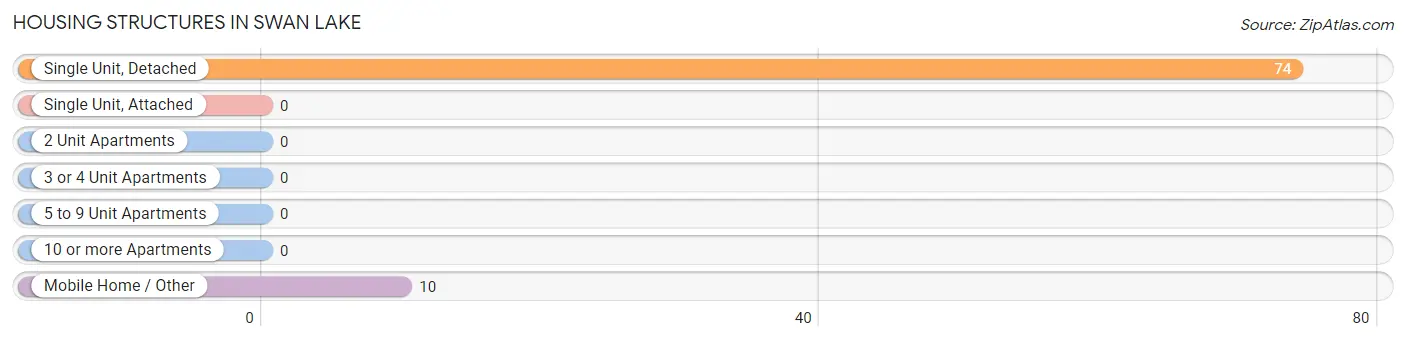
| Structure Type | # Housing Units | % Housing Units |
| Single Unit, Detached | 74 | 88.1% |
| Single Unit, Attached | 0 | 0.0% |
| 2 Unit Apartments | 0 | 0.0% |
| 3 or 4 Unit Apartments | 0 | 0.0% |
| 5 to 9 Unit Apartments | 0 | 0.0% |
| 10 or more Apartments | 0 | 0.0% |
| Mobile Home / Other | 10 | 11.9% |
| Total | 84 | 100.0% |
Housing Structures by Occupancy in Swan Lake
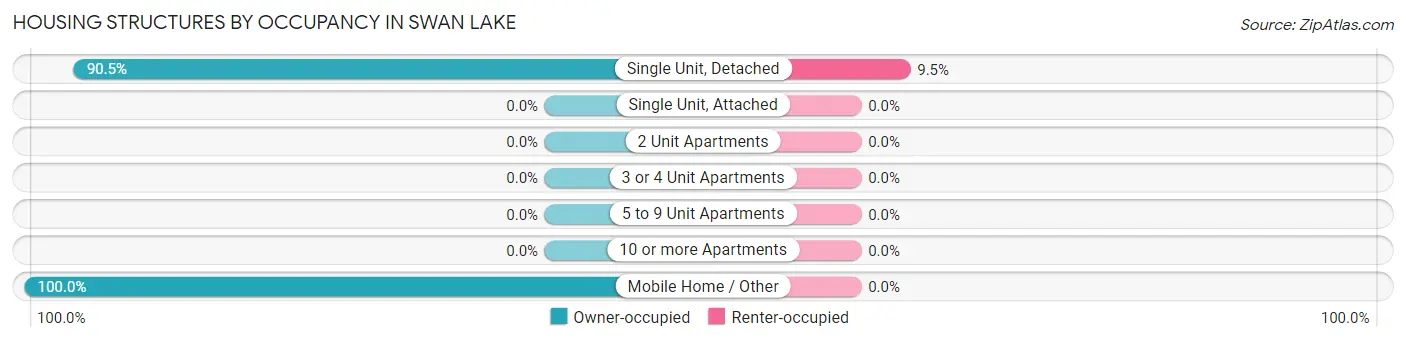
| Structure Type | Owner-occupied | Renter-occupied |
| Single Unit, Detached | 67 (90.5%) | 7 (9.5%) |
| Single Unit, Attached | 0 (0.0%) | 0 (0.0%) |
| 2 Unit Apartments | 0 (0.0%) | 0 (0.0%) |
| 3 or 4 Unit Apartments | 0 (0.0%) | 0 (0.0%) |
| 5 to 9 Unit Apartments | 0 (0.0%) | 0 (0.0%) |
| 10 or more Apartments | 0 (0.0%) | 0 (0.0%) |
| Mobile Home / Other | 10 (100.0%) | 0 (0.0%) |
| Total | 77 (91.7%) | 7 (8.3%) |
Housing Structures by Number of Rooms in Swan Lake
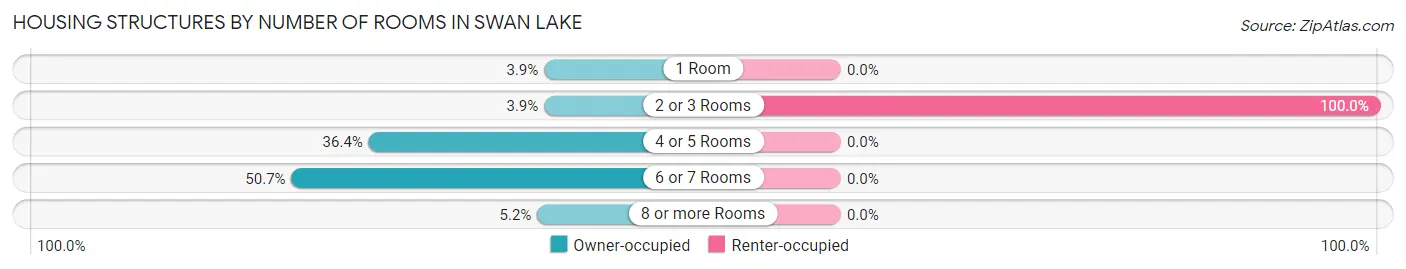
| Number of Rooms | Owner-occupied | Renter-occupied |
| 1 Room | 3 (3.9%) | 0 (0.0%) |
| 2 or 3 Rooms | 3 (3.9%) | 7 (100.0%) |
| 4 or 5 Rooms | 28 (36.4%) | 0 (0.0%) |
| 6 or 7 Rooms | 39 (50.6%) | 0 (0.0%) |
| 8 or more Rooms | 4 (5.2%) | 0 (0.0%) |
| Total | 77 (100.0%) | 7 (100.0%) |
Housing Structure by Heating Type in Swan Lake
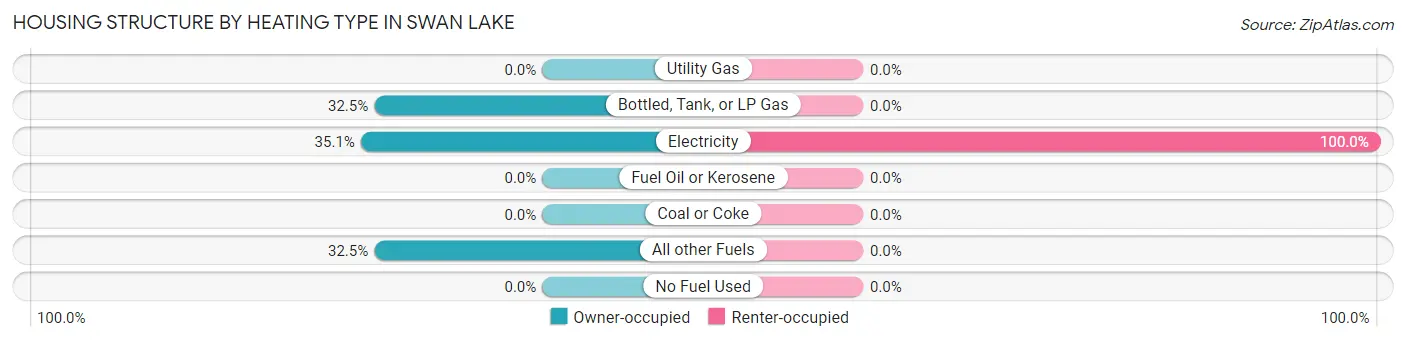
| Heating Type | Owner-occupied | Renter-occupied |
| Utility Gas | 0 (0.0%) | 0 (0.0%) |
| Bottled, Tank, or LP Gas | 25 (32.5%) | 0 (0.0%) |
| Electricity | 27 (35.1%) | 7 (100.0%) |
| Fuel Oil or Kerosene | 0 (0.0%) | 0 (0.0%) |
| Coal or Coke | 0 (0.0%) | 0 (0.0%) |
| All other Fuels | 25 (32.5%) | 0 (0.0%) |
| No Fuel Used | 0 (0.0%) | 0 (0.0%) |
| Total | 77 (100.0%) | 7 (100.0%) |
Household Vehicle Usage in Swan Lake
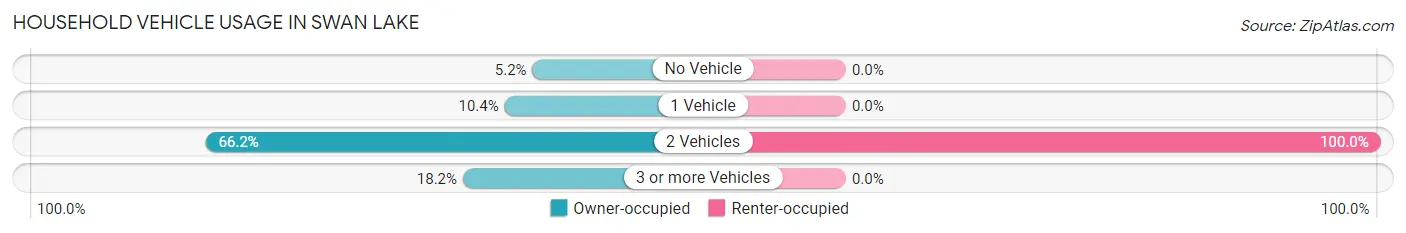
| Vehicles per Household | Owner-occupied | Renter-occupied |
| No Vehicle | 4 (5.2%) | 0 (0.0%) |
| 1 Vehicle | 8 (10.4%) | 0 (0.0%) |
| 2 Vehicles | 51 (66.2%) | 7 (100.0%) |
| 3 or more Vehicles | 14 (18.2%) | 0 (0.0%) |
| Total | 77 (100.0%) | 7 (100.0%) |
Real Estate & Mortgages in Swan Lake
Real Estate and Mortgage Overview in Swan Lake
| Characteristic | Without Mortgage | With Mortgage |
| Housing Units | 43 | 34 |
| Median Property Value | $548,100 | $407,700 |
| Median Household Income | $58,125 | $8 |
| Monthly Housing Costs | $413 | $1 |
| Real Estate Taxes | $2,357 | $0 |
Property Value by Mortgage Status in Swan Lake
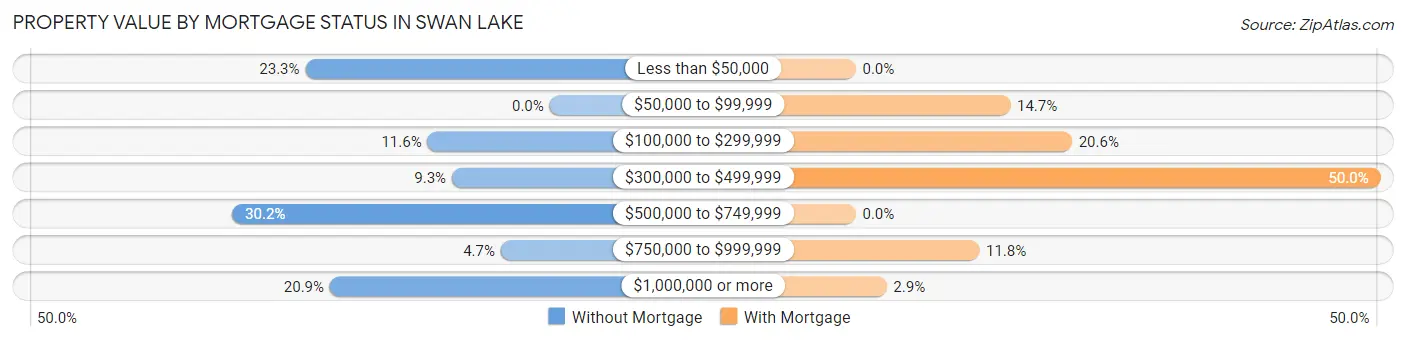
| Property Value | Without Mortgage | With Mortgage |
| Less than $50,000 | 10 (23.3%) | 0 (0.0%) |
| $50,000 to $99,999 | 0 (0.0%) | 5 (14.7%) |
| $100,000 to $299,999 | 5 (11.6%) | 7 (20.6%) |
| $300,000 to $499,999 | 4 (9.3%) | 17 (50.0%) |
| $500,000 to $749,999 | 13 (30.2%) | 0 (0.0%) |
| $750,000 to $999,999 | 2 (4.6%) | 4 (11.8%) |
| $1,000,000 or more | 9 (20.9%) | 1 (2.9%) |
| Total | 43 (100.0%) | 34 (100.0%) |
Household Income by Mortgage Status in Swan Lake
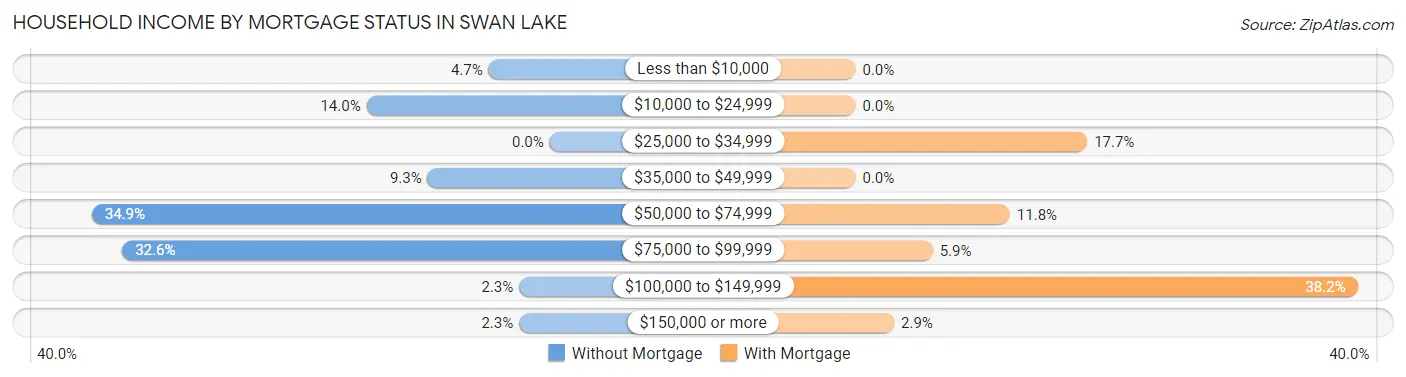
| Household Income | Without Mortgage | With Mortgage |
| Less than $10,000 | 2 (4.6%) | 0 (0.0%) |
| $10,000 to $24,999 | 6 (14.0%) | 0 (0.0%) |
| $25,000 to $34,999 | 0 (0.0%) | 6 (17.6%) |
| $35,000 to $49,999 | 4 (9.3%) | 0 (0.0%) |
| $50,000 to $74,999 | 15 (34.9%) | 4 (11.8%) |
| $75,000 to $99,999 | 14 (32.6%) | 2 (5.9%) |
| $100,000 to $149,999 | 1 (2.3%) | 13 (38.2%) |
| $150,000 or more | 1 (2.3%) | 1 (2.9%) |
| Total | 43 (100.0%) | 34 (100.0%) |
Property Value to Household Income Ratio in Swan Lake
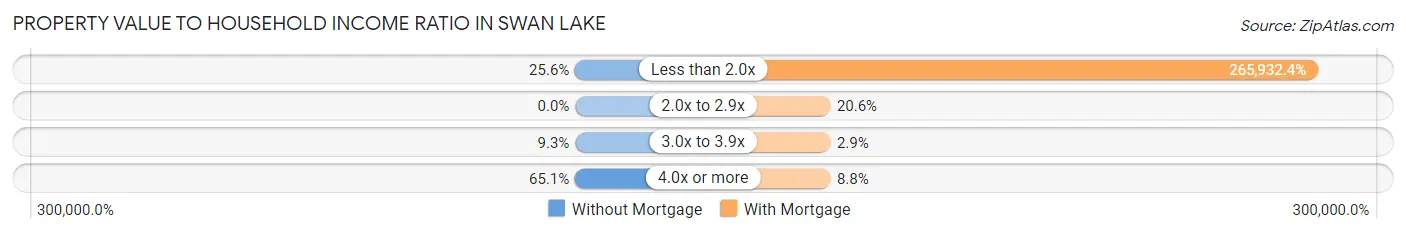
| Value-to-Income Ratio | Without Mortgage | With Mortgage |
| Less than 2.0x | 11 (25.6%) | 90,417 (265,932.3%) |
| 2.0x to 2.9x | 0 (0.0%) | 7 (20.6%) |
| 3.0x to 3.9x | 4 (9.3%) | 1 (2.9%) |
| 4.0x or more | 28 (65.1%) | 3 (8.8%) |
| Total | 43 (100.0%) | 34 (100.0%) |
Real Estate Taxes by Mortgage Status in Swan Lake
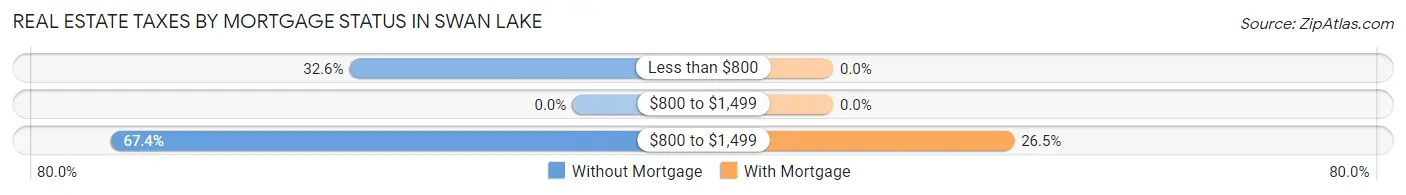
| Property Taxes | Without Mortgage | With Mortgage |
| Less than $800 | 14 (32.6%) | 0 (0.0%) |
| $800 to $1,499 | 0 (0.0%) | 0 (0.0%) |
| $800 to $1,499 | 29 (67.4%) | 9 (26.5%) |
| Total | 43 (100.0%) | 34 (100.0%) |
Health & Disability in Swan Lake
Health Insurance Coverage by Age in Swan Lake
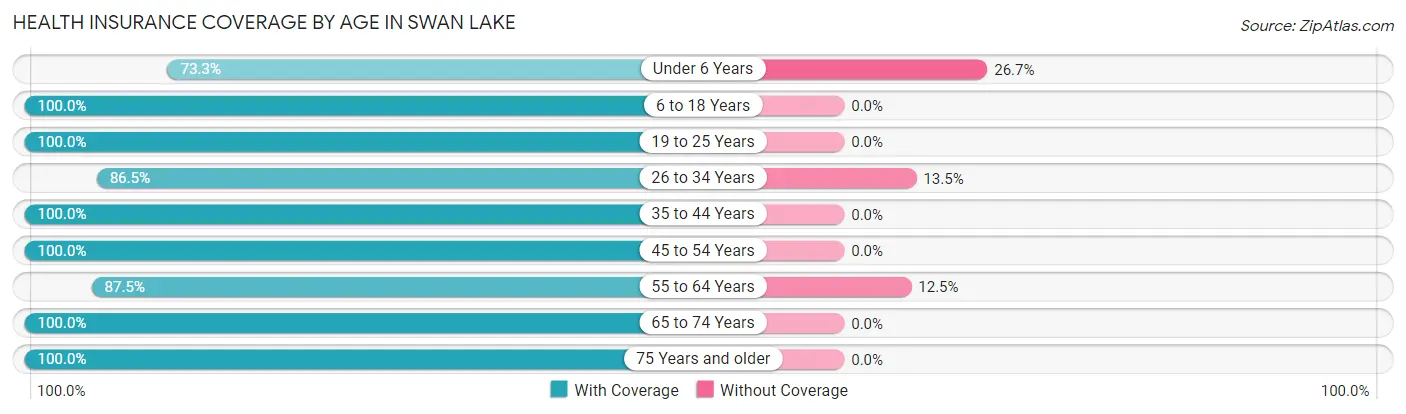
| Age Bracket | With Coverage | Without Coverage |
| Under 6 Years | 11 (73.3%) | 4 (26.7%) |
| 6 to 18 Years | 12 (100.0%) | 0 (0.0%) |
| 19 to 25 Years | 11 (100.0%) | 0 (0.0%) |
| 26 to 34 Years | 45 (86.5%) | 7 (13.5%) |
| 35 to 44 Years | 29 (100.0%) | 0 (0.0%) |
| 45 to 54 Years | 15 (100.0%) | 0 (0.0%) |
| 55 to 64 Years | 14 (87.5%) | 2 (12.5%) |
| 65 to 74 Years | 15 (100.0%) | 0 (0.0%) |
| 75 Years and older | 51 (100.0%) | 0 (0.0%) |
| Total | 203 (94.0%) | 13 (6.0%) |
Health Insurance Coverage by Citizenship Status in Swan Lake
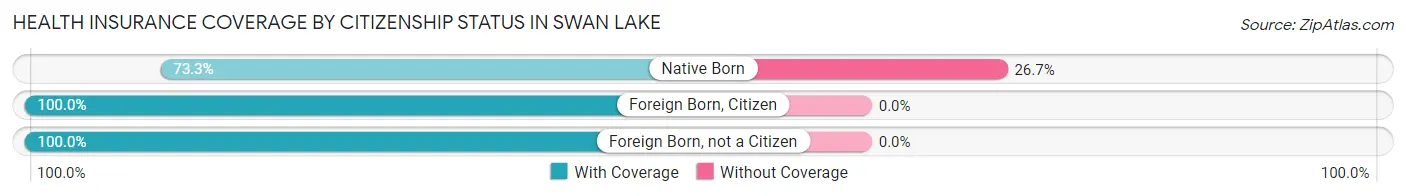
| Citizenship Status | With Coverage | Without Coverage |
| Native Born | 11 (73.3%) | 4 (26.7%) |
| Foreign Born, Citizen | 12 (100.0%) | 0 (0.0%) |
| Foreign Born, not a Citizen | 11 (100.0%) | 0 (0.0%) |
Health Insurance Coverage by Household Income in Swan Lake
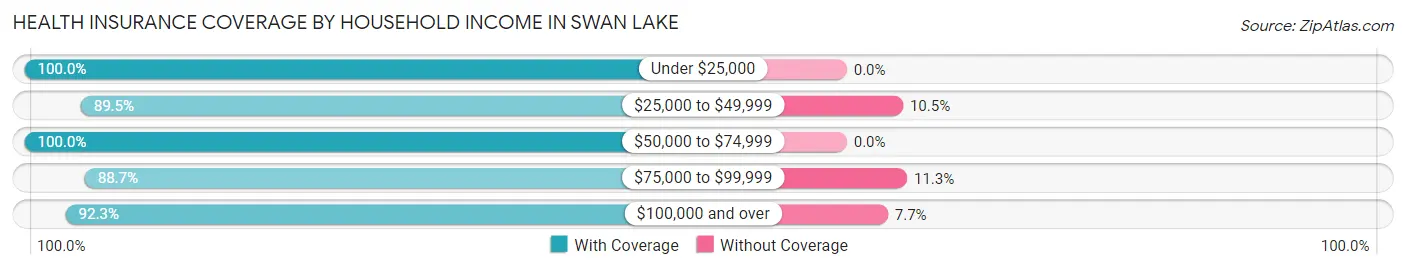
| Household Income | With Coverage | Without Coverage |
| Under $25,000 | 34 (100.0%) | 0 (0.0%) |
| $25,000 to $49,999 | 17 (89.5%) | 2 (10.5%) |
| $50,000 to $74,999 | 33 (100.0%) | 0 (0.0%) |
| $75,000 to $99,999 | 55 (88.7%) | 7 (11.3%) |
| $100,000 and over | 48 (92.3%) | 4 (7.7%) |
Public vs Private Health Insurance Coverage by Age in Swan Lake
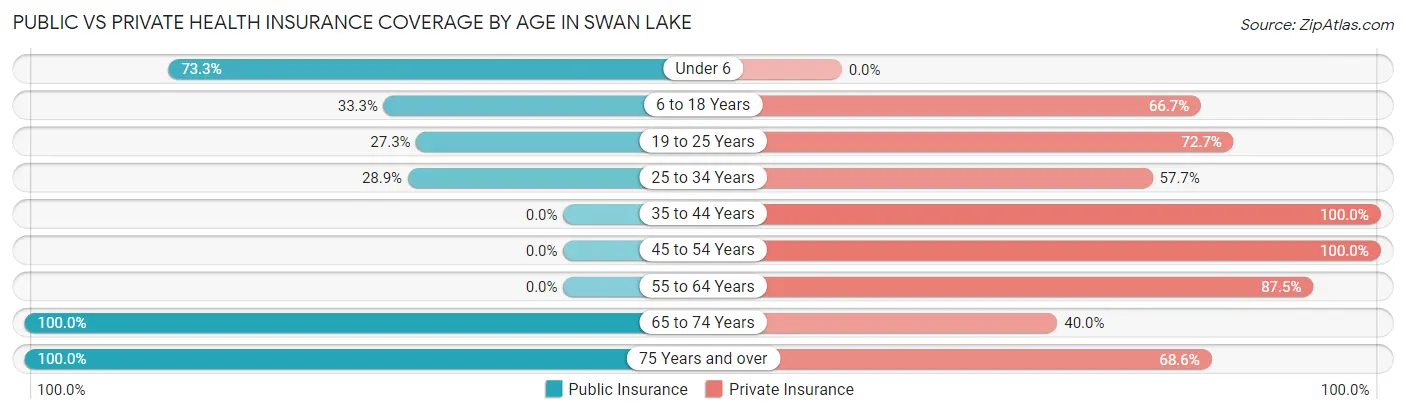
| Age Bracket | Public Insurance | Private Insurance |
| Under 6 | 11 (73.3%) | 0 (0.0%) |
| 6 to 18 Years | 4 (33.3%) | 8 (66.7%) |
| 19 to 25 Years | 3 (27.3%) | 8 (72.7%) |
| 25 to 34 Years | 15 (28.8%) | 30 (57.7%) |
| 35 to 44 Years | 0 (0.0%) | 29 (100.0%) |
| 45 to 54 Years | 0 (0.0%) | 15 (100.0%) |
| 55 to 64 Years | 0 (0.0%) | 14 (87.5%) |
| 65 to 74 Years | 15 (100.0%) | 6 (40.0%) |
| 75 Years and over | 51 (100.0%) | 35 (68.6%) |
| Total | 99 (45.8%) | 145 (67.1%) |
Disability Status by Sex by Age in Swan Lake
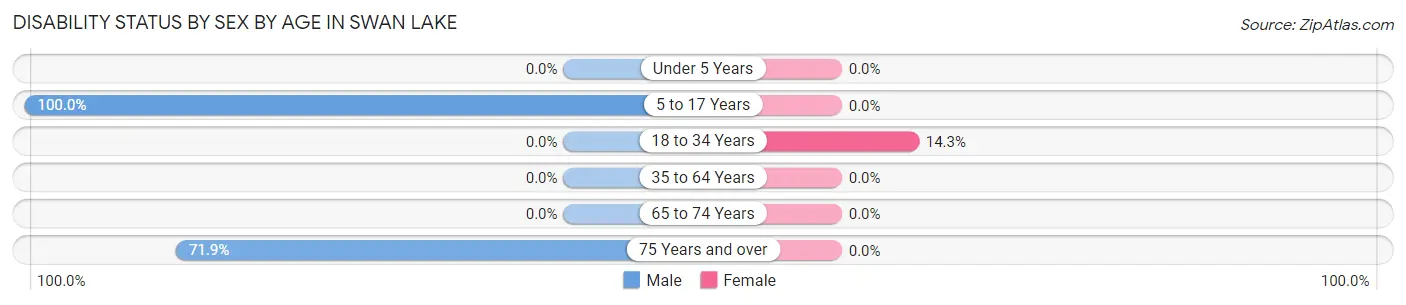
| Age Bracket | Male | Female |
| Under 5 Years | 0 (0.0%) | 0 (0.0%) |
| 5 to 17 Years | 4 (100.0%) | 0 (0.0%) |
| 18 to 34 Years | 0 (0.0%) | 3 (14.3%) |
| 35 to 64 Years | 0 (0.0%) | 0 (0.0%) |
| 65 to 74 Years | 0 (0.0%) | 0 (0.0%) |
| 75 Years and over | 23 (71.9%) | 0 (0.0%) |
Disability Class by Sex by Age in Swan Lake
Disability Class: Hearing Difficulty
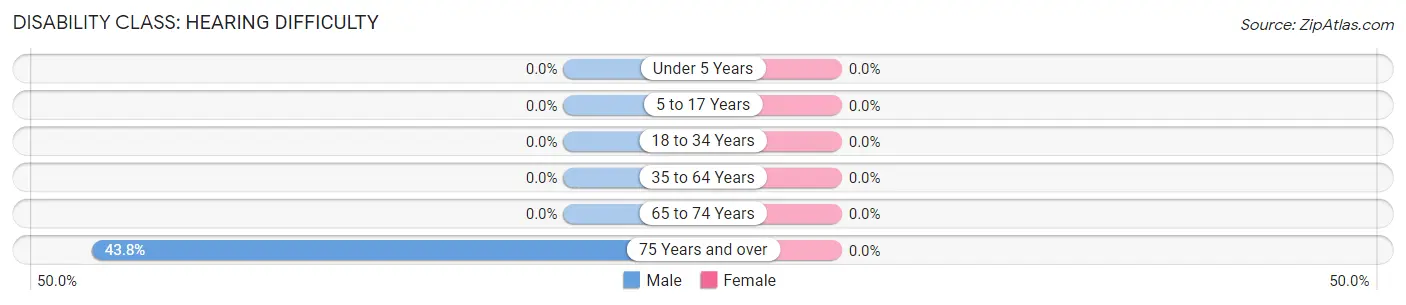
| Age Bracket | Male | Female |
| Under 5 Years | 0 (0.0%) | 0 (0.0%) |
| 5 to 17 Years | 0 (0.0%) | 0 (0.0%) |
| 18 to 34 Years | 0 (0.0%) | 0 (0.0%) |
| 35 to 64 Years | 0 (0.0%) | 0 (0.0%) |
| 65 to 74 Years | 0 (0.0%) | 0 (0.0%) |
| 75 Years and over | 14 (43.8%) | 0 (0.0%) |
Disability Class: Vision Difficulty
| Age Bracket | Male | Female |
| Under 5 Years | 0 (0.0%) | 0 (0.0%) |
| 5 to 17 Years | 0 (0.0%) | 0 (0.0%) |
| 18 to 34 Years | 0 (0.0%) | 0 (0.0%) |
| 35 to 64 Years | 0 (0.0%) | 0 (0.0%) |
| 65 to 74 Years | 0 (0.0%) | 0 (0.0%) |
| 75 Years and over | 0 (0.0%) | 0 (0.0%) |
Disability Class: Cognitive Difficulty
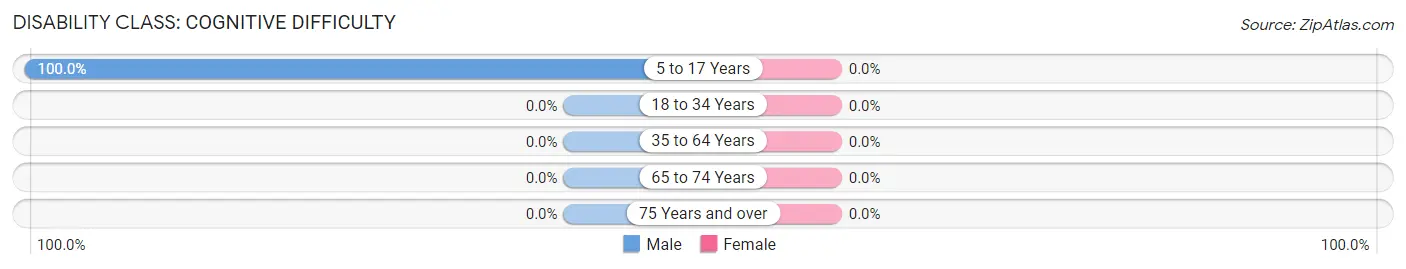
| Age Bracket | Male | Female |
| 5 to 17 Years | 4 (100.0%) | 0 (0.0%) |
| 18 to 34 Years | 0 (0.0%) | 0 (0.0%) |
| 35 to 64 Years | 0 (0.0%) | 0 (0.0%) |
| 65 to 74 Years | 0 (0.0%) | 0 (0.0%) |
| 75 Years and over | 0 (0.0%) | 0 (0.0%) |
Disability Class: Ambulatory Difficulty
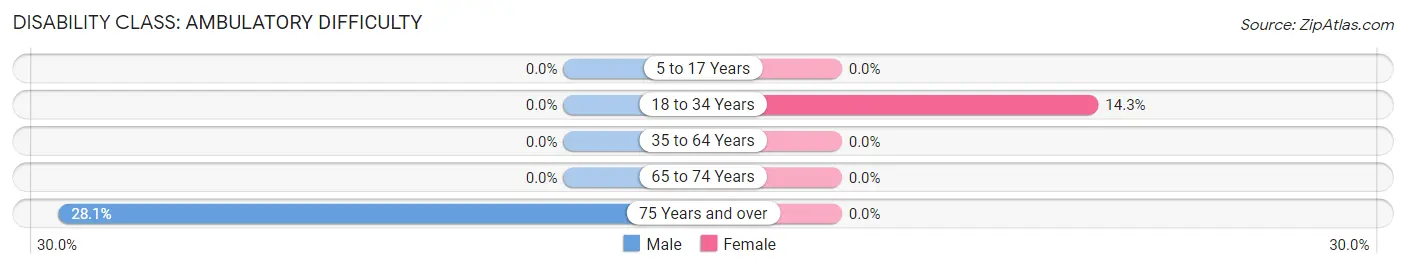
| Age Bracket | Male | Female |
| 5 to 17 Years | 0 (0.0%) | 0 (0.0%) |
| 18 to 34 Years | 0 (0.0%) | 3 (14.3%) |
| 35 to 64 Years | 0 (0.0%) | 0 (0.0%) |
| 65 to 74 Years | 0 (0.0%) | 0 (0.0%) |
| 75 Years and over | 9 (28.1%) | 0 (0.0%) |
Disability Class: Self-Care Difficulty
| Age Bracket | Male | Female |
| 5 to 17 Years | 0 (0.0%) | 0 (0.0%) |
| 18 to 34 Years | 0 (0.0%) | 0 (0.0%) |
| 35 to 64 Years | 0 (0.0%) | 0 (0.0%) |
| 65 to 74 Years | 0 (0.0%) | 0 (0.0%) |
| 75 Years and over | 0 (0.0%) | 0 (0.0%) |
Technology Access in Swan Lake
Computing Device Access in Swan Lake
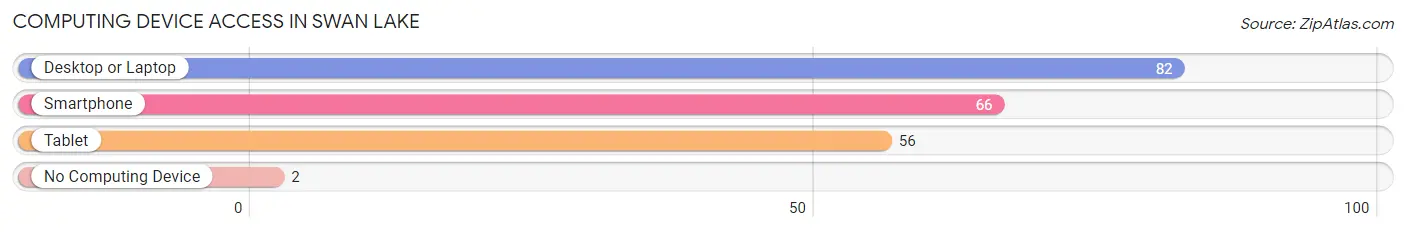
| Device Type | # Households | % Households |
| Desktop or Laptop | 82 | 97.6% |
| Smartphone | 66 | 78.6% |
| Tablet | 56 | 66.7% |
| No Computing Device | 2 | 2.4% |
| Total | 84 | 100.0% |
Internet Access in Swan Lake
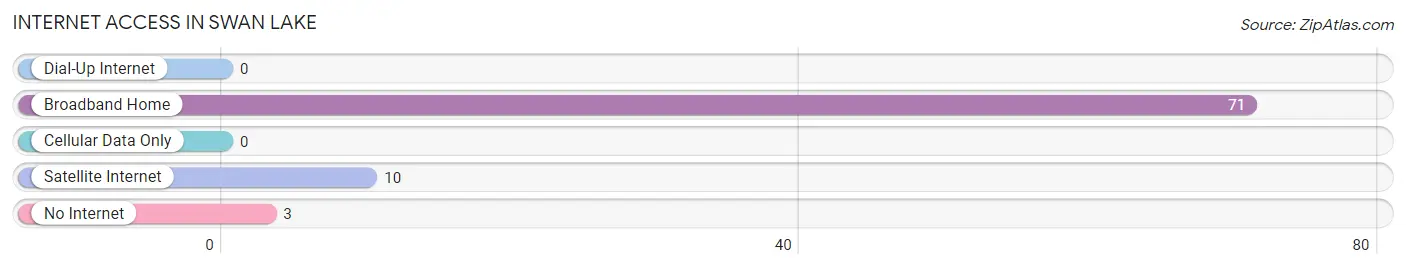
| Internet Type | # Households | % Households |
| Dial-Up Internet | 0 | 0.0% |
| Broadband Home | 71 | 84.5% |
| Cellular Data Only | 0 | 0.0% |
| Satellite Internet | 10 | 11.9% |
| No Internet | 3 | 3.6% |
| Total | 84 | 100.0% |
Swan Lake Summary
Swan Lake is a small unincorporated community located in Missoula County, Montana. It is situated on the western shore of Swan Lake, a large natural lake in the Flathead Valley. The community is located approximately 20 miles north of Missoula and is part of the Missoula Metropolitan Statistical Area.
History
Swan Lake was first settled in the late 1800s by homesteaders who were attracted to the area by its abundant natural resources. The first settlers were mostly of European descent, but the area also attracted Native Americans, including the Salish and Kootenai tribes. The area was originally known as "Swan Lake Settlement" and was officially incorporated as a town in 1909.
The town was named after the nearby lake, which was named by early settlers for the abundance of swans that lived in the area. The lake was also a popular spot for fishing and hunting, and the town quickly became a popular destination for tourists.
Geography
Swan Lake is located in the Flathead Valley, a large valley in western Montana. The valley is surrounded by the Mission Mountains to the east and the Swan Range to the west. The lake itself is approximately 8 miles long and 2 miles wide, and is fed by the Swan River.
The town of Swan Lake is situated on the western shore of the lake, and is surrounded by rolling hills and forests. The area is known for its scenic beauty and is a popular destination for outdoor recreation, including fishing, hunting, camping, and hiking.
Economy
The economy of Swan Lake is largely based on tourism and recreation. The area is a popular destination for fishing, hunting, camping, and hiking, and the town is home to several resorts and lodges. The town also has a small retail sector, with several stores and restaurants.
The town is also home to a small manufacturing sector, with several small businesses producing a variety of products, including furniture, clothing, and wood products.
Demographics
As of the 2010 census, the population of Swan Lake was 1,093. The racial makeup of the town was 95.3% White, 0.7% Native American, 0.3% Asian, 0.2% African American, and 3.5% from other races. The median household income was $37,917, and the median family income was $45,625.
The town is served by the Swan Lake School District, which includes an elementary school, a middle school, and a high school. The town is also home to a branch of the Flathead Valley Community College.
Common Questions
What is Per Capita Income in Swan Lake?
Per Capita income in Swan Lake is $35,013.
What is the Median Family Income in Swan Lake?
Median Family Income in Swan Lake is $60,000.
What is the Median Household income in Swan Lake?
Median Household Income in Swan Lake is $76,071.
What is Inequality or Gini Index in Swan Lake?
Inequality or Gini Index in Swan Lake is 0.38.
What is the Total Population of Swan Lake?
Total Population of Swan Lake is 216.
What is the Total Male Population of Swan Lake?
Total Male Population of Swan Lake is 127.
What is the Total Female Population of Swan Lake?
Total Female Population of Swan Lake is 89.
What is the Ratio of Males per 100 Females in Swan Lake?
There are 142.70 Males per 100 Females in Swan Lake.
What is the Ratio of Females per 100 Males in Swan Lake?
There are 70.08 Females per 100 Males in Swan Lake.
What is the Median Population Age in Swan Lake?
Median Population Age in Swan Lake is 43.4 Years.
What is the Average Family Size in Swan Lake
Average Family Size in Swan Lake is 2.9 People.
What is the Average Household Size in Swan Lake
Average Household Size in Swan Lake is 2.4 People.
How Large is the Labor Force in Swan Lake?
There are 96 People in the Labor Forcein in Swan Lake.
What is the Percentage of People in the Labor Force in Swan Lake?
50.8% of People are in the Labor Force in Swan Lake.