Fort Peck, MT Map & Demographics
Fort Peck Map
Fort Peck Overview
$49,480
PER CAPITA INCOME
$100,938
AVG FAMILY INCOME
$84,375
AVG HOUSEHOLD INCOME
40.3%
WAGE / INCOME GAP [ % ]
59.7¢/ $1
WAGE / INCOME GAP [ $ ]
0.27
INEQUALITY / GINI INDEX
200
TOTAL POPULATION
116
MALE POPULATION
84
FEMALE POPULATION
138.10
MALES / 100 FEMALES
72.41
FEMALES / 100 MALES
51.2
MEDIAN AGE
2.7
AVG FAMILY SIZE
2.2
AVG HOUSEHOLD SIZE
111
LABOR FORCE [ PEOPLE ]
64.9%
PERCENT IN LABOR FORCE
Fort Peck Zip Codes
Fort Peck Area Codes
Income in Fort Peck
Income Overview in Fort Peck
Per Capita Income in Fort Peck is $49,480, while median incomes of families and households are $100,938 and $84,375 respectively.
| Characteristic | Number | Measure |
| Per Capita Income | 200 | $49,480 |
| Median Family Income | 65 | $100,938 |
| Mean Family Income | 65 | $115,360 |
| Median Household Income | 91 | $84,375 |
| Mean Household Income | 91 | $107,296 |
| Income Deficit | 65 | $0 |
| Wage / Income Gap (%) | 200 | 40.34% |
| Wage / Income Gap ($) | 200 | 59.66¢ per $1 |
| Gini / Inequality Index | 200 | 0.27 |
Earnings by Sex in Fort Peck
Average Earnings in Fort Peck are $49,000, $73,333 for men and $43,750 for women, a difference of 40.3%.
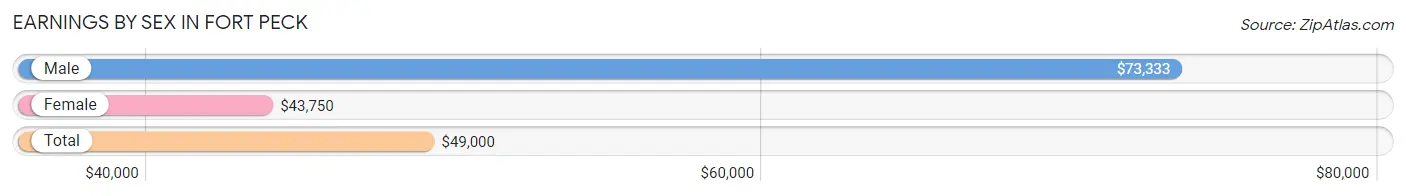
| Sex | Number | Average Earnings |
| Male | 70 (59.3%) | $73,333 |
| Female | 48 (40.7%) | $43,750 |
| Total | 118 (100.0%) | $49,000 |
Earnings by Sex by Income Bracket in Fort Peck
The most common earnings brackets in Fort Peck are $100,000+ for men (25 | 35.7%) and $55,000 to $64,999 for women (10 | 20.8%).
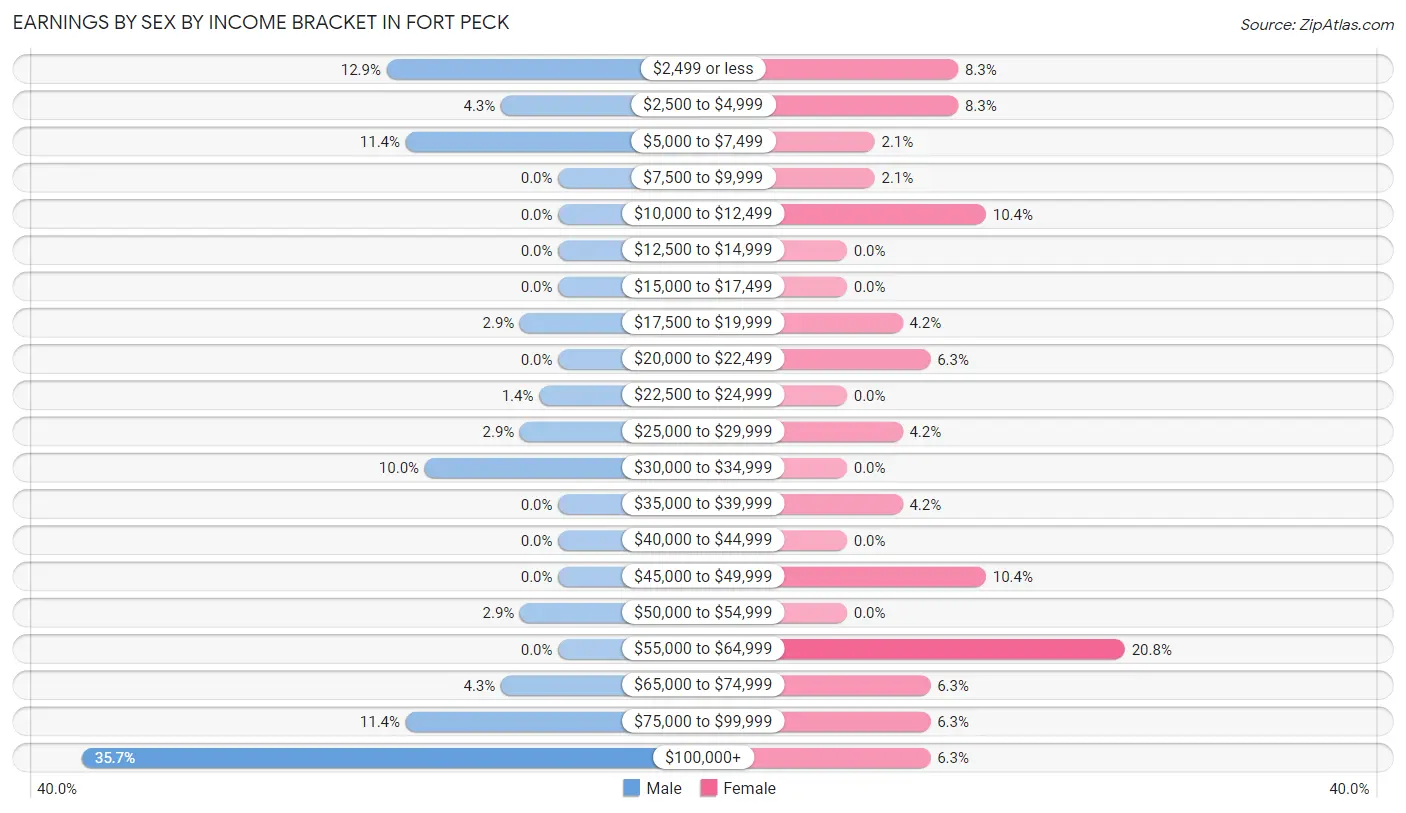
| Income | Male | Female |
| $2,499 or less | 9 (12.9%) | 4 (8.3%) |
| $2,500 to $4,999 | 3 (4.3%) | 4 (8.3%) |
| $5,000 to $7,499 | 8 (11.4%) | 1 (2.1%) |
| $7,500 to $9,999 | 0 (0.0%) | 1 (2.1%) |
| $10,000 to $12,499 | 0 (0.0%) | 5 (10.4%) |
| $12,500 to $14,999 | 0 (0.0%) | 0 (0.0%) |
| $15,000 to $17,499 | 0 (0.0%) | 0 (0.0%) |
| $17,500 to $19,999 | 2 (2.9%) | 2 (4.2%) |
| $20,000 to $22,499 | 0 (0.0%) | 3 (6.2%) |
| $22,500 to $24,999 | 1 (1.4%) | 0 (0.0%) |
| $25,000 to $29,999 | 2 (2.9%) | 2 (4.2%) |
| $30,000 to $34,999 | 7 (10.0%) | 0 (0.0%) |
| $35,000 to $39,999 | 0 (0.0%) | 2 (4.2%) |
| $40,000 to $44,999 | 0 (0.0%) | 0 (0.0%) |
| $45,000 to $49,999 | 0 (0.0%) | 5 (10.4%) |
| $50,000 to $54,999 | 2 (2.9%) | 0 (0.0%) |
| $55,000 to $64,999 | 0 (0.0%) | 10 (20.8%) |
| $65,000 to $74,999 | 3 (4.3%) | 3 (6.2%) |
| $75,000 to $99,999 | 8 (11.4%) | 3 (6.2%) |
| $100,000+ | 25 (35.7%) | 3 (6.2%) |
| Total | 70 (100.0%) | 48 (100.0%) |
Earnings by Sex by Educational Attainment in Fort Peck
Average earnings in Fort Peck are $91,250 for men and $49,250 for women, a difference of 46.0%. Men with an educational attainment of college or associate's degree enjoy the highest average annual earnings of $105,250, while those with college or associate's degree education earn the least with $105,250. Women with an educational attainment of bachelor's degree earn the most with the average annual earnings of $64,167, while those with graduate degree education have the smallest earnings of $49,500.
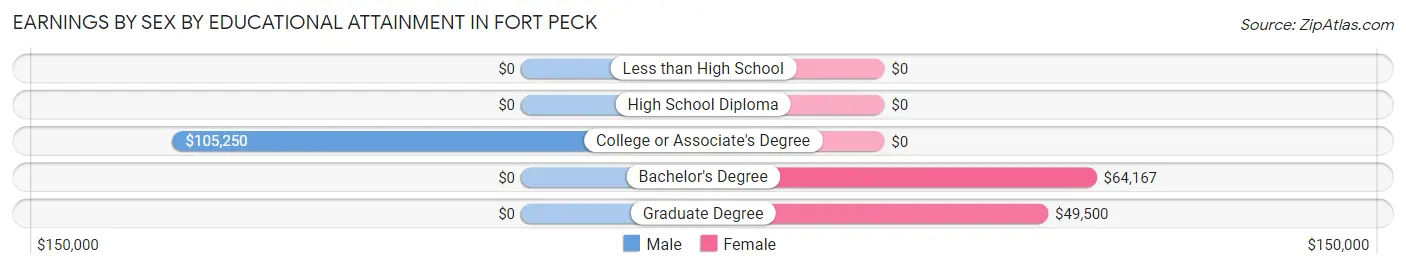
| Educational Attainment | Male Income | Female Income |
| Less than High School | - | - |
| High School Diploma | - | - |
| College or Associate's Degree | $105,250 | $0 |
| Bachelor's Degree | - | - |
| Graduate Degree | - | - |
| Total | $91,250 | $49,250 |
Family Income in Fort Peck
Family Income Brackets in Fort Peck
According to the Fort Peck family income data, there are 19 families falling into the $100,000 to $149,999 income range, which is the most common income bracket and makes up 29.2% of all families.
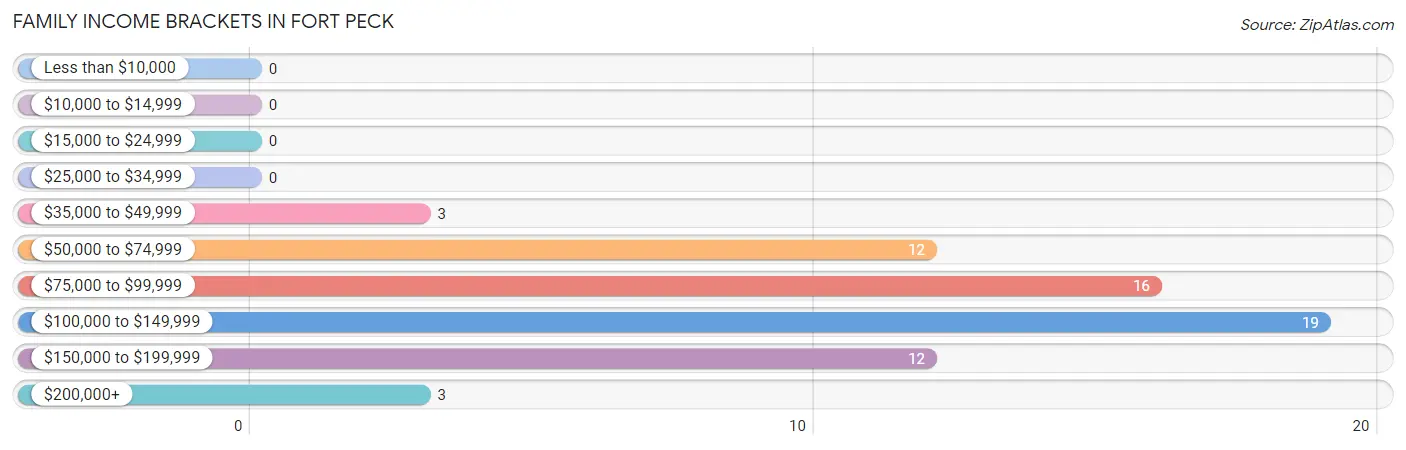
| Income Bracket | # Families | % Families |
| Less than $10,000 | 0 | 0.0% |
| $10,000 to $14,999 | 0 | 0.0% |
| $15,000 to $24,999 | 0 | 0.0% |
| $25,000 to $34,999 | 0 | 0.0% |
| $35,000 to $49,999 | 3 | 4.6% |
| $50,000 to $74,999 | 12 | 18.5% |
| $75,000 to $99,999 | 16 | 24.6% |
| $100,000 to $149,999 | 19 | 29.2% |
| $150,000 to $199,999 | 12 | 18.5% |
| $200,000+ | 3 | 4.6% |
Family Income by Famaliy Size in Fort Peck
3-person families (12 | 18.5%) account for the highest median family income in Fort Peck with $141,875 per family, while 3-person families (12 | 18.5%) have the highest median income of $47,292 per family member.
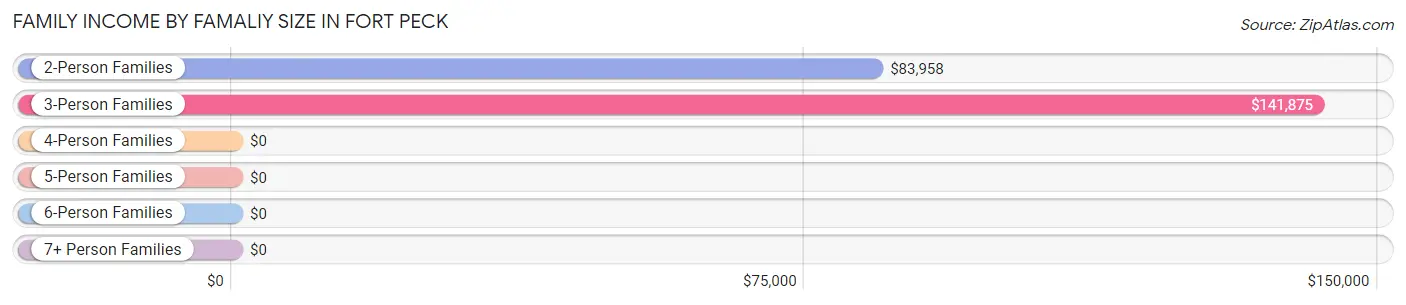
| Income Bracket | # Families | Median Income |
| 2-Person Families | 43 (66.1%) | $83,958 |
| 3-Person Families | 12 (18.5%) | $141,875 |
| 4-Person Families | 7 (10.8%) | $0 |
| 5-Person Families | 3 (4.6%) | $0 |
| 6-Person Families | 0 (0.0%) | $0 |
| 7+ Person Families | 0 (0.0%) | $0 |
| Total | 65 (100.0%) | $100,938 |
Family Income by Number of Earners in Fort Peck
The median family income in Fort Peck is $100,938, with families comprising 2 earners (21) having the highest median family income of $139,063, while families with no earners (14) have the lowest median family income of $73,750, accounting for 32.3% and 21.5% of families, respectively.
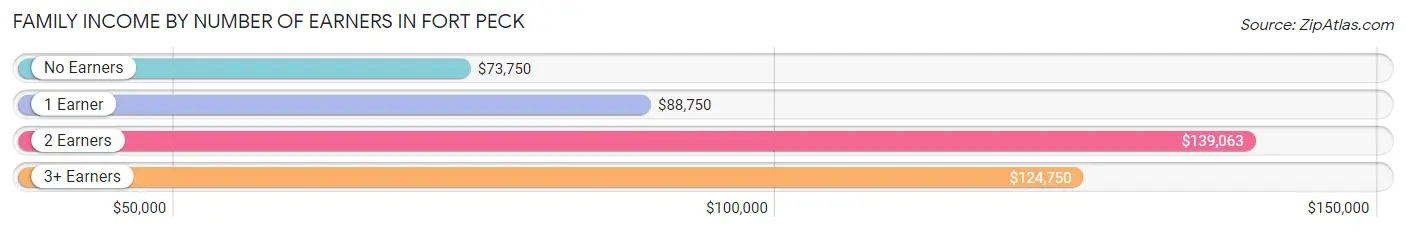
| Number of Earners | # Families | Median Income |
| No Earners | 14 (21.5%) | $73,750 |
| 1 Earner | 13 (20.0%) | $88,750 |
| 2 Earners | 21 (32.3%) | $139,063 |
| 3+ Earners | 17 (26.2%) | $124,750 |
| Total | 65 (100.0%) | $100,938 |
Household Income in Fort Peck
Household Income Brackets in Fort Peck
With 25 households falling in the category, the $100,000 to $149,999 income range is the most frequent in Fort Peck, accounting for 27.5% of all households.
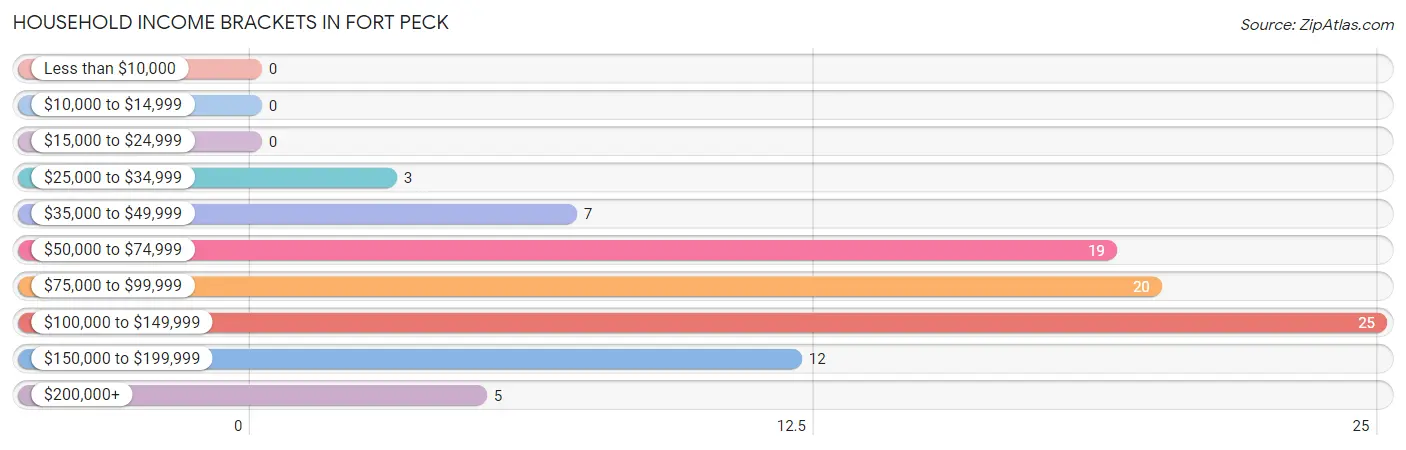
| Income Bracket | # Households | % Households |
| Less than $10,000 | 0 | 0.0% |
| $10,000 to $14,999 | 0 | 0.0% |
| $15,000 to $24,999 | 0 | 0.0% |
| $25,000 to $34,999 | 3 | 3.3% |
| $35,000 to $49,999 | 7 | 7.7% |
| $50,000 to $74,999 | 19 | 20.9% |
| $75,000 to $99,999 | 20 | 22.0% |
| $100,000 to $149,999 | 25 | 27.5% |
| $150,000 to $199,999 | 12 | 13.2% |
| $200,000+ | 5 | 5.5% |
Household Income by Householder Age in Fort Peck
The median household income in Fort Peck is $84,375, with the highest median household income of $153,125 found in the 25 to 44 years age bracket for the primary householder. A total of 15 households (16.5%) fall into this category.
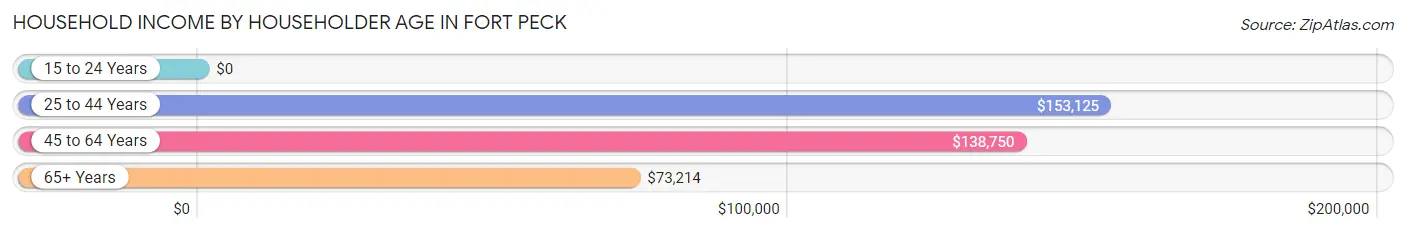
| Income Bracket | # Households | Median Income |
| 15 to 24 Years | 0 (0.0%) | $0 |
| 25 to 44 Years | 15 (16.5%) | $153,125 |
| 45 to 64 Years | 34 (37.4%) | $138,750 |
| 65+ Years | 42 (46.2%) | $73,214 |
| Total | 91 (100.0%) | $84,375 |
Poverty in Fort Peck
Income Below Poverty by Sex and Age in Fort Peck
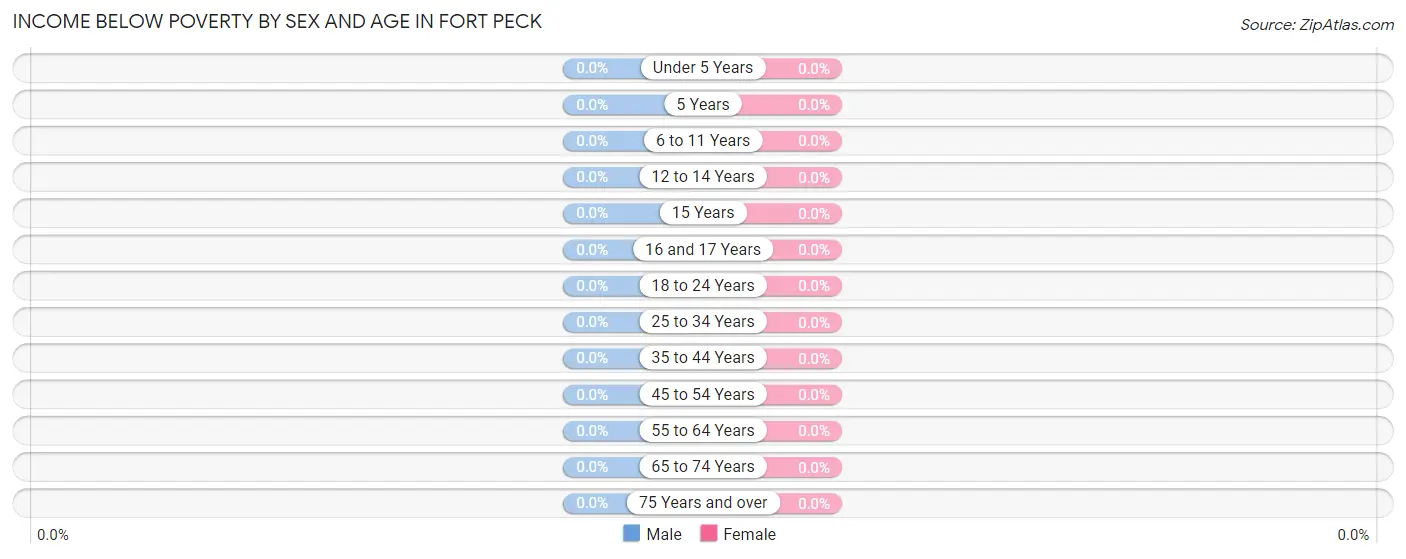
| Age Bracket | Male | Female |
| Under 5 Years | 0 (0.0%) | 0 (0.0%) |
| 5 Years | 0 (0.0%) | 0 (0.0%) |
| 6 to 11 Years | 0 (0.0%) | 0 (0.0%) |
| 12 to 14 Years | 0 (0.0%) | 0 (0.0%) |
| 15 Years | 0 (0.0%) | 0 (0.0%) |
| 16 and 17 Years | 0 (0.0%) | 0 (0.0%) |
| 18 to 24 Years | 0 (0.0%) | 0 (0.0%) |
| 25 to 34 Years | 0 (0.0%) | 0 (0.0%) |
| 35 to 44 Years | 0 (0.0%) | 0 (0.0%) |
| 45 to 54 Years | 0 (0.0%) | 0 (0.0%) |
| 55 to 64 Years | 0 (0.0%) | 0 (0.0%) |
| 65 to 74 Years | 0 (0.0%) | 0 (0.0%) |
| 75 Years and over | 0 (0.0%) | 0 (0.0%) |
| Total | 0 (0.0%) | 0 (0.0%) |
Income Above Poverty by Sex and Age in Fort Peck
According to the poverty statistics in Fort Peck, males aged under 5 years and females aged under 5 years are the age groups that are most secure financially, with 100.0% of males and 100.0% of females in these age groups living above the poverty line.
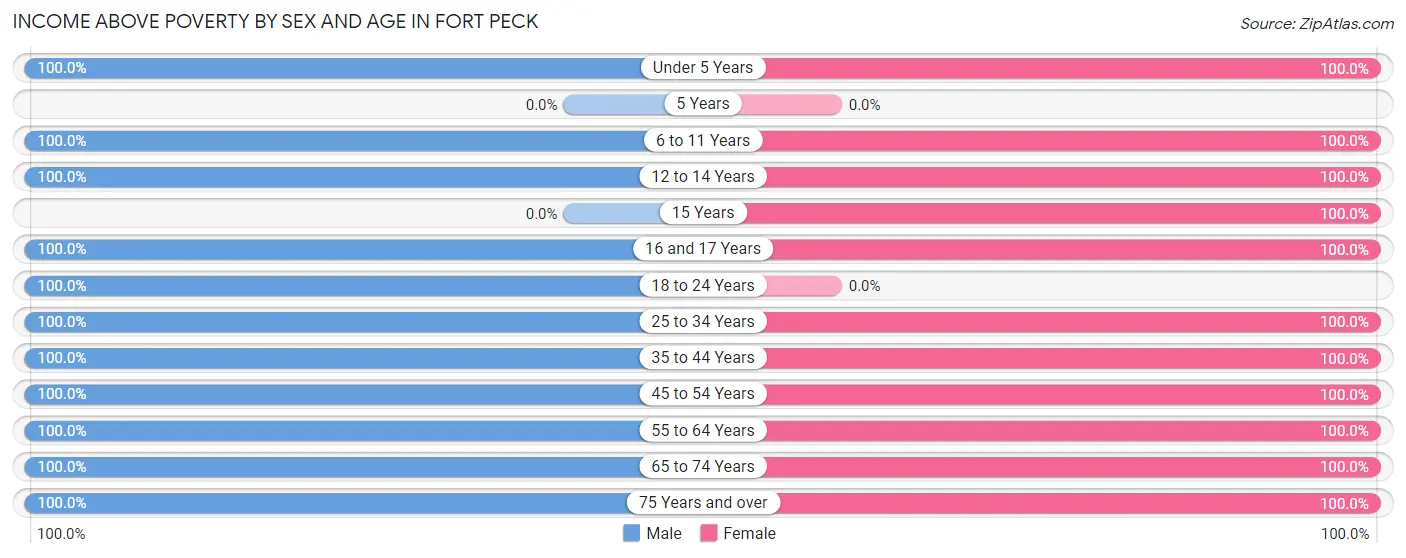
| Age Bracket | Male | Female |
| Under 5 Years | 2 (100.0%) | 2 (100.0%) |
| 5 Years | 0 (0.0%) | 0 (0.0%) |
| 6 to 11 Years | 8 (100.0%) | 3 (100.0%) |
| 12 to 14 Years | 6 (100.0%) | 7 (100.0%) |
| 15 Years | 0 (0.0%) | 1 (100.0%) |
| 16 and 17 Years | 9 (100.0%) | 7 (100.0%) |
| 18 to 24 Years | 5 (100.0%) | 0 (0.0%) |
| 25 to 34 Years | 5 (100.0%) | 6 (100.0%) |
| 35 to 44 Years | 7 (100.0%) | 9 (100.0%) |
| 45 to 54 Years | 19 (100.0%) | 16 (100.0%) |
| 55 to 64 Years | 17 (100.0%) | 8 (100.0%) |
| 65 to 74 Years | 28 (100.0%) | 15 (100.0%) |
| 75 Years and over | 10 (100.0%) | 10 (100.0%) |
| Total | 116 (100.0%) | 84 (100.0%) |
Income Below Poverty Among Married-Couple Families in Fort Peck
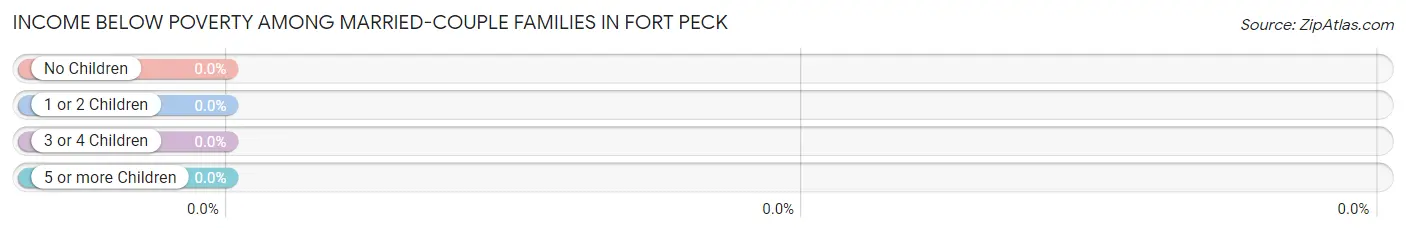
| Children | Above Poverty | Below Poverty |
| No Children | 43 (100.0%) | 0 (0.0%) |
| 1 or 2 Children | 20 (100.0%) | 0 (0.0%) |
| 3 or 4 Children | 1 (100.0%) | 0 (0.0%) |
| 5 or more Children | 0 (0.0%) | 0 (0.0%) |
| Total | 64 (100.0%) | 0 (0.0%) |
Income Below Poverty Among Single-Parent Households in Fort Peck
| Children | Single Father | Single Mother |
| No Children | 0 (0.0%) | 0 (0.0%) |
| 1 or 2 Children | 0 (0.0%) | 0 (0.0%) |
| 3 or 4 Children | 0 (0.0%) | 0 (0.0%) |
| 5 or more Children | 0 (0.0%) | 0 (0.0%) |
| Total | 0 (0.0%) | 0 (0.0%) |
Income Below Poverty Among Married-Couple vs Single-Parent Households in Fort Peck
| Children | Married-Couple Families | Single-Parent Households |
| No Children | 0 (0.0%) | 0 (0.0%) |
| 1 or 2 Children | 0 (0.0%) | 0 (0.0%) |
| 3 or 4 Children | 0 (0.0%) | 0 (0.0%) |
| 5 or more Children | 0 (0.0%) | 0 (0.0%) |
| Total | 0 (0.0%) | 0 (0.0%) |
Race in Fort Peck
The most populous races in Fort Peck are White / Caucasian (167 | 83.5%), Two or more Races (18 | 9.0%), and Native / Alaskan (10 | 5.0%).
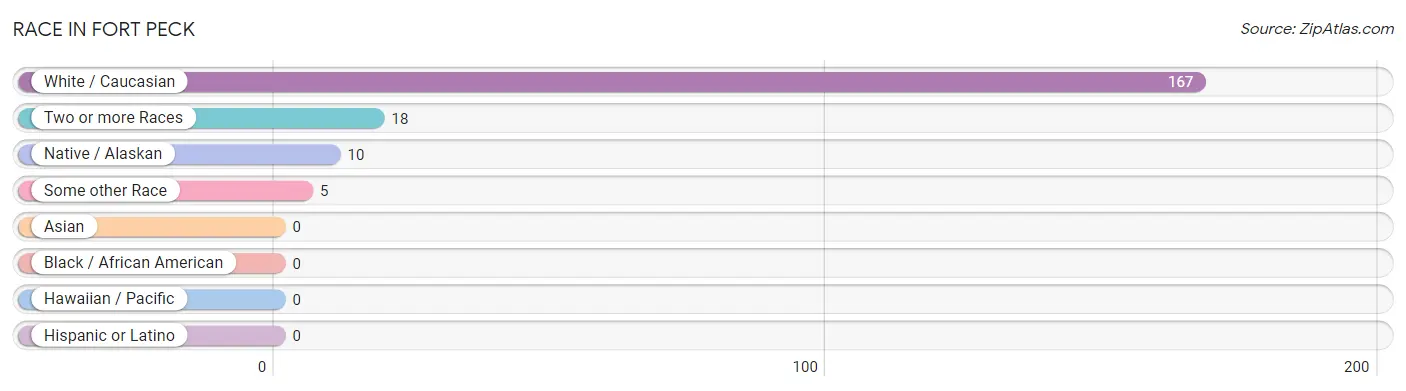
| Race | # Population | % Population |
| Asian | 0 | 0.0% |
| Black / African American | 0 | 0.0% |
| Hawaiian / Pacific | 0 | 0.0% |
| Hispanic or Latino | 0 | 0.0% |
| Native / Alaskan | 10 | 5.0% |
| White / Caucasian | 167 | 83.5% |
| Two or more Races | 18 | 9.0% |
| Some other Race | 5 | 2.5% |
| Total | 200 | 100.0% |
Ancestry in Fort Peck
The most populous ancestries reported in Fort Peck are German (51 | 25.5%), American (24 | 12.0%), Scottish (23 | 11.5%), Norwegian (15 | 7.5%), and Irish (14 | 7.0%), together accounting for 63.5% of all Fort Peck residents.
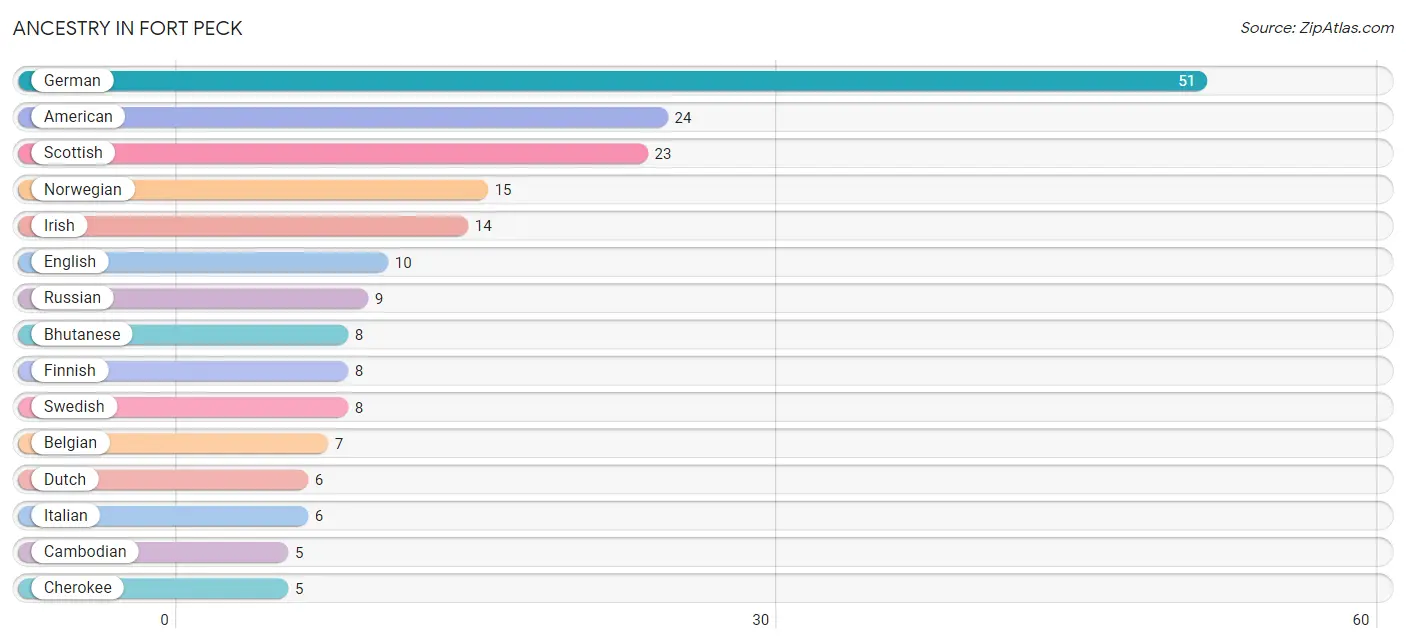
| Ancestry | # Population | % Population |
| American | 24 | 12.0% |
| Belgian | 7 | 3.5% |
| Bhutanese | 8 | 4.0% |
| British | 1 | 0.5% |
| Cambodian | 5 | 2.5% |
| Cherokee | 5 | 2.5% |
| Chippewa | 3 | 1.5% |
| Croatian | 3 | 1.5% |
| Czech | 2 | 1.0% |
| Danish | 4 | 2.0% |
| Dutch | 6 | 3.0% |
| English | 10 | 5.0% |
| European | 2 | 1.0% |
| Finnish | 8 | 4.0% |
| French | 3 | 1.5% |
| German | 51 | 25.5% |
| Greek | 4 | 2.0% |
| Icelander | 2 | 1.0% |
| Irish | 14 | 7.0% |
| Italian | 6 | 3.0% |
| Norwegian | 15 | 7.5% |
| Polish | 5 | 2.5% |
| Russian | 9 | 4.5% |
| Scandinavian | 1 | 0.5% |
| Scotch-Irish | 3 | 1.5% |
| Scottish | 23 | 11.5% |
| Swedish | 8 | 4.0% |
| Ute | 2 | 1.0% | View All 28 Rows |
Immigrants in Fort Peck

| Immigration Origin | # Population | % Population | View All 0 Rows |
Sex and Age in Fort Peck
Sex and Age in Fort Peck
The most populous age groups in Fort Peck are 70 to 74 Years (15 | 12.9%) for men and 50 to 54 Years (11 | 13.1%) for women.
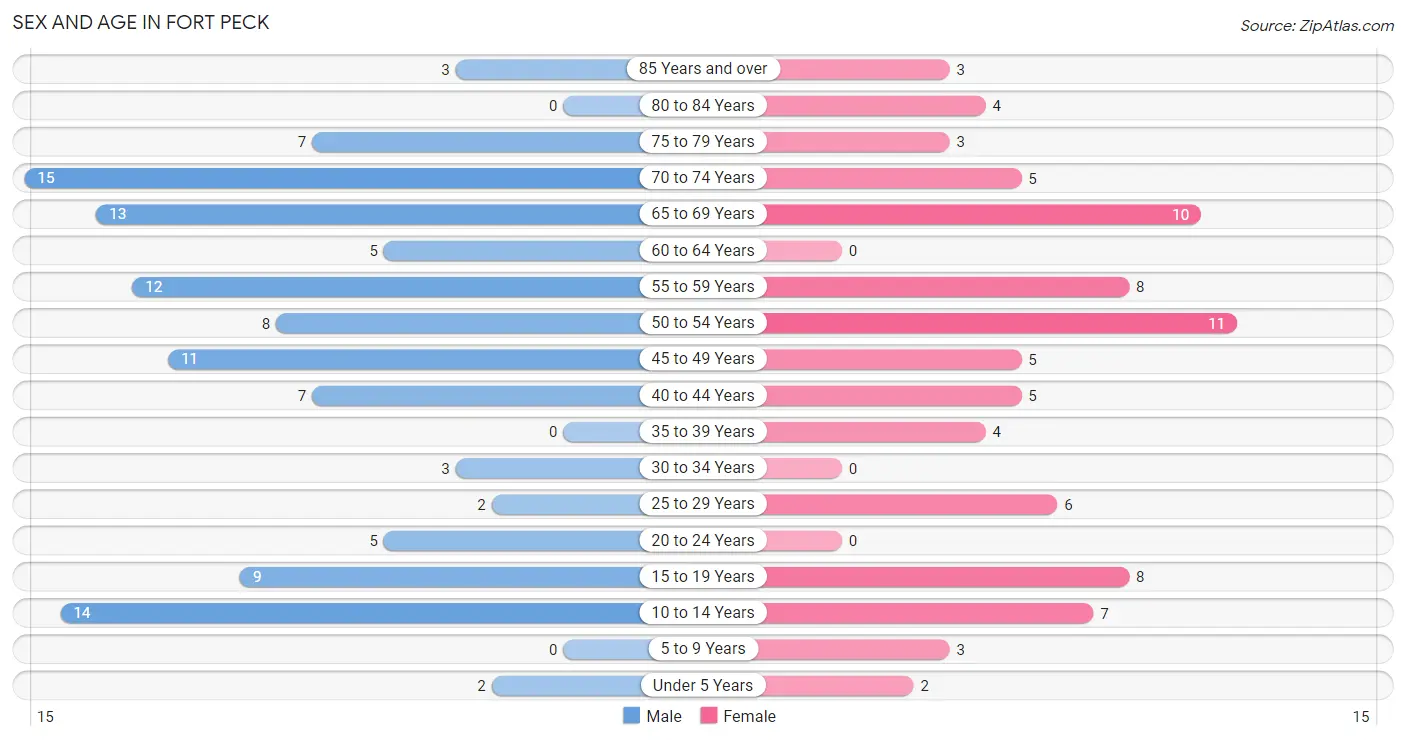
| Age Bracket | Male | Female |
| Under 5 Years | 2 (1.7%) | 2 (2.4%) |
| 5 to 9 Years | 0 (0.0%) | 3 (3.6%) |
| 10 to 14 Years | 14 (12.1%) | 7 (8.3%) |
| 15 to 19 Years | 9 (7.8%) | 8 (9.5%) |
| 20 to 24 Years | 5 (4.3%) | 0 (0.0%) |
| 25 to 29 Years | 2 (1.7%) | 6 (7.1%) |
| 30 to 34 Years | 3 (2.6%) | 0 (0.0%) |
| 35 to 39 Years | 0 (0.0%) | 4 (4.8%) |
| 40 to 44 Years | 7 (6.0%) | 5 (5.9%) |
| 45 to 49 Years | 11 (9.5%) | 5 (5.9%) |
| 50 to 54 Years | 8 (6.9%) | 11 (13.1%) |
| 55 to 59 Years | 12 (10.3%) | 8 (9.5%) |
| 60 to 64 Years | 5 (4.3%) | 0 (0.0%) |
| 65 to 69 Years | 13 (11.2%) | 10 (11.9%) |
| 70 to 74 Years | 15 (12.9%) | 5 (5.9%) |
| 75 to 79 Years | 7 (6.0%) | 3 (3.6%) |
| 80 to 84 Years | 0 (0.0%) | 4 (4.8%) |
| 85 Years and over | 3 (2.6%) | 3 (3.6%) |
| Total | 116 (100.0%) | 84 (100.0%) |
Families and Households in Fort Peck
Median Family Size in Fort Peck
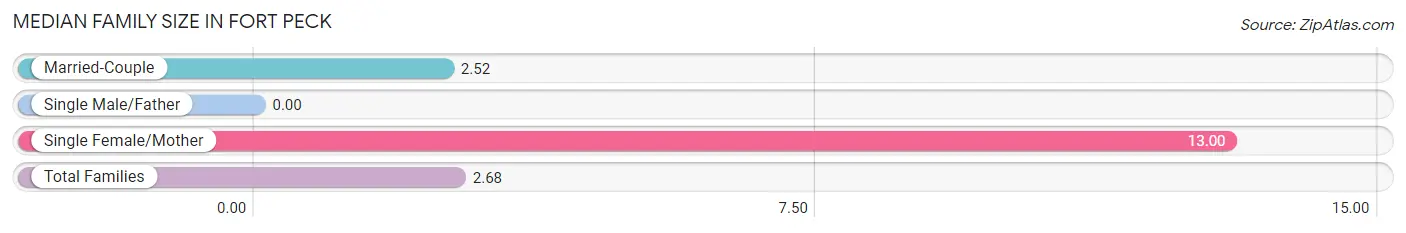
| Family Type | # Families | Family Size |
| Married-Couple | 64 (98.5%) | 2.52 |
| Single Male/Father | 0 (0.0%) | - |
| Single Female/Mother | 1 (1.5%) | 13.00 |
| Total Families | 65 (100.0%) | 2.68 |
Median Household Size in Fort Peck
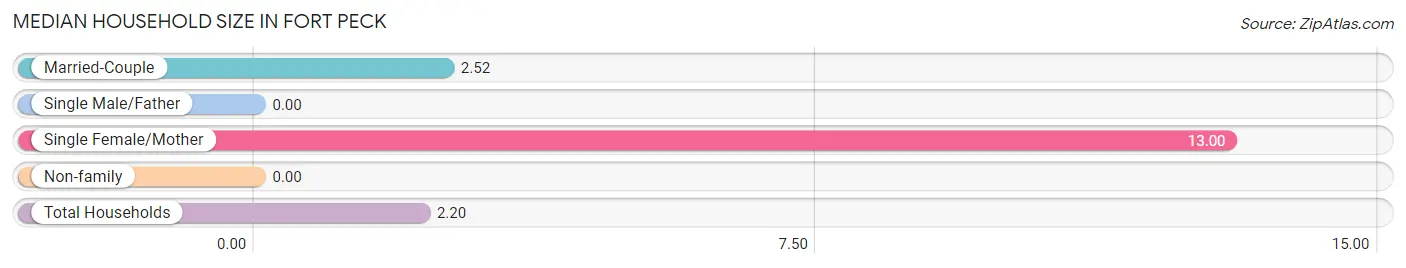
| Household Type | # Households | Household Size |
| Married-Couple | 64 (70.3%) | 2.52 |
| Single Male/Father | 0 (0.0%) | - |
| Single Female/Mother | 1 (1.1%) | 13.00 |
| Non-family | 26 (28.6%) | - |
| Total Households | 91 (100.0%) | 2.20 |
Household Size by Marriage Status in Fort Peck
Out of a total of 91 households in Fort Peck, 65 (71.4%) are family households, while 26 (28.6%) are nonfamily households. The most numerous type of family households are 2-person households, comprising 43, and the most common type of nonfamily households are 1-person households, comprising 26.
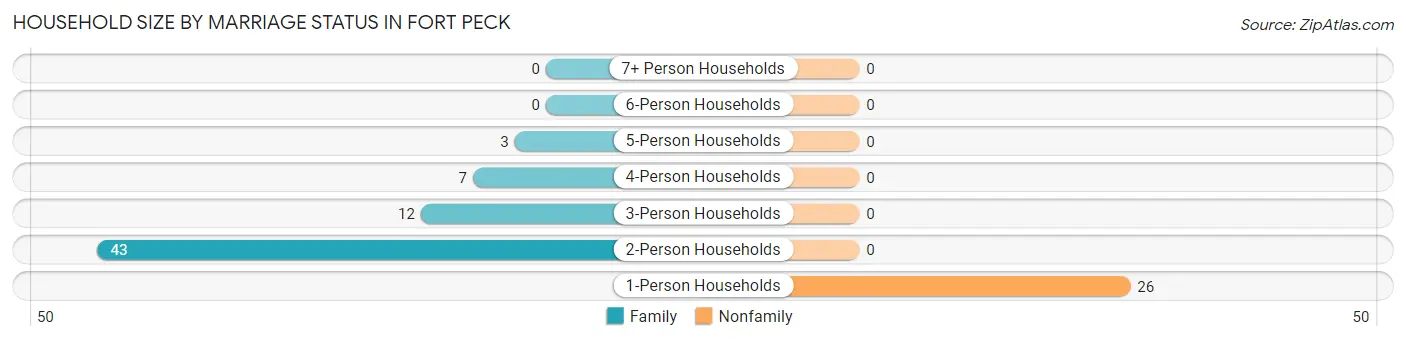
| Household Size | Family Households | Nonfamily Households |
| 1-Person Households | - | 26 (28.6%) |
| 2-Person Households | 43 (47.2%) | 0 (0.0%) |
| 3-Person Households | 12 (13.2%) | 0 (0.0%) |
| 4-Person Households | 7 (7.7%) | 0 (0.0%) |
| 5-Person Households | 3 (3.3%) | 0 (0.0%) |
| 6-Person Households | 0 (0.0%) | 0 (0.0%) |
| 7+ Person Households | 0 (0.0%) | 0 (0.0%) |
| Total | 65 (71.4%) | 26 (28.6%) |
Female Fertility in Fort Peck
Fertility by Age in Fort Peck
| Age Bracket | Women with Births | Births / 1,000 Women |
| 15 to 19 years | 0 (0.0%) | 0.0 |
| 20 to 34 years | 0 (0.0%) | 0.0 |
| 35 to 50 years | 0 (0.0%) | 0.0 |
| Total | 0 (0.0%) | 0.0 |
Fertility by Age by Marriage Status in Fort Peck
| Age Bracket | Married | Unmarried |
| 15 to 19 years | 0 (0.0%) | 0 (0.0%) |
| 20 to 34 years | 0 (0.0%) | 0 (0.0%) |
| 35 to 50 years | 0 (0.0%) | 0 (0.0%) |
| Total | 0 (0.0%) | 0 (0.0%) |
Fertility by Education in Fort Peck
| Educational Attainment | Women with Births | Births / 1,000 Women |
| Less than High School | 0 (0.0%) | 0.0 |
| High School Diploma | 0 (0.0%) | 0.0 |
| College or Associate's Degree | 0 (0.0%) | 0.0 |
| Bachelor's Degree | 0 (0.0%) | 0.0 |
| Graduate Degree | 0 (0.0%) | 0.0 |
| Total | 0 (0.0%) | 0.0 |
Fertility by Education by Marriage Status in Fort Peck
| Educational Attainment | Married | Unmarried |
| Less than High School | 0 (0.0%) | 0 (0.0%) |
| High School Diploma | 0 (0.0%) | 0 (0.0%) |
| College or Associate's Degree | 0 (0.0%) | 0 (0.0%) |
| Bachelor's Degree | 0 (0.0%) | 0 (0.0%) |
| Graduate Degree | 0 (0.0%) | 0 (0.0%) |
| Total | 0 (0.0%) | 0 (0.0%) |
Employment Characteristics in Fort Peck
Employment by Class of Employer in Fort Peck
Among the 102 employed individuals in Fort Peck, federal government employees (44 | 43.1%), private company employees (19 | 18.6%), and self-employed (not incorporated) (15 | 14.7%) make up the most common classes of employment.
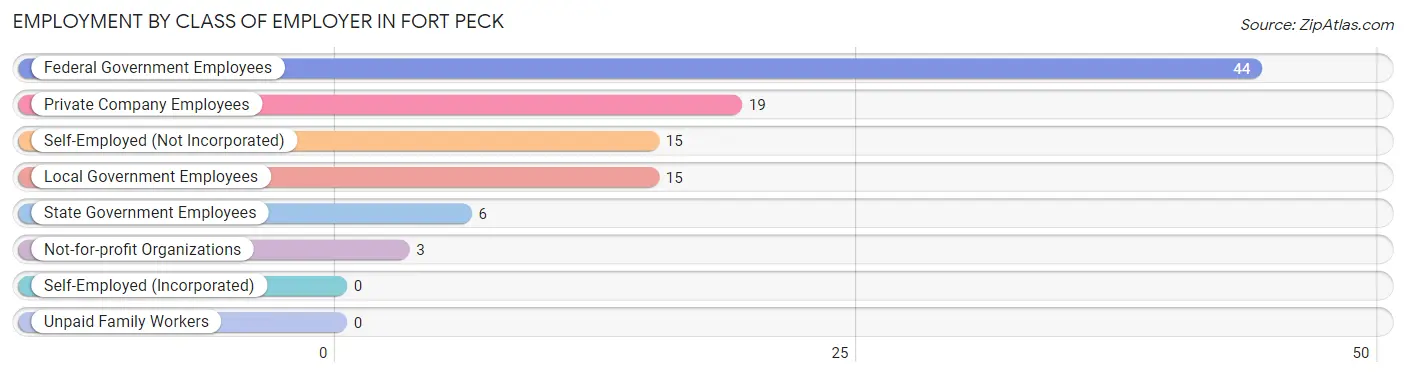
| Employer Class | # Employees | % Employees |
| Private Company Employees | 19 | 18.6% |
| Self-Employed (Incorporated) | 0 | 0.0% |
| Self-Employed (Not Incorporated) | 15 | 14.7% |
| Not-for-profit Organizations | 3 | 2.9% |
| Local Government Employees | 15 | 14.7% |
| State Government Employees | 6 | 5.9% |
| Federal Government Employees | 44 | 43.1% |
| Unpaid Family Workers | 0 | 0.0% |
| Total | 102 | 100.0% |
Employment Status by Age in Fort Peck
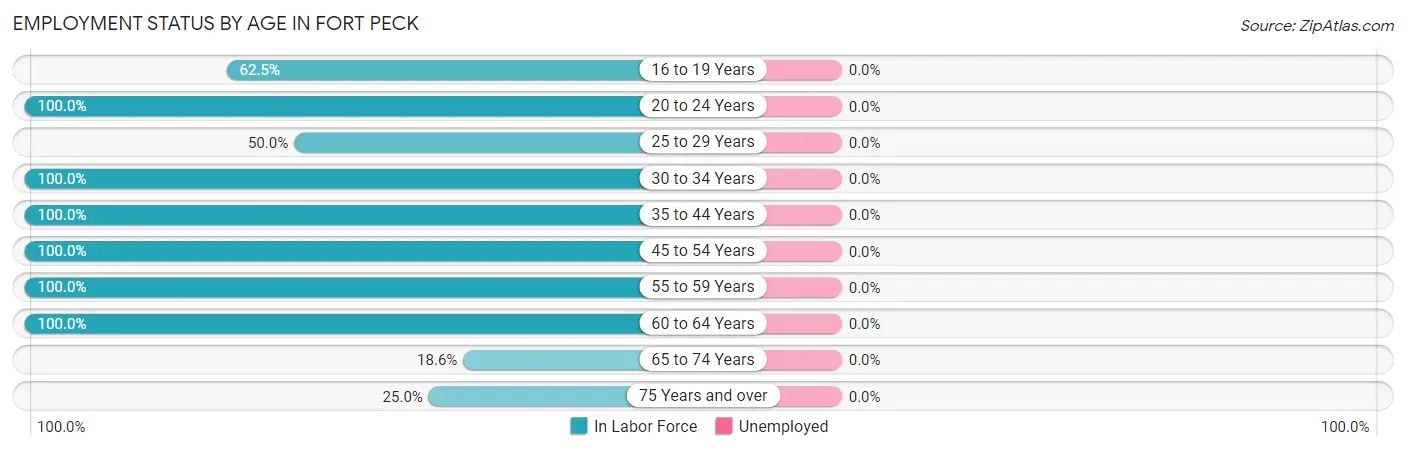
| Age Bracket | In Labor Force | Unemployed |
| 16 to 19 Years | 10 (62.5%) | 0 (0.0%) |
| 20 to 24 Years | 5 (100.0%) | 0 (0.0%) |
| 25 to 29 Years | 4 (50.0%) | 0 (0.0%) |
| 30 to 34 Years | 3 (100.0%) | 0 (0.0%) |
| 35 to 44 Years | 16 (100.0%) | 0 (0.0%) |
| 45 to 54 Years | 35 (100.0%) | 0 (0.0%) |
| 55 to 59 Years | 20 (100.0%) | 0 (0.0%) |
| 60 to 64 Years | 5 (100.0%) | 0 (0.0%) |
| 65 to 74 Years | 8 (18.6%) | 0 (0.0%) |
| 75 Years and over | 5 (25.0%) | 0 (0.0%) |
| Total | 111 (64.9%) | 0 (0.0%) |
Employment Status by Educational Attainment in Fort Peck
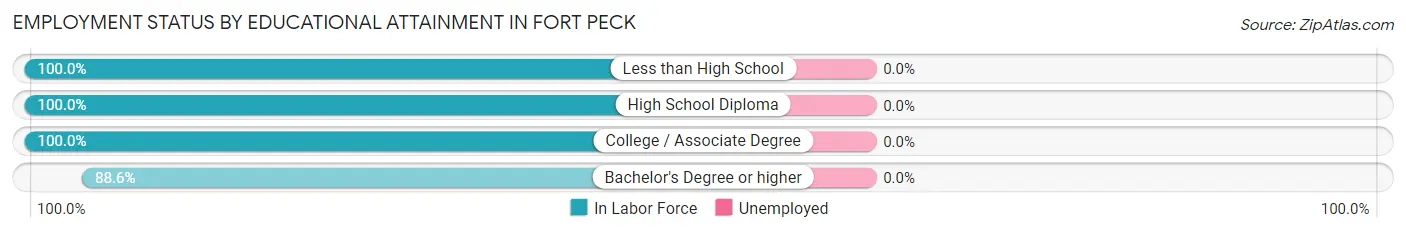
| Educational Attainment | In Labor Force | Unemployed |
| Less than High School | 3 (100.0%) | 0 (0.0%) |
| High School Diploma | 10 (100.0%) | 0 (0.0%) |
| College / Associate Degree | 39 (100.0%) | 0 (0.0%) |
| Bachelor's Degree or higher | 31 (88.6%) | 0 (0.0%) |
| Total | 83 (95.4%) | 0 (0.0%) |
Employment Occupations by Sex in Fort Peck
Management, Business, Science and Arts Occupations
The most common Management, Business, Science and Arts occupations in Fort Peck are Management (23 | 20.7%), Community & Social Service (13 | 11.7%), Education Instruction & Library (8 | 7.2%), Computers, Engineering & Science (5 | 4.5%), and Architecture & Engineering (5 | 4.5%).
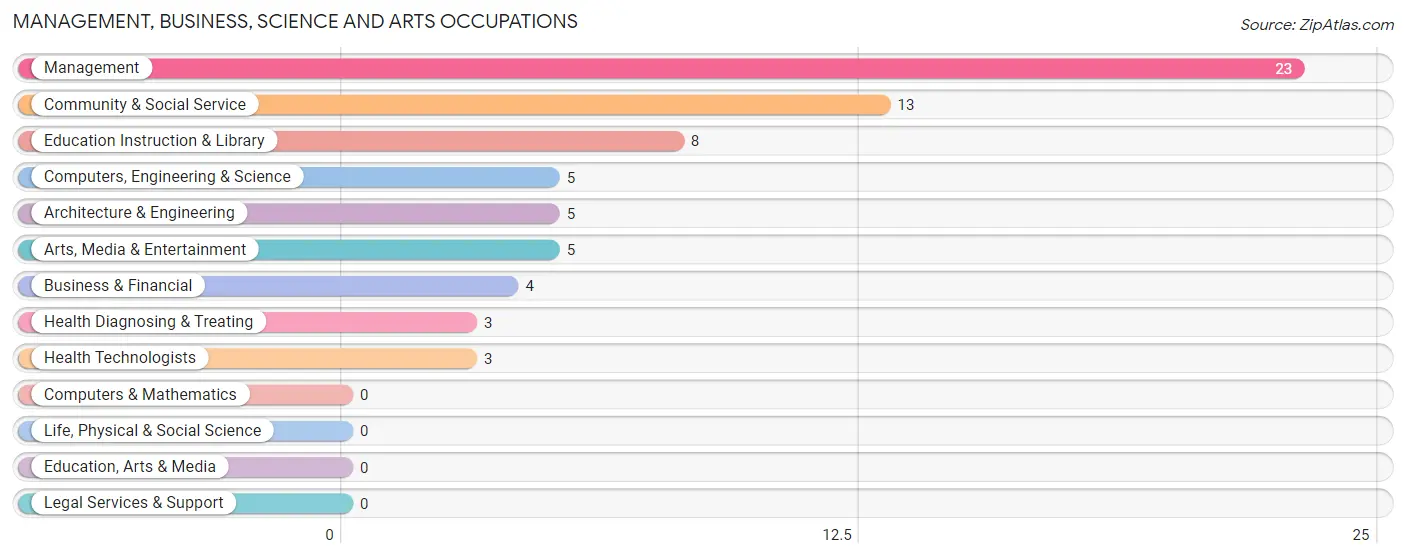
Management, Business, Science and Arts Occupations by Sex
Within the Management, Business, Science and Arts occupations in Fort Peck, the most male-oriented occupations are Computers, Engineering & Science (80.0%), Architecture & Engineering (80.0%), and Management (52.2%), while the most female-oriented occupations are Business & Financial (100.0%), Arts, Media & Entertainment (100.0%), and Health Diagnosing & Treating (100.0%).
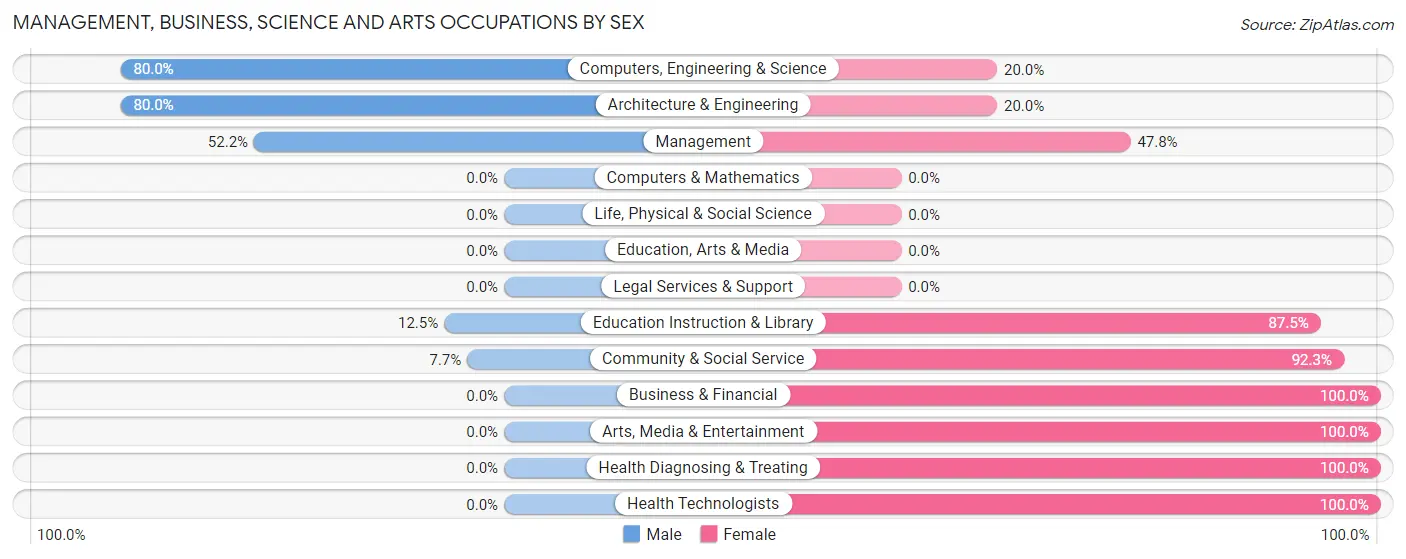
| Occupation | Male | Female |
| Management | 12 (52.2%) | 11 (47.8%) |
| Business & Financial | 0 (0.0%) | 4 (100.0%) |
| Computers, Engineering & Science | 4 (80.0%) | 1 (20.0%) |
| Computers & Mathematics | 0 (0.0%) | 0 (0.0%) |
| Architecture & Engineering | 4 (80.0%) | 1 (20.0%) |
| Life, Physical & Social Science | 0 (0.0%) | 0 (0.0%) |
| Community & Social Service | 1 (7.7%) | 12 (92.3%) |
| Education, Arts & Media | 0 (0.0%) | 0 (0.0%) |
| Legal Services & Support | 0 (0.0%) | 0 (0.0%) |
| Education Instruction & Library | 1 (12.5%) | 7 (87.5%) |
| Arts, Media & Entertainment | 0 (0.0%) | 5 (100.0%) |
| Health Diagnosing & Treating | 0 (0.0%) | 3 (100.0%) |
| Health Technologists | 0 (0.0%) | 3 (100.0%) |
| Total (Category) | 17 (35.4%) | 31 (64.6%) |
| Total (Overall) | 65 (58.6%) | 46 (41.4%) |
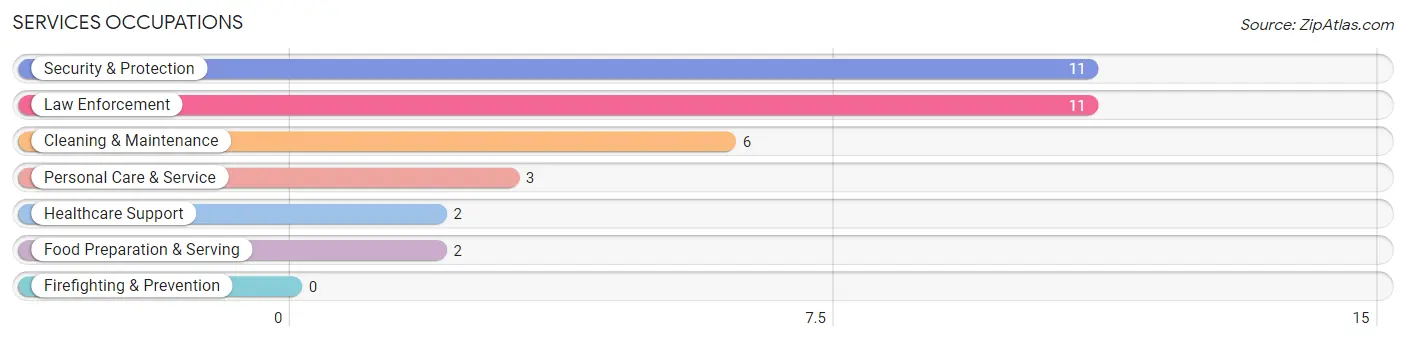
Services Occupations
The most common Services occupations in Fort Peck are Security & Protection (11 | 9.9%), Law Enforcement (11 | 9.9%), Cleaning & Maintenance (6 | 5.4%), Personal Care & Service (3 | 2.7%), and Healthcare Support (2 | 1.8%).
Services Occupations by Sex
Within the Services occupations in Fort Peck, the most male-oriented occupations are Security & Protection (100.0%), Law Enforcement (100.0%), and Food Preparation & Serving (100.0%), while the most female-oriented occupations are Healthcare Support (100.0%), and Personal Care & Service (100.0%).
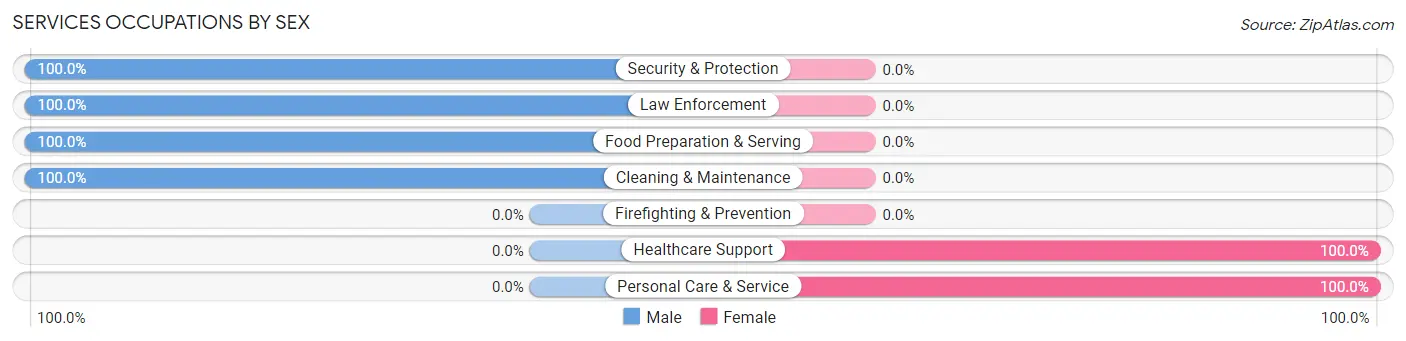
| Occupation | Male | Female |
| Healthcare Support | 0 (0.0%) | 2 (100.0%) |
| Security & Protection | 11 (100.0%) | 0 (0.0%) |
| Firefighting & Prevention | 0 (0.0%) | 0 (0.0%) |
| Law Enforcement | 11 (100.0%) | 0 (0.0%) |
| Food Preparation & Serving | 2 (100.0%) | 0 (0.0%) |
| Cleaning & Maintenance | 6 (100.0%) | 0 (0.0%) |
| Personal Care & Service | 0 (0.0%) | 3 (100.0%) |
| Total (Category) | 19 (79.2%) | 5 (20.8%) |
| Total (Overall) | 65 (58.6%) | 46 (41.4%) |
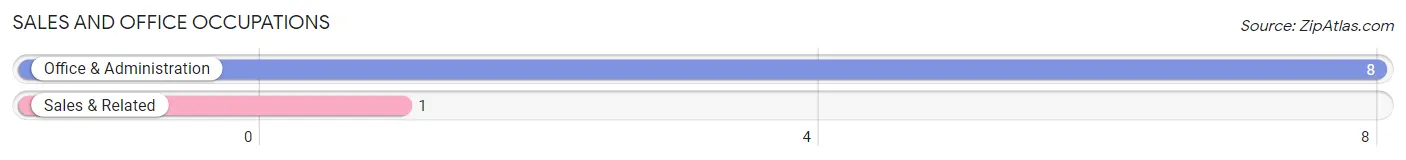
Sales and Office Occupations
The most common Sales and Office occupations in Fort Peck are Office & Administration (8 | 7.2%), and Sales & Related (1 | 0.9%).
Sales and Office Occupations by Sex
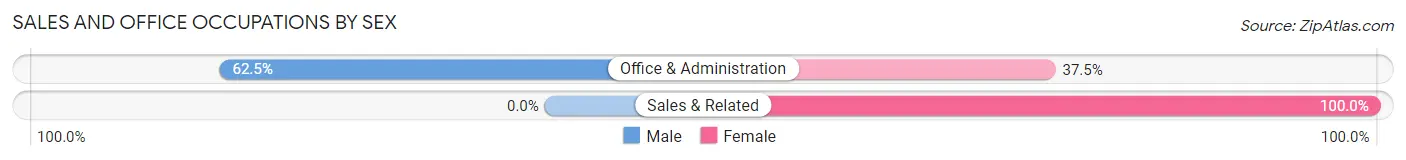
| Occupation | Male | Female |
| Sales & Related | 0 (0.0%) | 1 (100.0%) |
| Office & Administration | 5 (62.5%) | 3 (37.5%) |
| Total (Category) | 5 (55.6%) | 4 (44.4%) |
| Total (Overall) | 65 (58.6%) | 46 (41.4%) |
Natural Resources, Construction and Maintenance Occupations
The most common Natural Resources, Construction and Maintenance occupations in Fort Peck are Construction & Extraction (11 | 9.9%), Installation, Maintenance & Repair (8 | 7.2%), and Farming, Fishing & Forestry (7 | 6.3%).
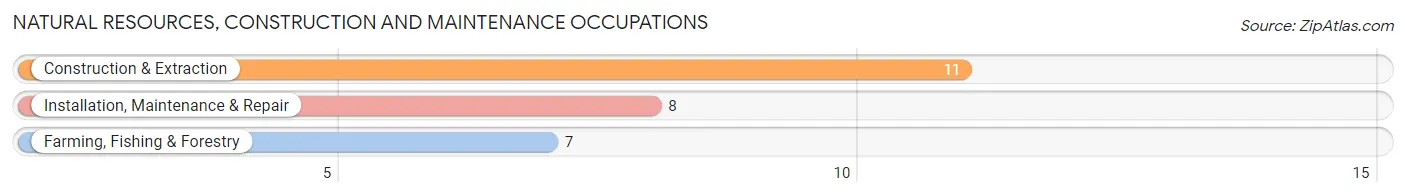
Natural Resources, Construction and Maintenance Occupations by Sex
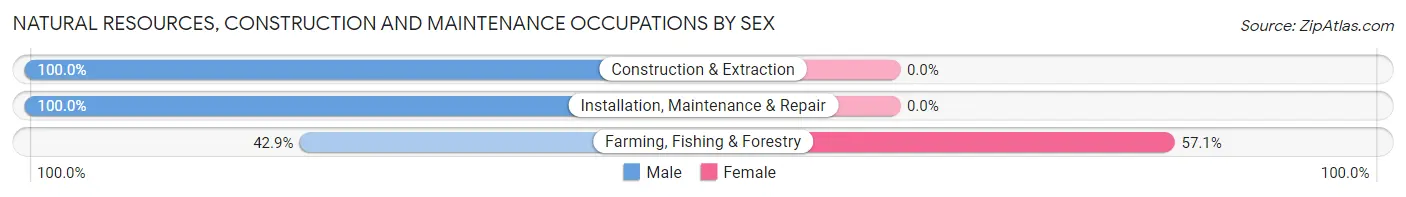
| Occupation | Male | Female |
| Farming, Fishing & Forestry | 3 (42.9%) | 4 (57.1%) |
| Construction & Extraction | 11 (100.0%) | 0 (0.0%) |
| Installation, Maintenance & Repair | 8 (100.0%) | 0 (0.0%) |
| Total (Category) | 22 (84.6%) | 4 (15.4%) |
| Total (Overall) | 65 (58.6%) | 46 (41.4%) |
Production, Transportation and Moving Occupations
The most common Production, Transportation and Moving occupations in Fort Peck are Transportation (2 | 1.8%), and Material Moving (2 | 1.8%).
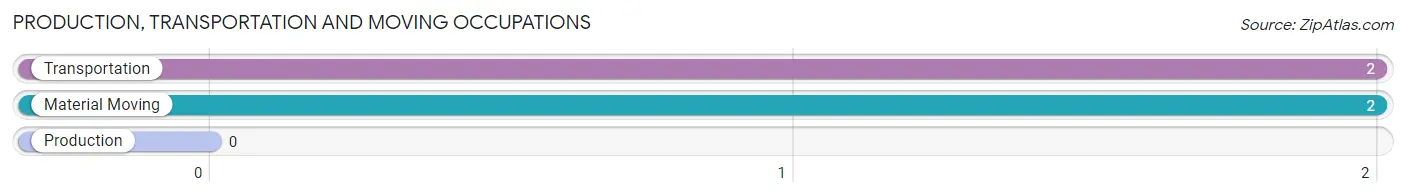
Production, Transportation and Moving Occupations by Sex
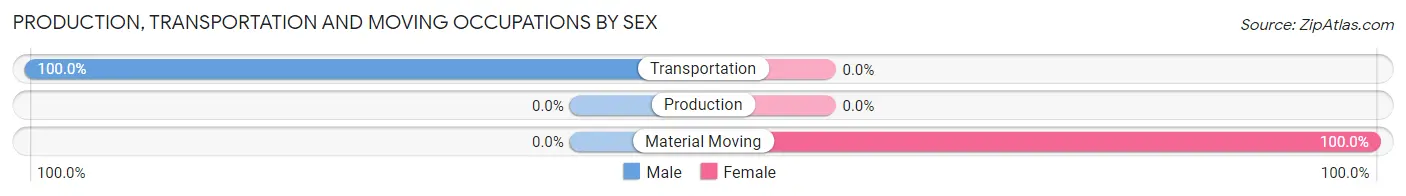
| Occupation | Male | Female |
| Production | 0 (0.0%) | 0 (0.0%) |
| Transportation | 2 (100.0%) | 0 (0.0%) |
| Material Moving | 0 (0.0%) | 2 (100.0%) |
| Total (Category) | 2 (50.0%) | 2 (50.0%) |
| Total (Overall) | 65 (58.6%) | 46 (41.4%) |
Employment Industries by Sex in Fort Peck
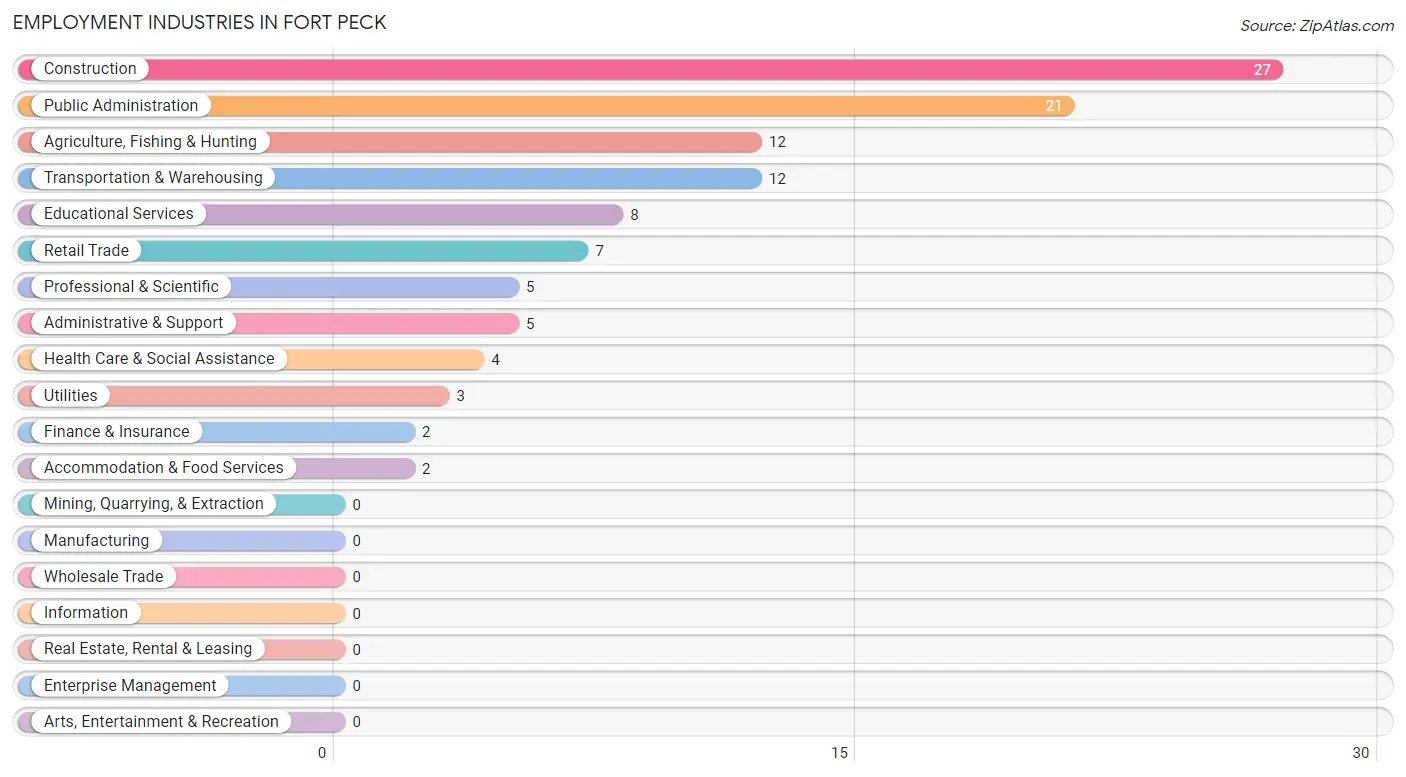
Employment Industries in Fort Peck
The major employment industries in Fort Peck include Construction (27 | 24.3%), Public Administration (21 | 18.9%), Agriculture, Fishing & Hunting (12 | 10.8%), Transportation & Warehousing (12 | 10.8%), and Educational Services (8 | 7.2%).
Employment Industries by Sex in Fort Peck
The Fort Peck industries that see more men than women are Utilities (100.0%), Accommodation & Food Services (100.0%), and Public Administration (90.5%), whereas the industries that tend to have a higher number of women are Finance & Insurance (100.0%), Professional & Scientific (100.0%), and Health Care & Social Assistance (100.0%).
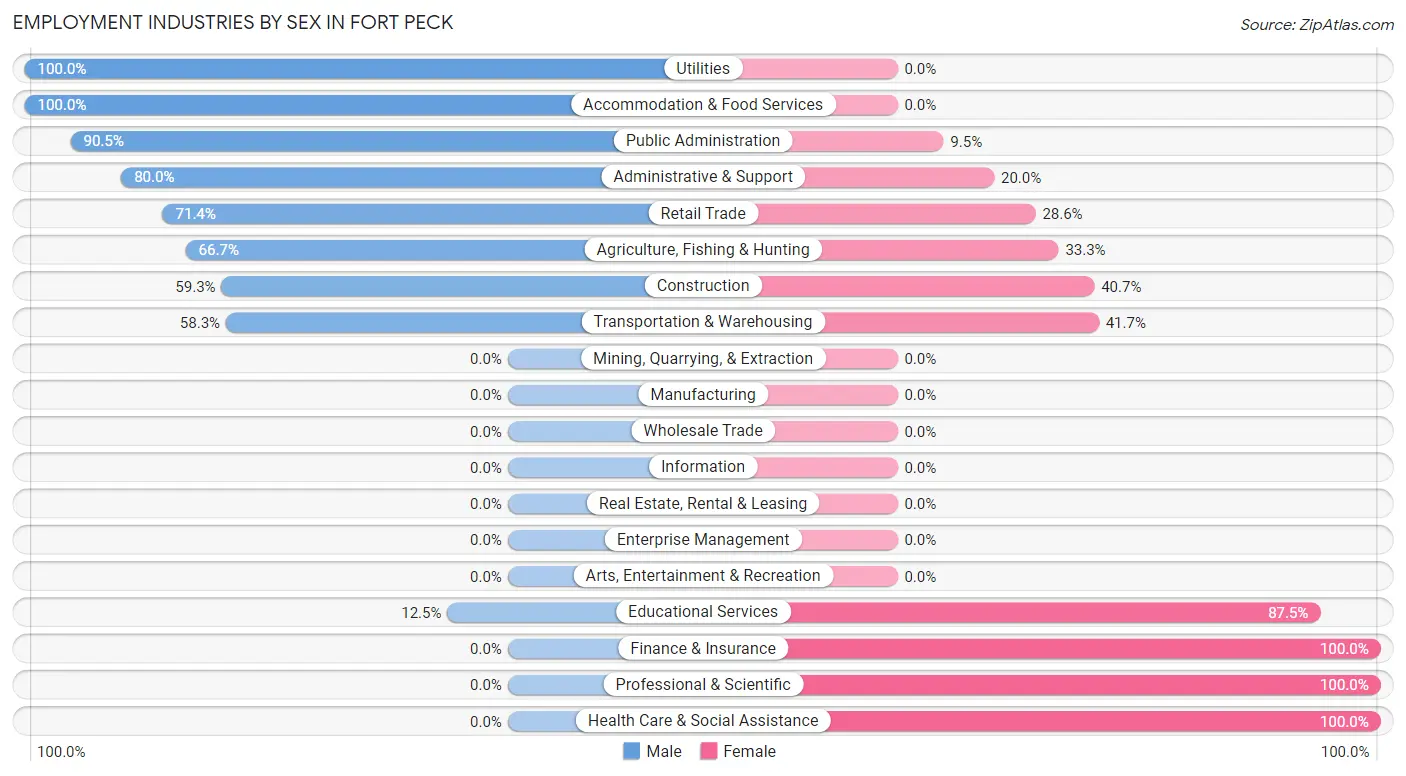
| Industry | Male | Female |
| Agriculture, Fishing & Hunting | 8 (66.7%) | 4 (33.3%) |
| Mining, Quarrying, & Extraction | 0 (0.0%) | 0 (0.0%) |
| Construction | 16 (59.3%) | 11 (40.7%) |
| Manufacturing | 0 (0.0%) | 0 (0.0%) |
| Wholesale Trade | 0 (0.0%) | 0 (0.0%) |
| Retail Trade | 5 (71.4%) | 2 (28.6%) |
| Transportation & Warehousing | 7 (58.3%) | 5 (41.7%) |
| Utilities | 3 (100.0%) | 0 (0.0%) |
| Information | 0 (0.0%) | 0 (0.0%) |
| Finance & Insurance | 0 (0.0%) | 2 (100.0%) |
| Real Estate, Rental & Leasing | 0 (0.0%) | 0 (0.0%) |
| Professional & Scientific | 0 (0.0%) | 5 (100.0%) |
| Enterprise Management | 0 (0.0%) | 0 (0.0%) |
| Administrative & Support | 4 (80.0%) | 1 (20.0%) |
| Educational Services | 1 (12.5%) | 7 (87.5%) |
| Health Care & Social Assistance | 0 (0.0%) | 4 (100.0%) |
| Arts, Entertainment & Recreation | 0 (0.0%) | 0 (0.0%) |
| Accommodation & Food Services | 2 (100.0%) | 0 (0.0%) |
| Public Administration | 19 (90.5%) | 2 (9.5%) |
| Total | 65 (58.6%) | 46 (41.4%) |
Education in Fort Peck
School Enrollment in Fort Peck
The most common levels of schooling among the 41 students in Fort Peck are middle school (20 | 48.8%), high school (16 | 39.0%), and elementary school (3 | 7.3%).
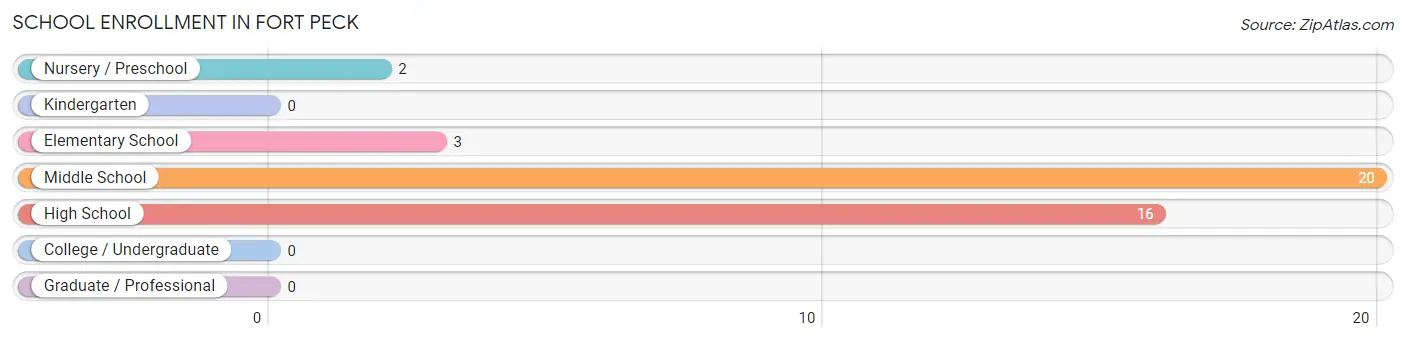
| School Level | # Students | % Students |
| Nursery / Preschool | 2 | 4.9% |
| Kindergarten | 0 | 0.0% |
| Elementary School | 3 | 7.3% |
| Middle School | 20 | 48.8% |
| High School | 16 | 39.0% |
| College / Undergraduate | 0 | 0.0% |
| Graduate / Professional | 0 | 0.0% |
| Total | 41 | 100.0% |
School Enrollment by Age by Funding Source in Fort Peck
Out of a total of 41 students who are enrolled in schools in Fort Peck, 2 (4.9%) attend a private institution, while the remaining 39 (95.1%) are enrolled in public schools. The age group of 3 to 4 year olds has the highest likelihood of being enrolled in private schools, with 2 (100.0% in the age bracket) enrolled. Conversely, the age group of 5 to 9 year old has the lowest likelihood of being enrolled in a private school, with 3 (100.0% in the age bracket) attending a public institution.
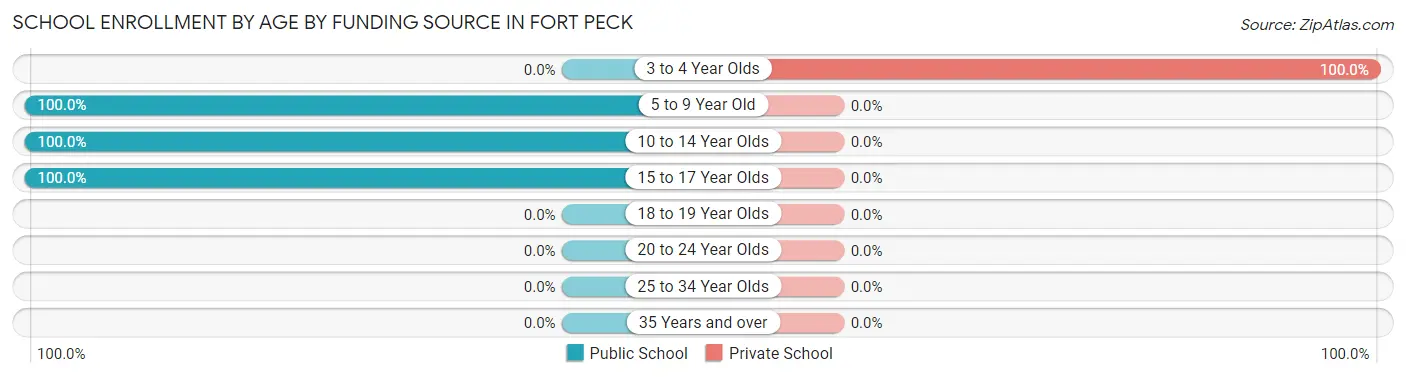
| Age Bracket | Public School | Private School |
| 3 to 4 Year Olds | 0 (0.0%) | 2 (100.0%) |
| 5 to 9 Year Old | 3 (100.0%) | 0 (0.0%) |
| 10 to 14 Year Olds | 21 (100.0%) | 0 (0.0%) |
| 15 to 17 Year Olds | 15 (100.0%) | 0 (0.0%) |
| 18 to 19 Year Olds | 0 (0.0%) | 0 (0.0%) |
| 20 to 24 Year Olds | 0 (0.0%) | 0 (0.0%) |
| 25 to 34 Year Olds | 0 (0.0%) | 0 (0.0%) |
| 35 Years and over | 0 (0.0%) | 0 (0.0%) |
| Total | 39 (95.1%) | 2 (4.9%) |
Educational Attainment by Field of Study in Fort Peck
Education (29 | 42.6%), liberal arts & history (7 | 10.3%), bio, nature & agricultural (6 | 8.8%), science & technology (6 | 8.8%), and literature & languages (6 | 8.8%) are the most common fields of study among 68 individuals in Fort Peck who have obtained a bachelor's degree or higher.
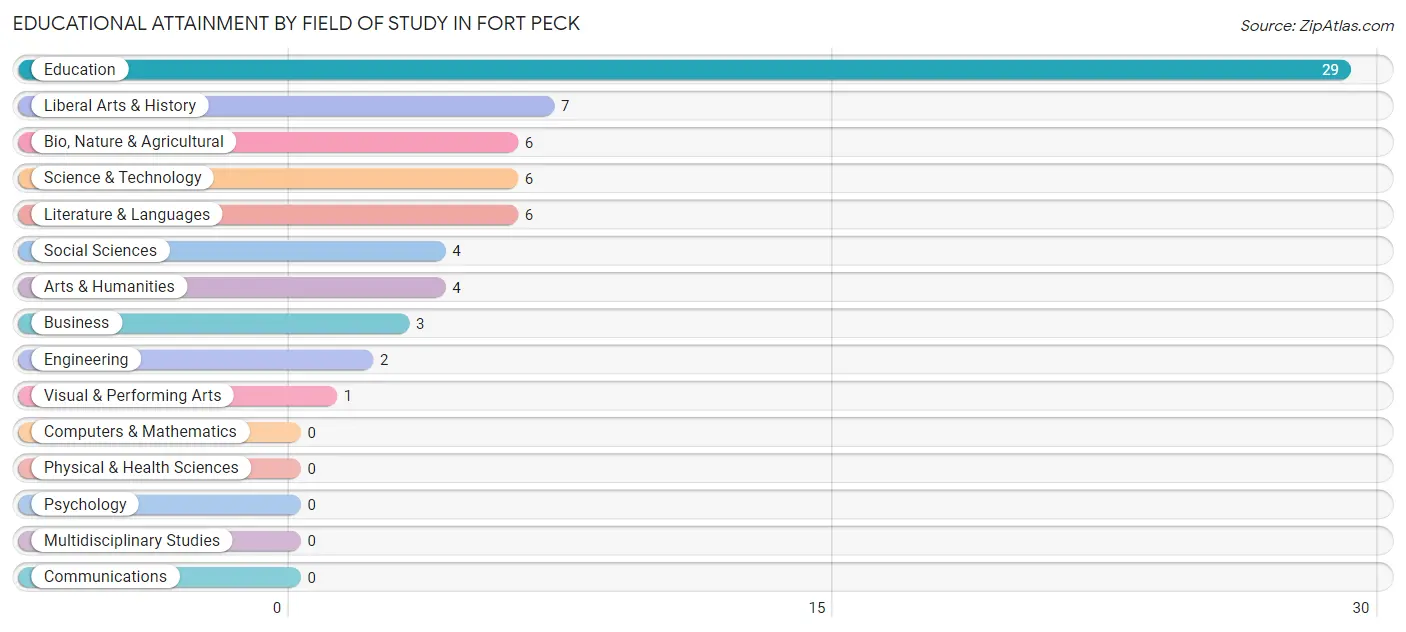
| Field of Study | # Graduates | % Graduates |
| Computers & Mathematics | 0 | 0.0% |
| Bio, Nature & Agricultural | 6 | 8.8% |
| Physical & Health Sciences | 0 | 0.0% |
| Psychology | 0 | 0.0% |
| Social Sciences | 4 | 5.9% |
| Engineering | 2 | 2.9% |
| Multidisciplinary Studies | 0 | 0.0% |
| Science & Technology | 6 | 8.8% |
| Business | 3 | 4.4% |
| Education | 29 | 42.6% |
| Literature & Languages | 6 | 8.8% |
| Liberal Arts & History | 7 | 10.3% |
| Visual & Performing Arts | 1 | 1.5% |
| Communications | 0 | 0.0% |
| Arts & Humanities | 4 | 5.9% |
| Total | 68 | 100.0% |
Transportation & Commute in Fort Peck
Vehicle Availability by Sex in Fort Peck
The most prevalent vehicle ownership categories in Fort Peck are males with 3 vehicles (29, accounting for 46.8%) and females with 3 vehicles (17, making up 72.5%).
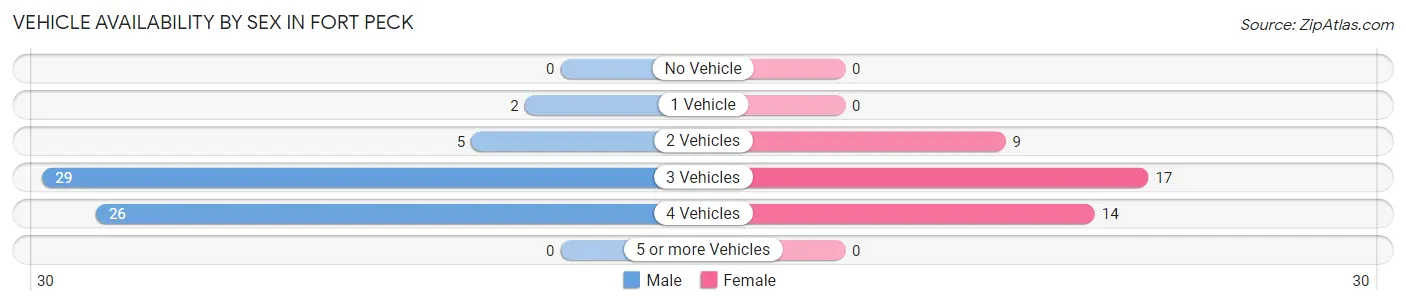
| Vehicles Available | Male | Female |
| No Vehicle | 0 (0.0%) | 0 (0.0%) |
| 1 Vehicle | 2 (3.2%) | 0 (0.0%) |
| 2 Vehicles | 5 (8.1%) | 9 (22.5%) |
| 3 Vehicles | 29 (46.8%) | 17 (42.5%) |
| 4 Vehicles | 26 (41.9%) | 14 (35.0%) |
| 5 or more Vehicles | 0 (0.0%) | 0 (0.0%) |
| Total | 62 (100.0%) | 40 (100.0%) |
Commute Time in Fort Peck
The most frequently occuring commute durations in Fort Peck are 20 to 24 minutes (19 commuters, 22.6%), less than 5 minutes (18 commuters, 21.4%), and 5 to 9 minutes (17 commuters, 20.2%).
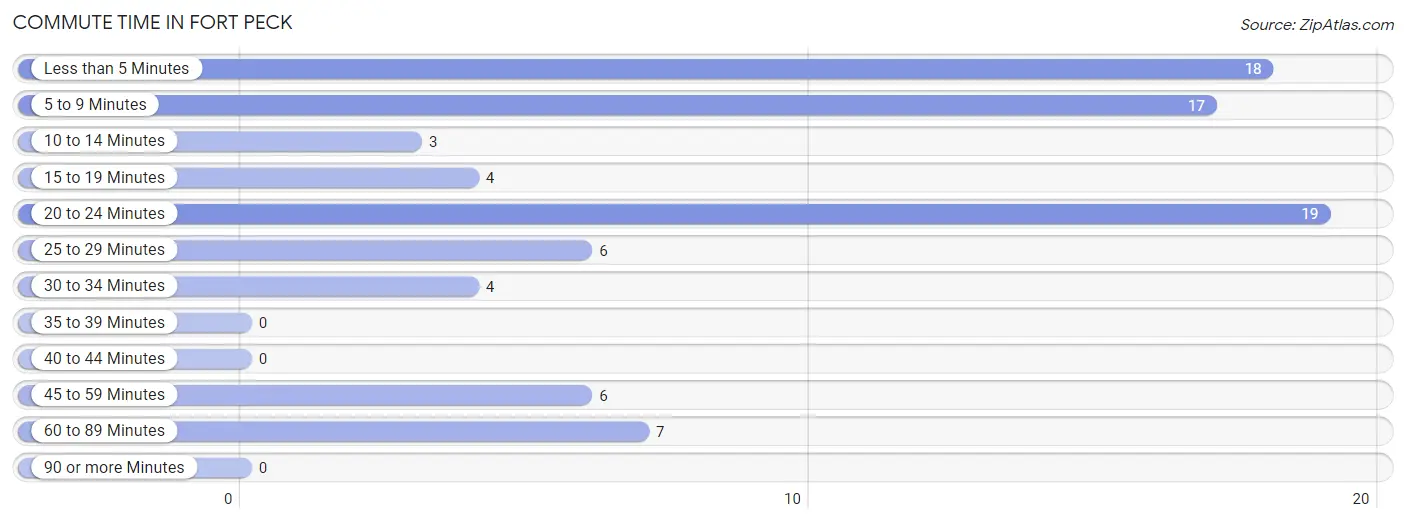
| Commute Time | # Commuters | % Commuters |
| Less than 5 Minutes | 18 | 21.4% |
| 5 to 9 Minutes | 17 | 20.2% |
| 10 to 14 Minutes | 3 | 3.6% |
| 15 to 19 Minutes | 4 | 4.8% |
| 20 to 24 Minutes | 19 | 22.6% |
| 25 to 29 Minutes | 6 | 7.1% |
| 30 to 34 Minutes | 4 | 4.8% |
| 35 to 39 Minutes | 0 | 0.0% |
| 40 to 44 Minutes | 0 | 0.0% |
| 45 to 59 Minutes | 6 | 7.1% |
| 60 to 89 Minutes | 7 | 8.3% |
| 90 or more Minutes | 0 | 0.0% |
Commute Time by Sex in Fort Peck
The most common commute times in Fort Peck are 20 to 24 minutes (17 commuters, 32.7%) for males and less than 5 minutes (13 commuters, 40.6%) for females.
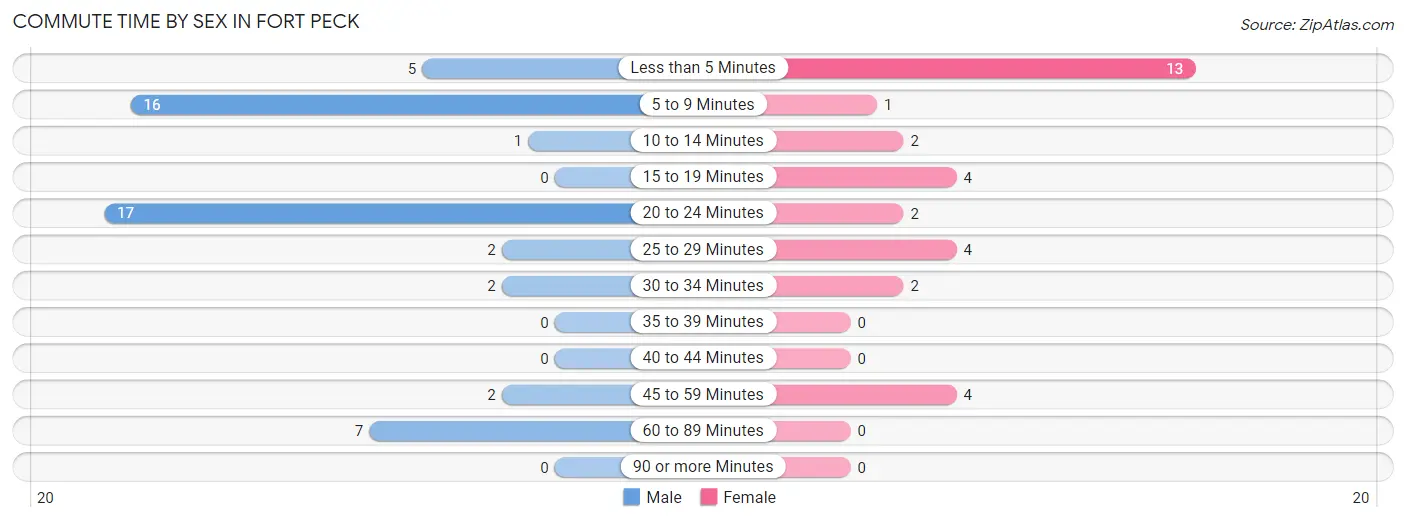
| Commute Time | Male | Female |
| Less than 5 Minutes | 5 (9.6%) | 13 (40.6%) |
| 5 to 9 Minutes | 16 (30.8%) | 1 (3.1%) |
| 10 to 14 Minutes | 1 (1.9%) | 2 (6.2%) |
| 15 to 19 Minutes | 0 (0.0%) | 4 (12.5%) |
| 20 to 24 Minutes | 17 (32.7%) | 2 (6.2%) |
| 25 to 29 Minutes | 2 (3.8%) | 4 (12.5%) |
| 30 to 34 Minutes | 2 (3.8%) | 2 (6.2%) |
| 35 to 39 Minutes | 0 (0.0%) | 0 (0.0%) |
| 40 to 44 Minutes | 0 (0.0%) | 0 (0.0%) |
| 45 to 59 Minutes | 2 (3.8%) | 4 (12.5%) |
| 60 to 89 Minutes | 7 (13.5%) | 0 (0.0%) |
| 90 or more Minutes | 0 (0.0%) | 0 (0.0%) |
Time of Departure to Work by Sex in Fort Peck
The most frequent times of departure to work in Fort Peck are 6:30 AM to 6:59 AM (13, 25.0%) for males and 7:00 AM to 7:29 AM (10, 31.2%) for females.
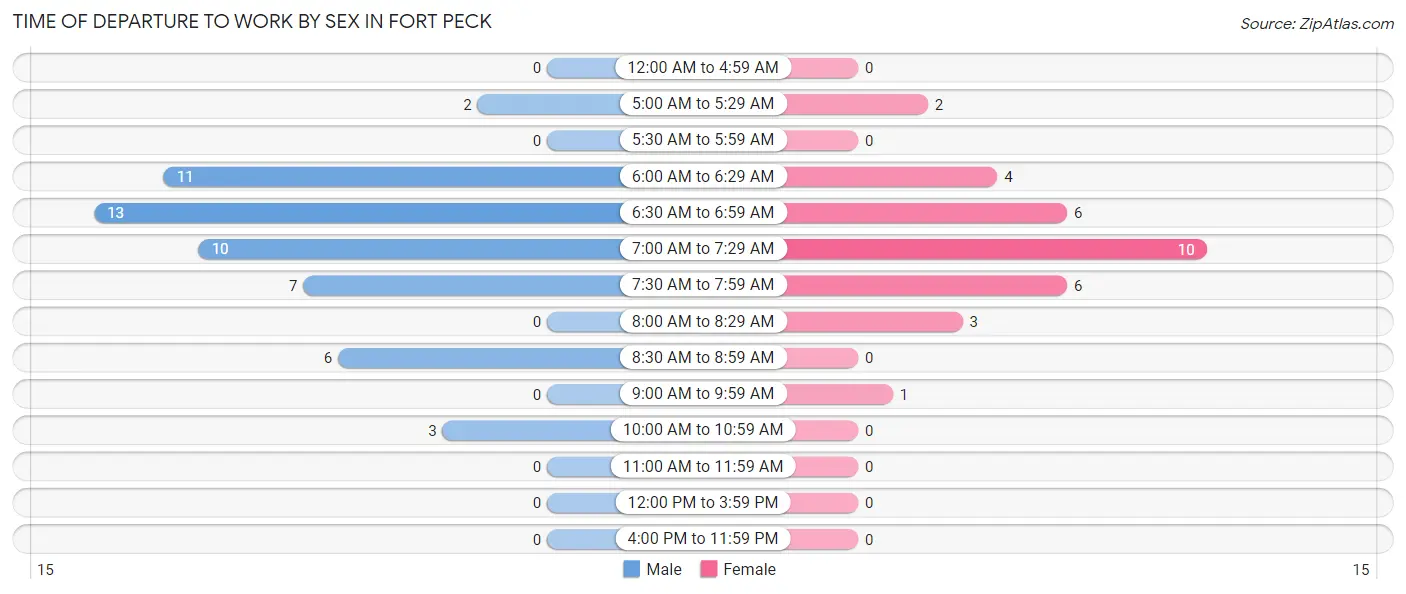
| Time of Departure | Male | Female |
| 12:00 AM to 4:59 AM | 0 (0.0%) | 0 (0.0%) |
| 5:00 AM to 5:29 AM | 2 (3.8%) | 2 (6.2%) |
| 5:30 AM to 5:59 AM | 0 (0.0%) | 0 (0.0%) |
| 6:00 AM to 6:29 AM | 11 (21.1%) | 4 (12.5%) |
| 6:30 AM to 6:59 AM | 13 (25.0%) | 6 (18.8%) |
| 7:00 AM to 7:29 AM | 10 (19.2%) | 10 (31.2%) |
| 7:30 AM to 7:59 AM | 7 (13.5%) | 6 (18.8%) |
| 8:00 AM to 8:29 AM | 0 (0.0%) | 3 (9.4%) |
| 8:30 AM to 8:59 AM | 6 (11.5%) | 0 (0.0%) |
| 9:00 AM to 9:59 AM | 0 (0.0%) | 1 (3.1%) |
| 10:00 AM to 10:59 AM | 3 (5.8%) | 0 (0.0%) |
| 11:00 AM to 11:59 AM | 0 (0.0%) | 0 (0.0%) |
| 12:00 PM to 3:59 PM | 0 (0.0%) | 0 (0.0%) |
| 4:00 PM to 11:59 PM | 0 (0.0%) | 0 (0.0%) |
| Total | 52 (100.0%) | 32 (100.0%) |
Housing Occupancy in Fort Peck
Occupancy by Ownership in Fort Peck
Of the total 91 dwellings in Fort Peck, owner-occupied units account for 87 (95.6%), while renter-occupied units make up 4 (4.4%).
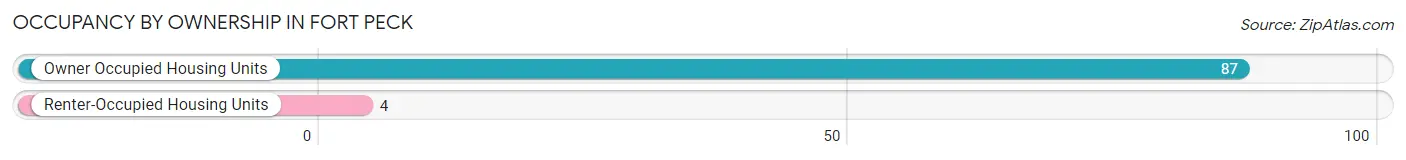
| Occupancy | # Housing Units | % Housing Units |
| Owner Occupied Housing Units | 87 | 95.6% |
| Renter-Occupied Housing Units | 4 | 4.4% |
| Total Occupied Housing Units | 91 | 100.0% |
Occupancy by Household Size in Fort Peck
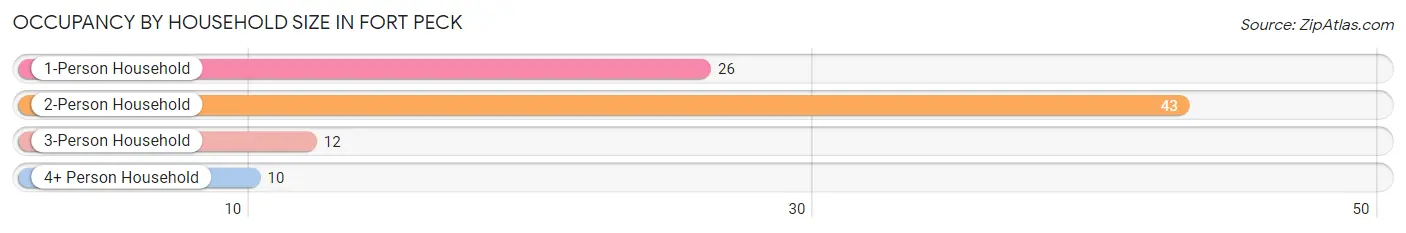
| Household Size | # Housing Units | % Housing Units |
| 1-Person Household | 26 | 28.6% |
| 2-Person Household | 43 | 47.2% |
| 3-Person Household | 12 | 13.2% |
| 4+ Person Household | 10 | 11.0% |
| Total Housing Units | 91 | 100.0% |
Occupancy by Ownership by Household Size in Fort Peck
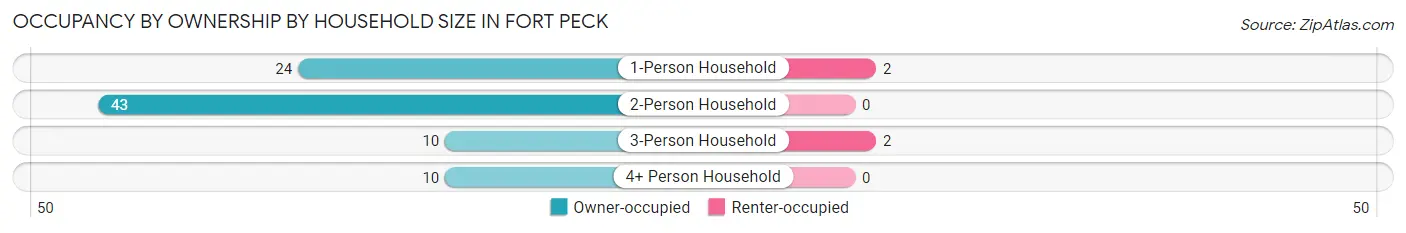
| Household Size | Owner-occupied | Renter-occupied |
| 1-Person Household | 24 (92.3%) | 2 (7.7%) |
| 2-Person Household | 43 (100.0%) | 0 (0.0%) |
| 3-Person Household | 10 (83.3%) | 2 (16.7%) |
| 4+ Person Household | 10 (100.0%) | 0 (0.0%) |
| Total Housing Units | 87 (95.6%) | 4 (4.4%) |
Occupancy by Educational Attainment in Fort Peck
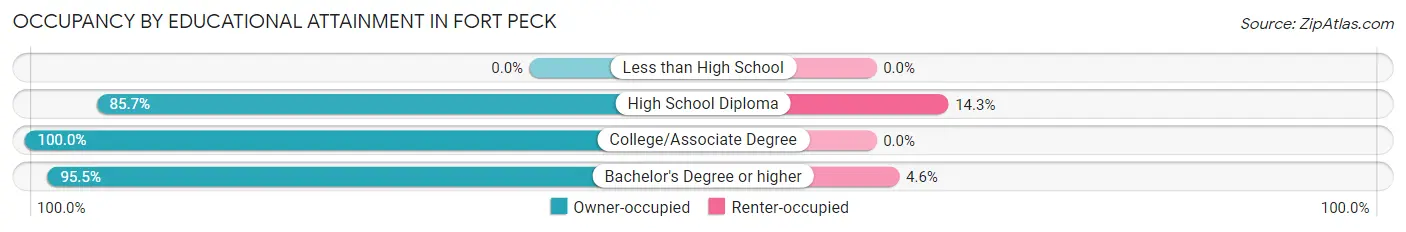
| Household Size | Owner-occupied | Renter-occupied |
| Less than High School | 0 (0.0%) | 0 (0.0%) |
| High School Diploma | 12 (85.7%) | 2 (14.3%) |
| College/Associate Degree | 33 (100.0%) | 0 (0.0%) |
| Bachelor's Degree or higher | 42 (95.5%) | 2 (4.5%) |
Occupancy by Age of Householder in Fort Peck
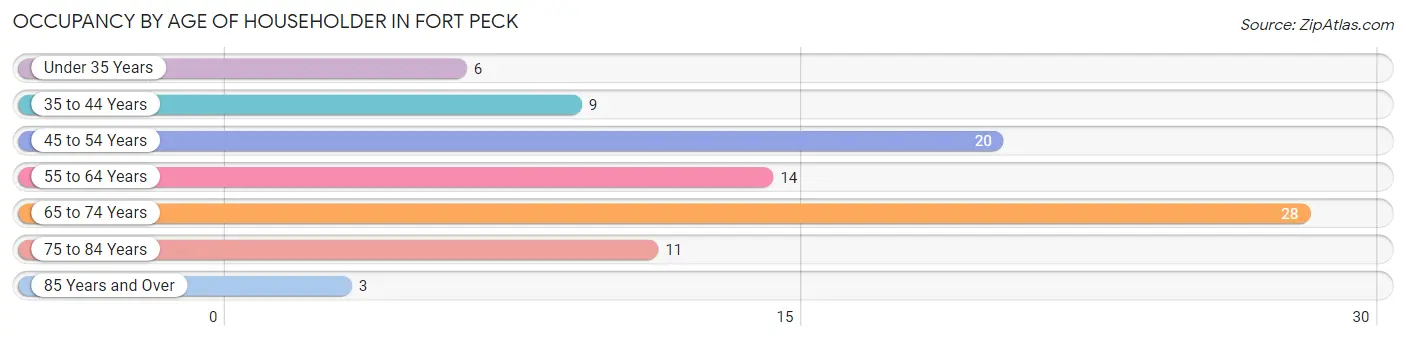
| Age Bracket | # Households | % Households |
| Under 35 Years | 6 | 6.6% |
| 35 to 44 Years | 9 | 9.9% |
| 45 to 54 Years | 20 | 22.0% |
| 55 to 64 Years | 14 | 15.4% |
| 65 to 74 Years | 28 | 30.8% |
| 75 to 84 Years | 11 | 12.1% |
| 85 Years and Over | 3 | 3.3% |
| Total | 91 | 100.0% |
Housing Finances in Fort Peck
Median Income by Occupancy in Fort Peck
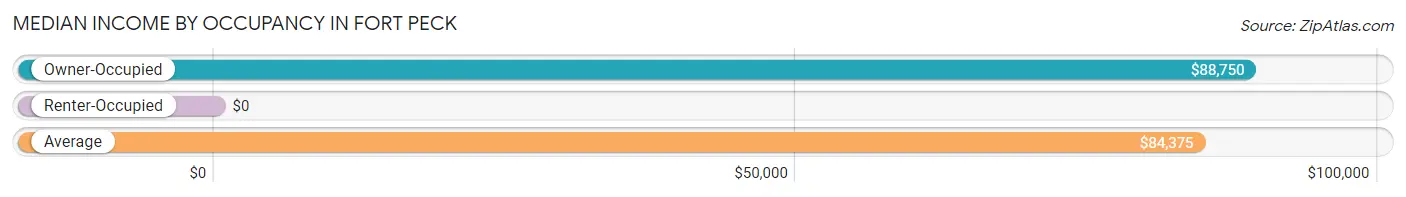
| Occupancy Type | # Households | Median Income |
| Owner-Occupied | 87 (95.6%) | $88,750 |
| Renter-Occupied | 4 (4.4%) | $0 |
| Average | 91 (100.0%) | $84,375 |
Occupancy by Householder Income Bracket in Fort Peck
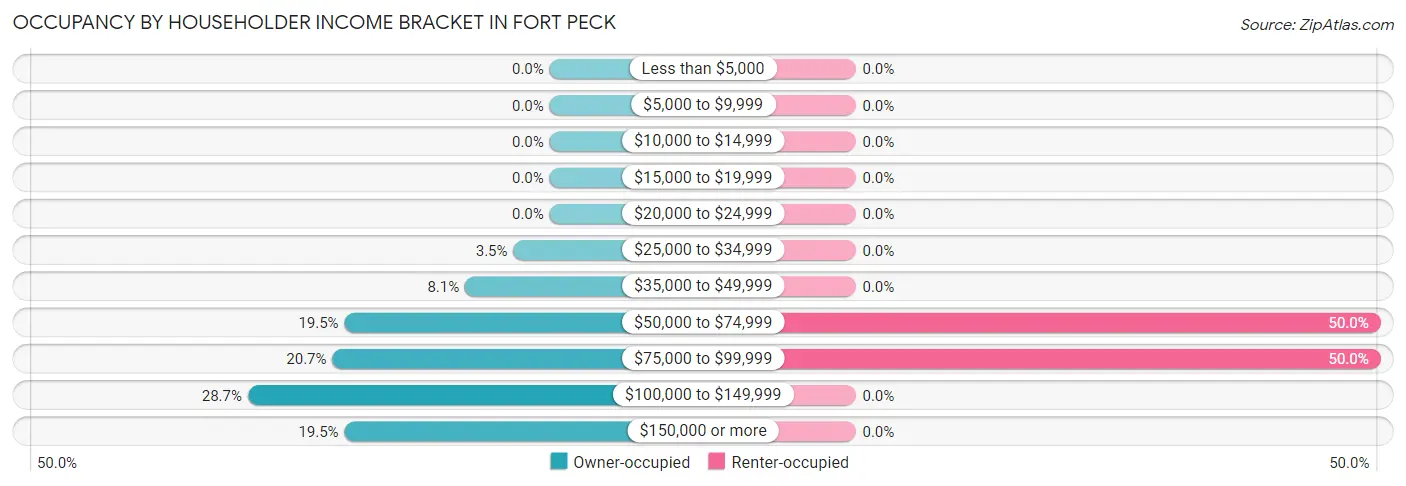
| Income Bracket | Owner-occupied | Renter-occupied |
| Less than $5,000 | 0 (0.0%) | 0 (0.0%) |
| $5,000 to $9,999 | 0 (0.0%) | 0 (0.0%) |
| $10,000 to $14,999 | 0 (0.0%) | 0 (0.0%) |
| $15,000 to $19,999 | 0 (0.0%) | 0 (0.0%) |
| $20,000 to $24,999 | 0 (0.0%) | 0 (0.0%) |
| $25,000 to $34,999 | 3 (3.5%) | 0 (0.0%) |
| $35,000 to $49,999 | 7 (8.1%) | 0 (0.0%) |
| $50,000 to $74,999 | 17 (19.5%) | 2 (50.0%) |
| $75,000 to $99,999 | 18 (20.7%) | 2 (50.0%) |
| $100,000 to $149,999 | 25 (28.7%) | 0 (0.0%) |
| $150,000 or more | 17 (19.5%) | 0 (0.0%) |
| Total | 87 (100.0%) | 4 (100.0%) |
Monthly Housing Cost Tiers in Fort Peck
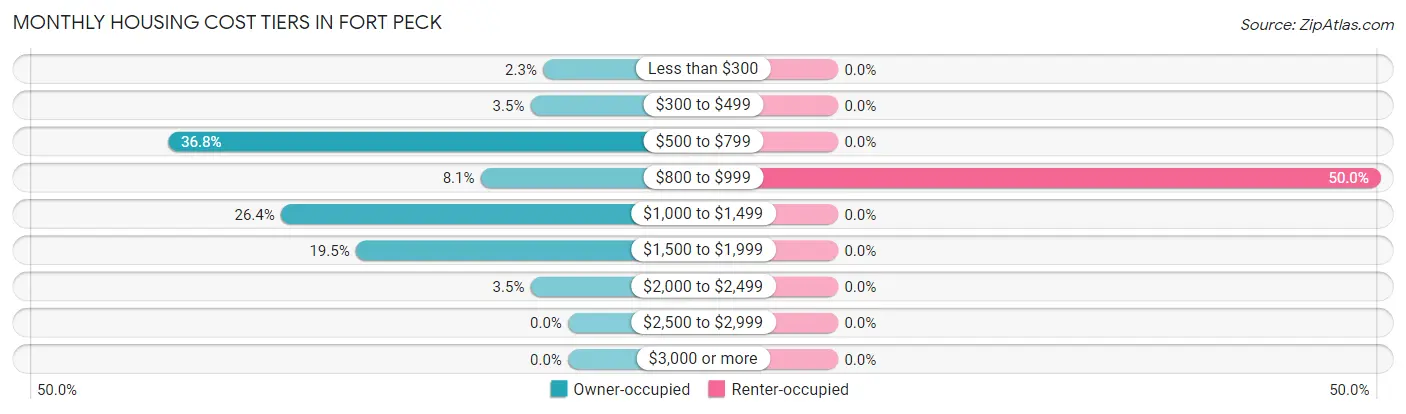
| Monthly Cost | Owner-occupied | Renter-occupied |
| Less than $300 | 2 (2.3%) | 0 (0.0%) |
| $300 to $499 | 3 (3.5%) | 0 (0.0%) |
| $500 to $799 | 32 (36.8%) | 0 (0.0%) |
| $800 to $999 | 7 (8.1%) | 2 (50.0%) |
| $1,000 to $1,499 | 23 (26.4%) | 0 (0.0%) |
| $1,500 to $1,999 | 17 (19.5%) | 0 (0.0%) |
| $2,000 to $2,499 | 3 (3.5%) | 0 (0.0%) |
| $2,500 to $2,999 | 0 (0.0%) | 0 (0.0%) |
| $3,000 or more | 0 (0.0%) | 0 (0.0%) |
| Total | 87 (100.0%) | 4 (100.0%) |
Physical Housing Characteristics in Fort Peck
Housing Structures in Fort Peck
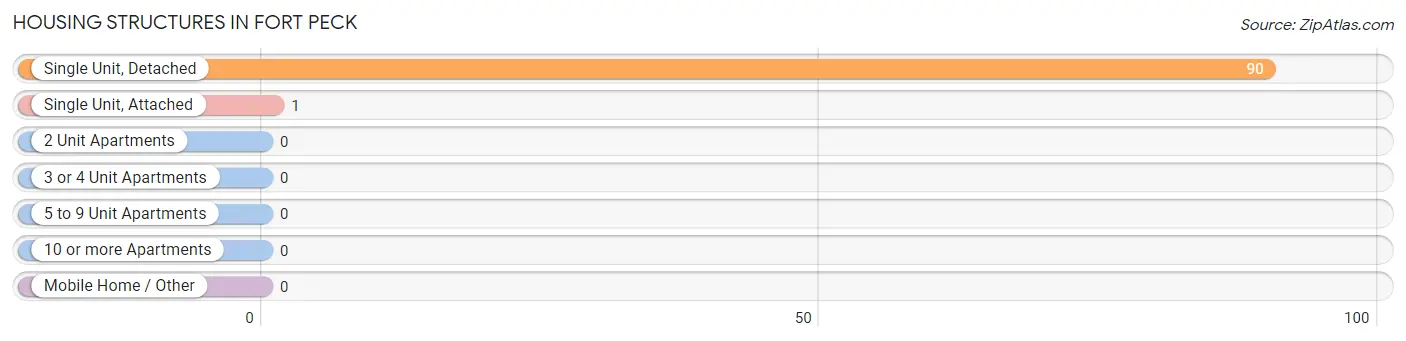
| Structure Type | # Housing Units | % Housing Units |
| Single Unit, Detached | 90 | 98.9% |
| Single Unit, Attached | 1 | 1.1% |
| 2 Unit Apartments | 0 | 0.0% |
| 3 or 4 Unit Apartments | 0 | 0.0% |
| 5 to 9 Unit Apartments | 0 | 0.0% |
| 10 or more Apartments | 0 | 0.0% |
| Mobile Home / Other | 0 | 0.0% |
| Total | 91 | 100.0% |
Housing Structures by Occupancy in Fort Peck
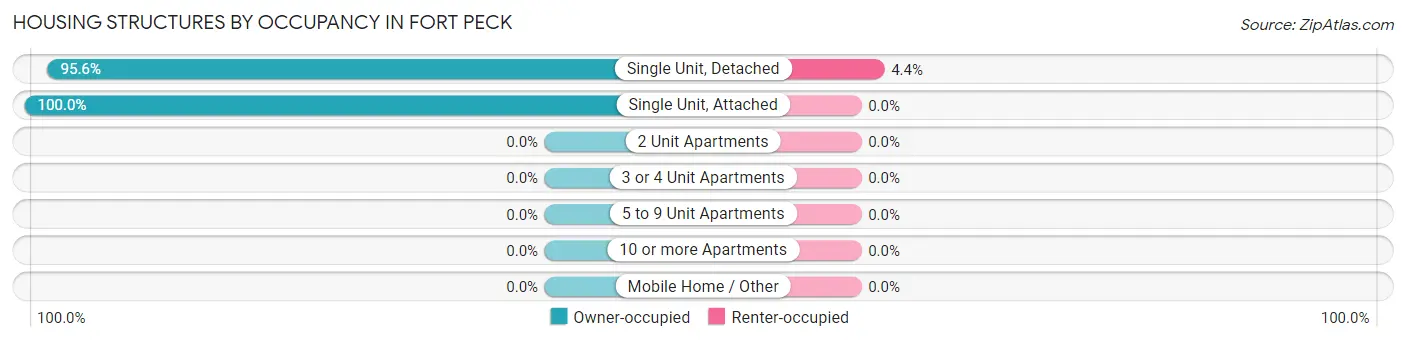
| Structure Type | Owner-occupied | Renter-occupied |
| Single Unit, Detached | 86 (95.6%) | 4 (4.4%) |
| Single Unit, Attached | 1 (100.0%) | 0 (0.0%) |
| 2 Unit Apartments | 0 (0.0%) | 0 (0.0%) |
| 3 or 4 Unit Apartments | 0 (0.0%) | 0 (0.0%) |
| 5 to 9 Unit Apartments | 0 (0.0%) | 0 (0.0%) |
| 10 or more Apartments | 0 (0.0%) | 0 (0.0%) |
| Mobile Home / Other | 0 (0.0%) | 0 (0.0%) |
| Total | 87 (95.6%) | 4 (4.4%) |
Housing Structures by Number of Rooms in Fort Peck
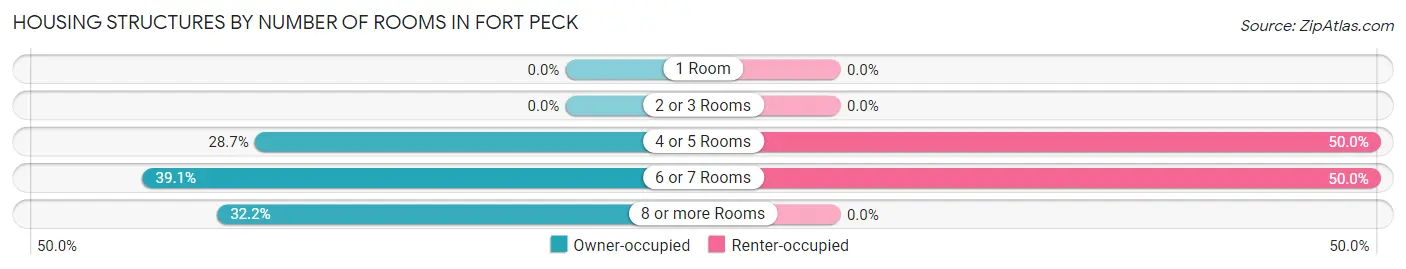
| Number of Rooms | Owner-occupied | Renter-occupied |
| 1 Room | 0 (0.0%) | 0 (0.0%) |
| 2 or 3 Rooms | 0 (0.0%) | 0 (0.0%) |
| 4 or 5 Rooms | 25 (28.7%) | 2 (50.0%) |
| 6 or 7 Rooms | 34 (39.1%) | 2 (50.0%) |
| 8 or more Rooms | 28 (32.2%) | 0 (0.0%) |
| Total | 87 (100.0%) | 4 (100.0%) |
Housing Structure by Heating Type in Fort Peck
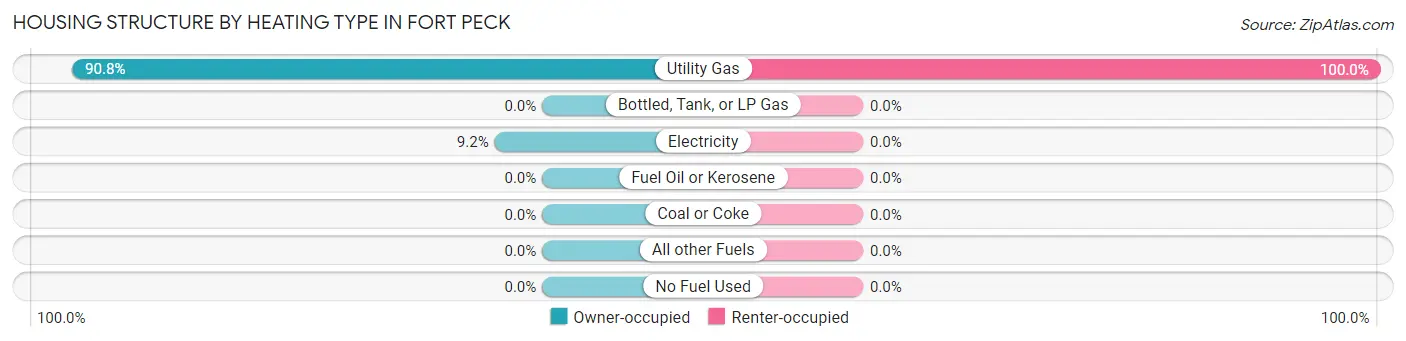
| Heating Type | Owner-occupied | Renter-occupied |
| Utility Gas | 79 (90.8%) | 4 (100.0%) |
| Bottled, Tank, or LP Gas | 0 (0.0%) | 0 (0.0%) |
| Electricity | 8 (9.2%) | 0 (0.0%) |
| Fuel Oil or Kerosene | 0 (0.0%) | 0 (0.0%) |
| Coal or Coke | 0 (0.0%) | 0 (0.0%) |
| All other Fuels | 0 (0.0%) | 0 (0.0%) |
| No Fuel Used | 0 (0.0%) | 0 (0.0%) |
| Total | 87 (100.0%) | 4 (100.0%) |
Household Vehicle Usage in Fort Peck
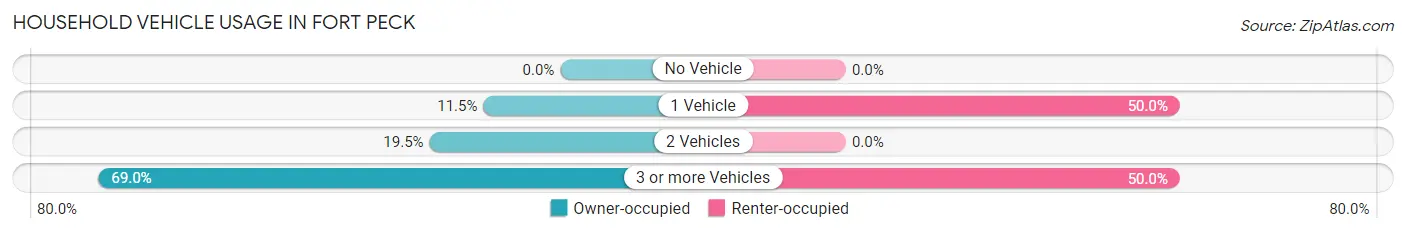
| Vehicles per Household | Owner-occupied | Renter-occupied |
| No Vehicle | 0 (0.0%) | 0 (0.0%) |
| 1 Vehicle | 10 (11.5%) | 2 (50.0%) |
| 2 Vehicles | 17 (19.5%) | 0 (0.0%) |
| 3 or more Vehicles | 60 (69.0%) | 2 (50.0%) |
| Total | 87 (100.0%) | 4 (100.0%) |
Real Estate & Mortgages in Fort Peck
Real Estate and Mortgage Overview in Fort Peck
| Characteristic | Without Mortgage | With Mortgage |
| Housing Units | 41 | 46 |
| Median Property Value | $260,700 | $242,500 |
| Median Household Income | $78,125 | $14 |
| Monthly Housing Costs | $655 | $0 |
| Real Estate Taxes | $2,107 | $0 |
Property Value by Mortgage Status in Fort Peck
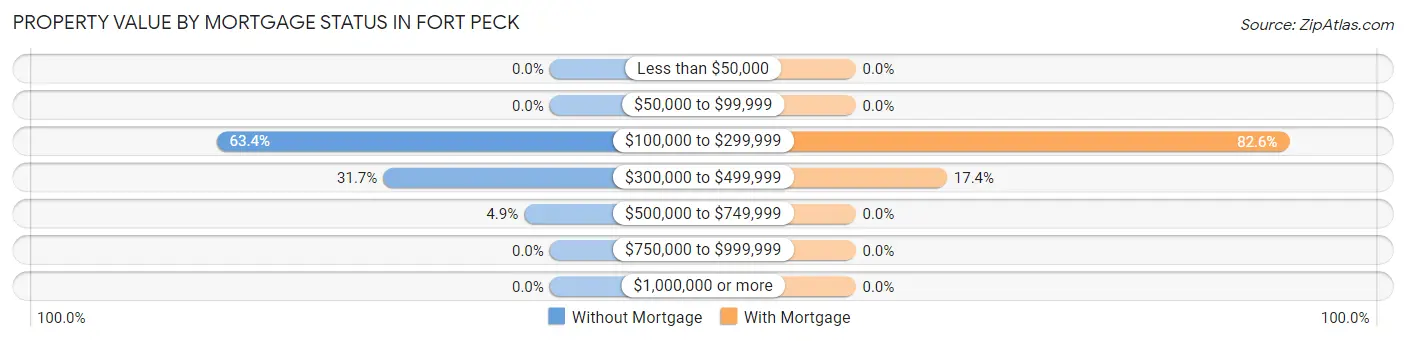
| Property Value | Without Mortgage | With Mortgage |
| Less than $50,000 | 0 (0.0%) | 0 (0.0%) |
| $50,000 to $99,999 | 0 (0.0%) | 0 (0.0%) |
| $100,000 to $299,999 | 26 (63.4%) | 38 (82.6%) |
| $300,000 to $499,999 | 13 (31.7%) | 8 (17.4%) |
| $500,000 to $749,999 | 2 (4.9%) | 0 (0.0%) |
| $750,000 to $999,999 | 0 (0.0%) | 0 (0.0%) |
| $1,000,000 or more | 0 (0.0%) | 0 (0.0%) |
| Total | 41 (100.0%) | 46 (100.0%) |
Household Income by Mortgage Status in Fort Peck
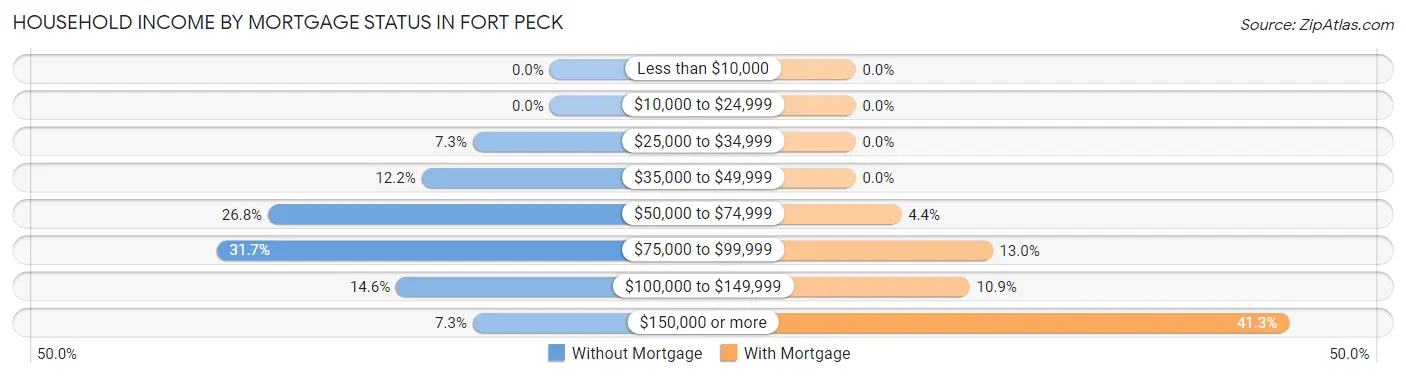
| Household Income | Without Mortgage | With Mortgage |
| Less than $10,000 | 0 (0.0%) | 0 (0.0%) |
| $10,000 to $24,999 | 0 (0.0%) | 0 (0.0%) |
| $25,000 to $34,999 | 3 (7.3%) | 0 (0.0%) |
| $35,000 to $49,999 | 5 (12.2%) | 0 (0.0%) |
| $50,000 to $74,999 | 11 (26.8%) | 2 (4.3%) |
| $75,000 to $99,999 | 13 (31.7%) | 6 (13.0%) |
| $100,000 to $149,999 | 6 (14.6%) | 5 (10.9%) |
| $150,000 or more | 3 (7.3%) | 19 (41.3%) |
| Total | 41 (100.0%) | 46 (100.0%) |
Property Value to Household Income Ratio in Fort Peck
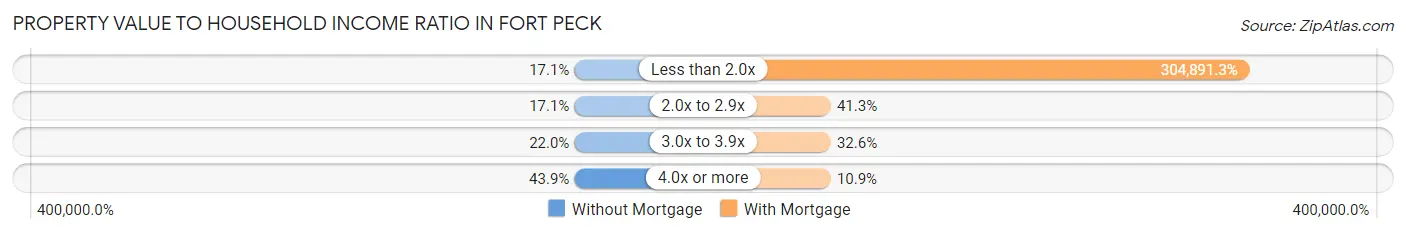
| Value-to-Income Ratio | Without Mortgage | With Mortgage |
| Less than 2.0x | 7 (17.1%) | 140,250 (304,891.3%) |
| 2.0x to 2.9x | 7 (17.1%) | 19 (41.3%) |
| 3.0x to 3.9x | 9 (22.0%) | 15 (32.6%) |
| 4.0x or more | 18 (43.9%) | 5 (10.9%) |
| Total | 41 (100.0%) | 46 (100.0%) |
Real Estate Taxes by Mortgage Status in Fort Peck
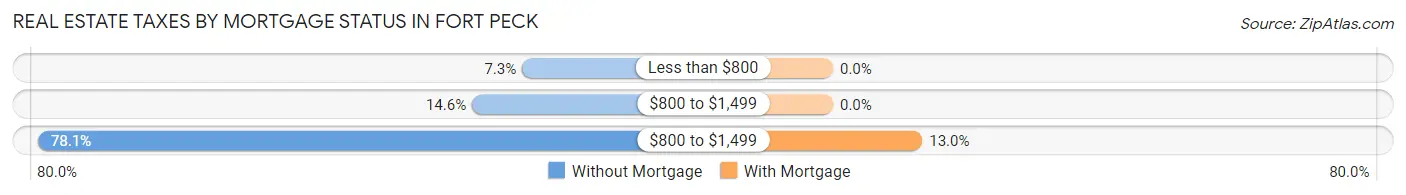
| Property Taxes | Without Mortgage | With Mortgage |
| Less than $800 | 3 (7.3%) | 0 (0.0%) |
| $800 to $1,499 | 6 (14.6%) | 0 (0.0%) |
| $800 to $1,499 | 32 (78.0%) | 6 (13.0%) |
| Total | 41 (100.0%) | 46 (100.0%) |
Health & Disability in Fort Peck
Health Insurance Coverage by Age in Fort Peck
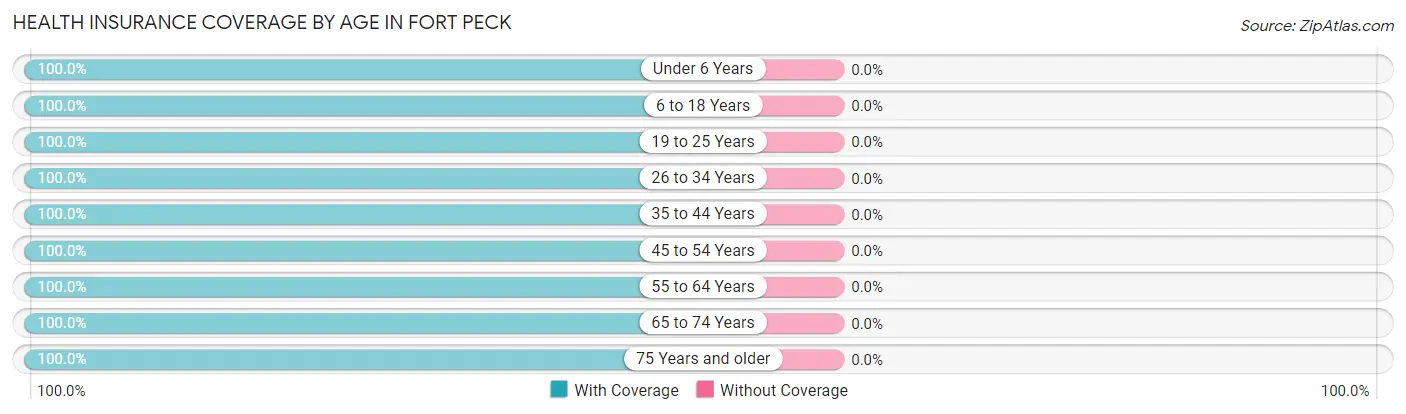
| Age Bracket | With Coverage | Without Coverage |
| Under 6 Years | 4 (100.0%) | 0 (0.0%) |
| 6 to 18 Years | 41 (100.0%) | 0 (0.0%) |
| 19 to 25 Years | 7 (100.0%) | 0 (0.0%) |
| 26 to 34 Years | 9 (100.0%) | 0 (0.0%) |
| 35 to 44 Years | 16 (100.0%) | 0 (0.0%) |
| 45 to 54 Years | 35 (100.0%) | 0 (0.0%) |
| 55 to 64 Years | 25 (100.0%) | 0 (0.0%) |
| 65 to 74 Years | 43 (100.0%) | 0 (0.0%) |
| 75 Years and older | 20 (100.0%) | 0 (0.0%) |
| Total | 200 (100.0%) | 0 (0.0%) |
Health Insurance Coverage by Citizenship Status in Fort Peck
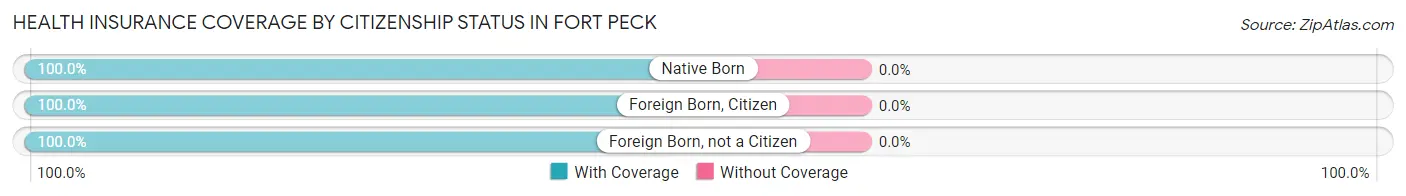
| Citizenship Status | With Coverage | Without Coverage |
| Native Born | 4 (100.0%) | 0 (0.0%) |
| Foreign Born, Citizen | 41 (100.0%) | 0 (0.0%) |
| Foreign Born, not a Citizen | 7 (100.0%) | 0 (0.0%) |
Health Insurance Coverage by Household Income in Fort Peck
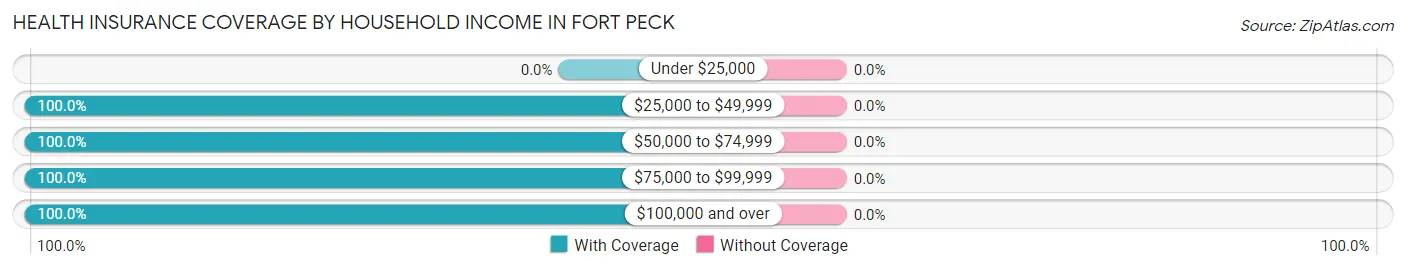
| Household Income | With Coverage | Without Coverage |
| Under $25,000 | 0 (0.0%) | 0 (0.0%) |
| $25,000 to $49,999 | 11 (100.0%) | 0 (0.0%) |
| $50,000 to $74,999 | 40 (100.0%) | 0 (0.0%) |
| $75,000 to $99,999 | 47 (100.0%) | 0 (0.0%) |
| $100,000 and over | 102 (100.0%) | 0 (0.0%) |
Public vs Private Health Insurance Coverage by Age in Fort Peck
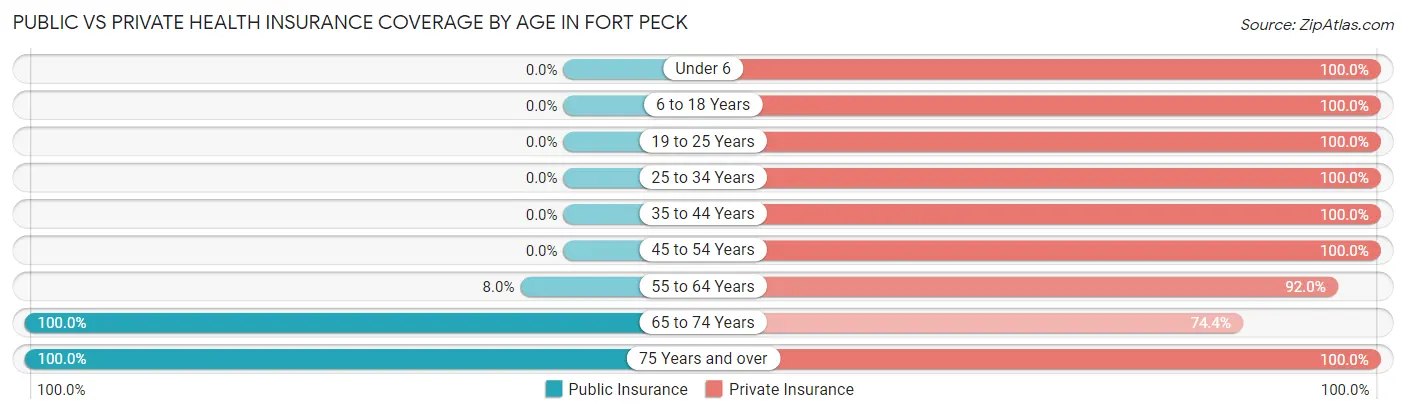
| Age Bracket | Public Insurance | Private Insurance |
| Under 6 | 0 (0.0%) | 4 (100.0%) |
| 6 to 18 Years | 0 (0.0%) | 41 (100.0%) |
| 19 to 25 Years | 0 (0.0%) | 7 (100.0%) |
| 25 to 34 Years | 0 (0.0%) | 9 (100.0%) |
| 35 to 44 Years | 0 (0.0%) | 16 (100.0%) |
| 45 to 54 Years | 0 (0.0%) | 35 (100.0%) |
| 55 to 64 Years | 2 (8.0%) | 23 (92.0%) |
| 65 to 74 Years | 43 (100.0%) | 32 (74.4%) |
| 75 Years and over | 20 (100.0%) | 20 (100.0%) |
| Total | 65 (32.5%) | 187 (93.5%) |
Disability Status by Sex by Age in Fort Peck
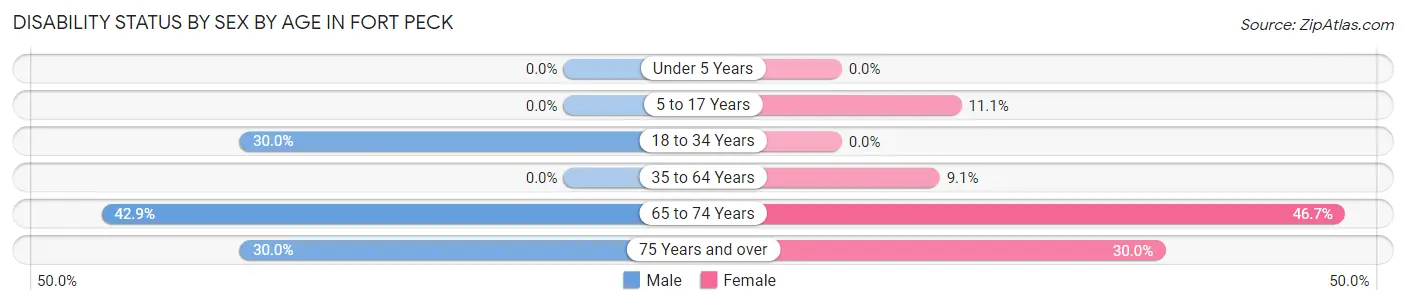
| Age Bracket | Male | Female |
| Under 5 Years | 0 (0.0%) | 0 (0.0%) |
| 5 to 17 Years | 0 (0.0%) | 2 (11.1%) |
| 18 to 34 Years | 3 (30.0%) | 0 (0.0%) |
| 35 to 64 Years | 0 (0.0%) | 3 (9.1%) |
| 65 to 74 Years | 12 (42.9%) | 7 (46.7%) |
| 75 Years and over | 3 (30.0%) | 3 (30.0%) |
Disability Class by Sex by Age in Fort Peck
Disability Class: Hearing Difficulty
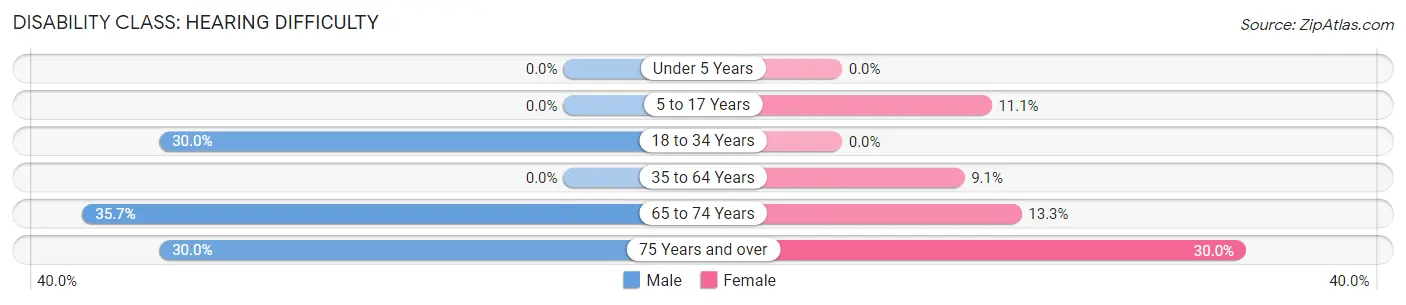
| Age Bracket | Male | Female |
| Under 5 Years | 0 (0.0%) | 0 (0.0%) |
| 5 to 17 Years | 0 (0.0%) | 2 (11.1%) |
| 18 to 34 Years | 3 (30.0%) | 0 (0.0%) |
| 35 to 64 Years | 0 (0.0%) | 3 (9.1%) |
| 65 to 74 Years | 10 (35.7%) | 2 (13.3%) |
| 75 Years and over | 3 (30.0%) | 3 (30.0%) |
Disability Class: Vision Difficulty
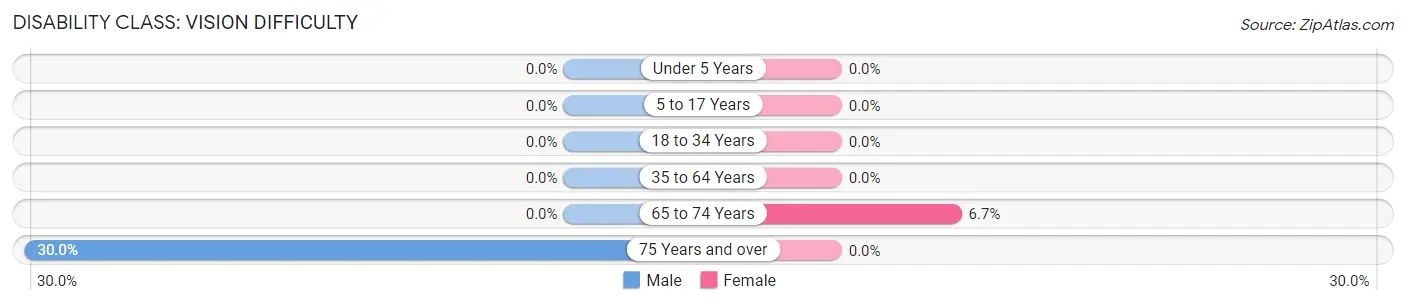
| Age Bracket | Male | Female |
| Under 5 Years | 0 (0.0%) | 0 (0.0%) |
| 5 to 17 Years | 0 (0.0%) | 0 (0.0%) |
| 18 to 34 Years | 0 (0.0%) | 0 (0.0%) |
| 35 to 64 Years | 0 (0.0%) | 0 (0.0%) |
| 65 to 74 Years | 0 (0.0%) | 1 (6.7%) |
| 75 Years and over | 3 (30.0%) | 0 (0.0%) |
Disability Class: Cognitive Difficulty
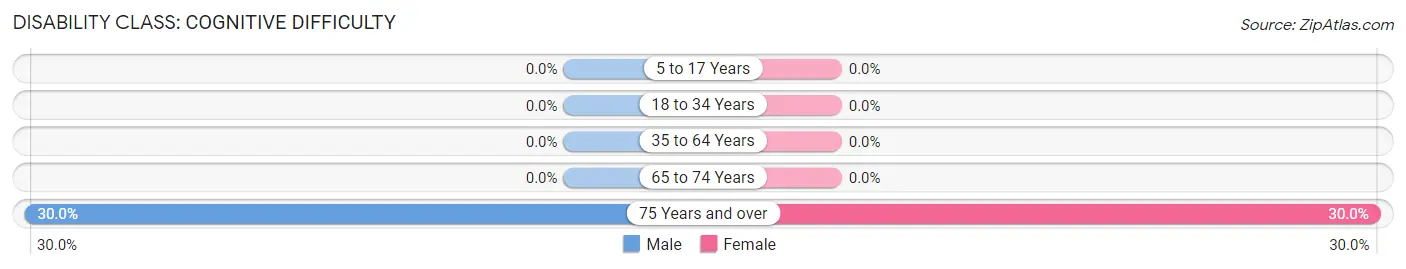
| Age Bracket | Male | Female |
| 5 to 17 Years | 0 (0.0%) | 0 (0.0%) |
| 18 to 34 Years | 0 (0.0%) | 0 (0.0%) |
| 35 to 64 Years | 0 (0.0%) | 0 (0.0%) |
| 65 to 74 Years | 0 (0.0%) | 0 (0.0%) |
| 75 Years and over | 3 (30.0%) | 3 (30.0%) |
Disability Class: Ambulatory Difficulty
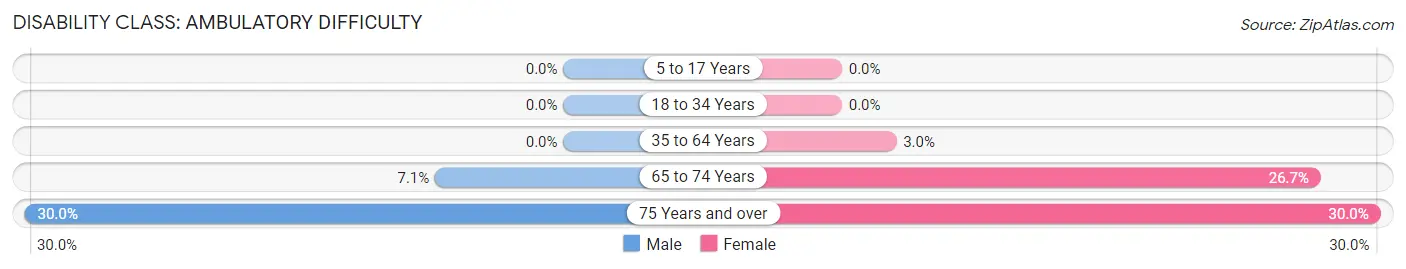
| Age Bracket | Male | Female |
| 5 to 17 Years | 0 (0.0%) | 0 (0.0%) |
| 18 to 34 Years | 0 (0.0%) | 0 (0.0%) |
| 35 to 64 Years | 0 (0.0%) | 1 (3.0%) |
| 65 to 74 Years | 2 (7.1%) | 4 (26.7%) |
| 75 Years and over | 3 (30.0%) | 3 (30.0%) |
Disability Class: Self-Care Difficulty
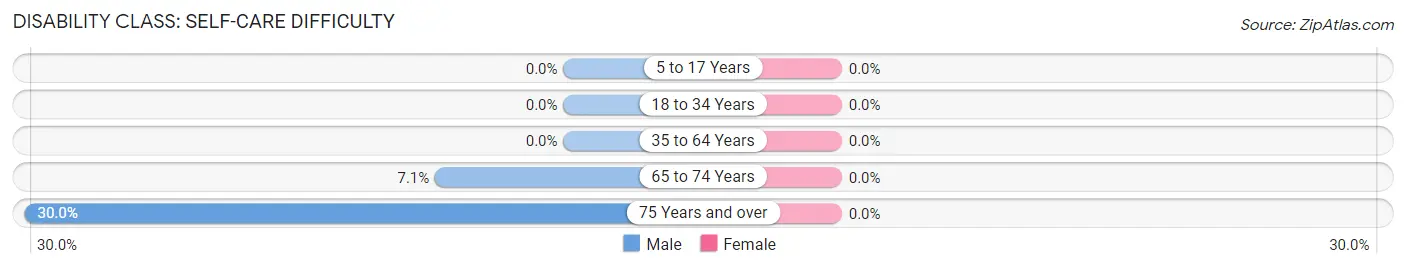
| Age Bracket | Male | Female |
| 5 to 17 Years | 0 (0.0%) | 0 (0.0%) |
| 18 to 34 Years | 0 (0.0%) | 0 (0.0%) |
| 35 to 64 Years | 0 (0.0%) | 0 (0.0%) |
| 65 to 74 Years | 2 (7.1%) | 0 (0.0%) |
| 75 Years and over | 3 (30.0%) | 0 (0.0%) |
Technology Access in Fort Peck
Computing Device Access in Fort Peck
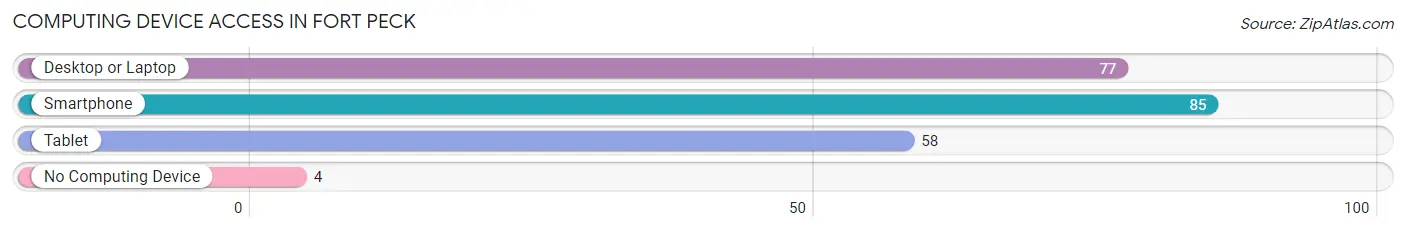
| Device Type | # Households | % Households |
| Desktop or Laptop | 77 | 84.6% |
| Smartphone | 85 | 93.4% |
| Tablet | 58 | 63.7% |
| No Computing Device | 4 | 4.4% |
| Total | 91 | 100.0% |
Internet Access in Fort Peck
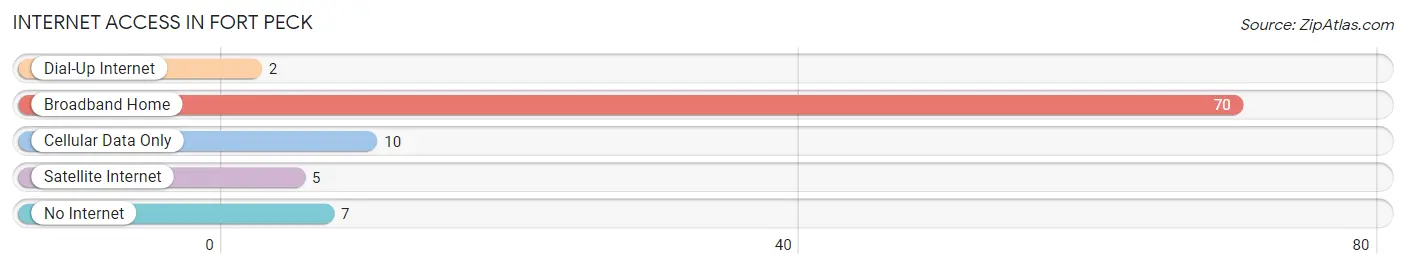
| Internet Type | # Households | % Households |
| Dial-Up Internet | 2 | 2.2% |
| Broadband Home | 70 | 76.9% |
| Cellular Data Only | 10 | 11.0% |
| Satellite Internet | 5 | 5.5% |
| No Internet | 7 | 7.7% |
| Total | 91 | 100.0% |
Fort Peck Summary
History
The Fort Peck Indian Reservation is located in northeastern Montana and is home to the Assiniboine and Sioux Tribes. The reservation was established in 1868 by the Fort Laramie Treaty of 1868, which was signed by the United States and the Sioux and Assiniboine Tribes. The treaty was intended to provide the tribes with a permanent home and to protect them from further encroachment by settlers. The reservation was originally much larger than it is today, encompassing over 10 million acres of land. However, over the years, the reservation has been reduced in size due to various land cessions and allotments.
The Fort Peck Indian Reservation is named after the fort that was built in 1867 by the United States Army. The fort was built to protect the tribes from further encroachment by settlers and to provide a base of operations for the army. The fort was abandoned in 1877 and the reservation was established shortly thereafter.
The reservation has a long and complex history. In the late 1800s, the tribes were forced to move to the reservation and were subjected to a number of oppressive policies. These policies included the forced relocation of the tribes to the reservation, the forced assimilation of the tribes into white society, and the forced removal of children from their families and placement in boarding schools.
The tribes were also subjected to a number of economic policies that were designed to benefit the white settlers. These policies included the leasing of tribal lands to white settlers, the sale of tribal lands to white settlers, and the exploitation of tribal resources.
The tribes have also experienced a number of social and political struggles over the years. In the early 1900s, the tribes fought for the right to vote and for the right to self-governance. In the 1970s, the tribes fought for the return of their sacred lands and for the protection of their cultural and religious practices.
Today, the Fort Peck Indian Reservation is home to over 10,000 members of the Assiniboine and Sioux Tribes. The reservation is governed by the Fort Peck Tribal Executive Board, which is composed of elected representatives from each of the tribes. The tribes are also represented in the Montana state legislature.
Geography
The Fort Peck Indian Reservation is located in northeastern Montana and covers an area of approximately 2,200 square miles. The reservation is bordered by the Missouri River to the east, the Milk River to the south, and the Fort Peck Reservoir to the west. The reservation is located in the Missouri River Valley, which is characterized by rolling hills, grasslands, and wooded areas.
The climate of the reservation is semi-arid, with hot summers and cold winters. The average annual precipitation is approximately 15 inches, with most of the precipitation occurring in the spring and summer months.
Economy
The economy of the Fort Peck Indian Reservation is largely based on agriculture, tourism, and natural resource extraction. Agriculture is the primary economic activity on the reservation, with the majority of the land being used for cattle ranching and farming. Tourism is also an important part of the economy, with visitors coming to the reservation to take part in hunting, fishing, and other outdoor activities.
The reservation is also home to a number of natural resource extraction operations, including oil and gas drilling, coal mining, and timber harvesting. These operations provide employment opportunities for members of the tribes, as well as revenue for the tribal government.
Demographics
As of the 2010 census, the population of the Fort Peck Indian Reservation was 10,876. The population is composed of members of the Assiniboine and Sioux Tribes, as well as non-Native Americans. The majority of the population is Native American, with approximately 90% of the population identifying as such.
The median household income on the reservation is $30,000, which is significantly lower than the median household income for the state of Montana. The unemployment rate on the reservation is also higher than the state average, with approximately 20% of the population being unemployed.
The majority of the population is under the age of 18, with approximately 40% of the population being under the age of 18. The majority of the population is also under the age of 65, with approximately 30% of the population being under the age of 65.
Common Questions
What is Per Capita Income in Fort Peck?
Per Capita income in Fort Peck is $49,480.
What is the Median Family Income in Fort Peck?
Median Family Income in Fort Peck is $100,938.
What is the Median Household income in Fort Peck?
Median Household Income in Fort Peck is $84,375.
What is Income or Wage Gap in Fort Peck?
Income or Wage Gap in Fort Peck is 40.3%.
Women in Fort Peck earn 59.7 cents for every dollar earned by a man.
What is Inequality or Gini Index in Fort Peck?
Inequality or Gini Index in Fort Peck is 0.27.
What is the Total Population of Fort Peck?
Total Population of Fort Peck is 200.
What is the Total Male Population of Fort Peck?
Total Male Population of Fort Peck is 116.
What is the Total Female Population of Fort Peck?
Total Female Population of Fort Peck is 84.
What is the Ratio of Males per 100 Females in Fort Peck?
There are 138.10 Males per 100 Females in Fort Peck.
What is the Ratio of Females per 100 Males in Fort Peck?
There are 72.41 Females per 100 Males in Fort Peck.
What is the Median Population Age in Fort Peck?
Median Population Age in Fort Peck is 51.2 Years.
What is the Average Family Size in Fort Peck
Average Family Size in Fort Peck is 2.7 People.
What is the Average Household Size in Fort Peck
Average Household Size in Fort Peck is 2.2 People.
How Large is the Labor Force in Fort Peck?
There are 111 People in the Labor Forcein in Fort Peck.
What is the Percentage of People in the Labor Force in Fort Peck?
64.9% of People are in the Labor Force in Fort Peck.