Missoula, MT Map & Demographics
Missoula Map
Missoula Overview
$39,374
PER CAPITA INCOME
$87,915
AVG FAMILY INCOME
$59,783
AVG HOUSEHOLD INCOME
11.9%
WAGE / INCOME GAP [ % ]
88.1¢/ $1
WAGE / INCOME GAP [ $ ]
$9,346
FAMILY INCOME DEFICIT
0.48
INEQUALITY / GINI INDEX
74,627
TOTAL POPULATION
36,687
MALE POPULATION
37,940
FEMALE POPULATION
96.70
MALES / 100 FEMALES
103.42
FEMALES / 100 MALES
34.0
MEDIAN AGE
2.9
AVG FAMILY SIZE
2.2
AVG HOUSEHOLD SIZE
46,291
LABOR FORCE [ PEOPLE ]
73.2%
PERCENT IN LABOR FORCE
4.6%
UNEMPLOYMENT RATE
Missoula Area Codes
Income in Missoula
Income Overview in Missoula
Per Capita Income in Missoula is $39,374, while median incomes of families and households are $87,915 and $59,783 respectively.
| Characteristic | Number | Measure |
| Per Capita Income | 74,627 | $39,374 |
| Median Family Income | 15,456 | $87,915 |
| Mean Family Income | 15,456 | $115,373 |
| Median Household Income | 32,944 | $59,783 |
| Mean Household Income | 32,944 | $87,064 |
| Income Deficit | 15,456 | $9,346 |
| Wage / Income Gap (%) | 74,627 | 11.95% |
| Wage / Income Gap ($) | 74,627 | 88.05¢ per $1 |
| Gini / Inequality Index | 74,627 | 0.48 |
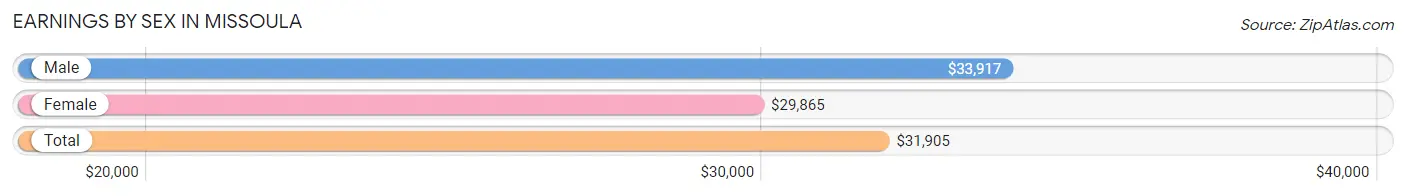
Earnings by Sex in Missoula
Average Earnings in Missoula are $31,905, $33,917 for men and $29,865 for women, a difference of 11.9%.
| Sex | Number | Average Earnings |
| Male | 24,745 (50.2%) | $33,917 |
| Female | 24,523 (49.8%) | $29,865 |
| Total | 49,268 (100.0%) | $31,905 |
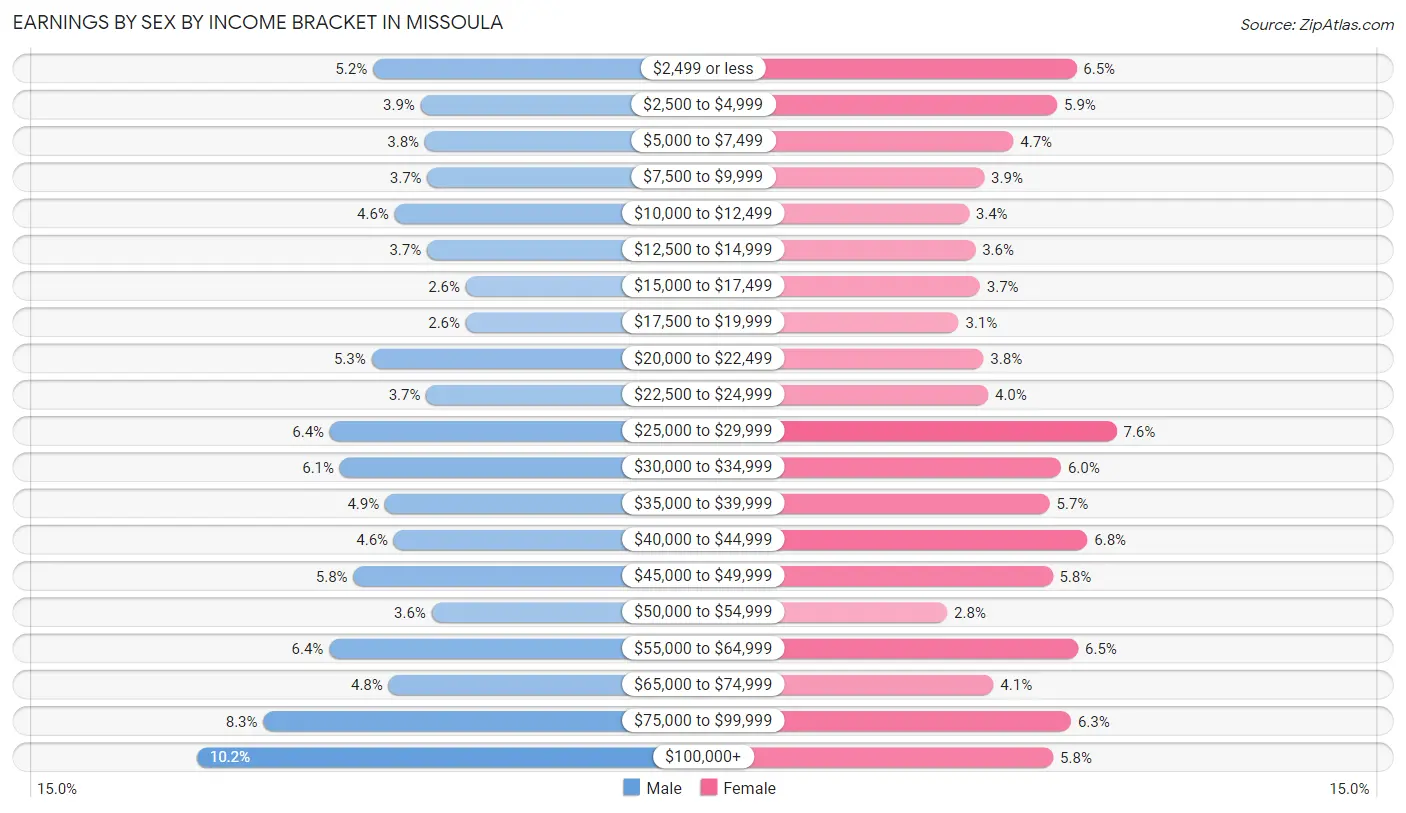
Earnings by Sex by Income Bracket in Missoula
The most common earnings brackets in Missoula are $100,000+ for men (2,514 | 10.2%) and $25,000 to $29,999 for women (1,859 | 7.6%).
| Income | Male | Female |
| $2,499 or less | 1,289 (5.2%) | 1,581 (6.5%) |
| $2,500 to $4,999 | 958 (3.9%) | 1,450 (5.9%) |
| $5,000 to $7,499 | 927 (3.7%) | 1,147 (4.7%) |
| $7,500 to $9,999 | 911 (3.7%) | 946 (3.9%) |
| $10,000 to $12,499 | 1,138 (4.6%) | 841 (3.4%) |
| $12,500 to $14,999 | 913 (3.7%) | 885 (3.6%) |
| $15,000 to $17,499 | 644 (2.6%) | 916 (3.7%) |
| $17,500 to $19,999 | 643 (2.6%) | 770 (3.1%) |
| $20,000 to $22,499 | 1,299 (5.2%) | 941 (3.8%) |
| $22,500 to $24,999 | 918 (3.7%) | 973 (4.0%) |
| $25,000 to $29,999 | 1,589 (6.4%) | 1,859 (7.6%) |
| $30,000 to $34,999 | 1,520 (6.1%) | 1,477 (6.0%) |
| $35,000 to $39,999 | 1,205 (4.9%) | 1,398 (5.7%) |
| $40,000 to $44,999 | 1,143 (4.6%) | 1,658 (6.8%) |
| $45,000 to $49,999 | 1,426 (5.8%) | 1,417 (5.8%) |
| $50,000 to $54,999 | 882 (3.6%) | 691 (2.8%) |
| $55,000 to $64,999 | 1,594 (6.4%) | 1,594 (6.5%) |
| $65,000 to $74,999 | 1,181 (4.8%) | 1,011 (4.1%) |
| $75,000 to $99,999 | 2,051 (8.3%) | 1,546 (6.3%) |
| $100,000+ | 2,514 (10.2%) | 1,422 (5.8%) |
| Total | 24,745 (100.0%) | 24,523 (100.0%) |
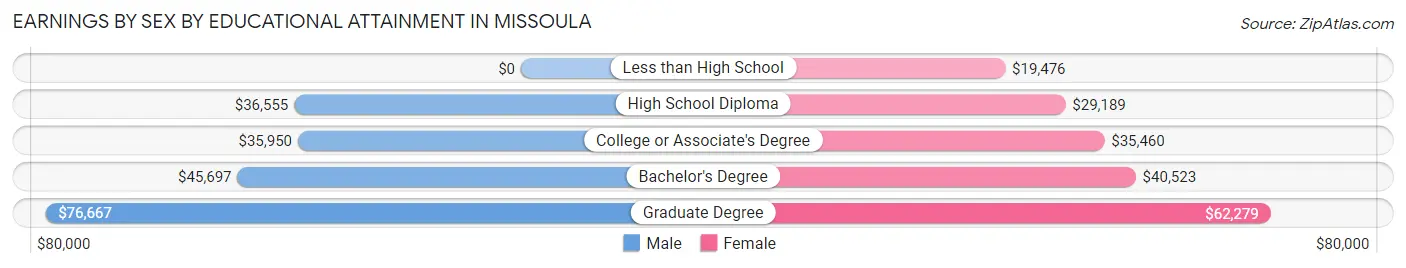
Earnings by Sex by Educational Attainment in Missoula
Average earnings in Missoula are $44,500 for men and $40,094 for women, a difference of 9.9%. Men with an educational attainment of graduate degree enjoy the highest average annual earnings of $76,667, while those with college or associate's degree education earn the least with $35,950. Women with an educational attainment of graduate degree earn the most with the average annual earnings of $62,279, while those with less than high school education have the smallest earnings of $19,476.
| Educational Attainment | Male Income | Female Income |
| Less than High School | - | - |
| High School Diploma | $36,555 | $29,189 |
| College or Associate's Degree | $35,950 | $35,460 |
| Bachelor's Degree | $45,697 | $40,523 |
| Graduate Degree | $76,667 | $62,279 |
| Total | $44,500 | $40,094 |
Family Income in Missoula
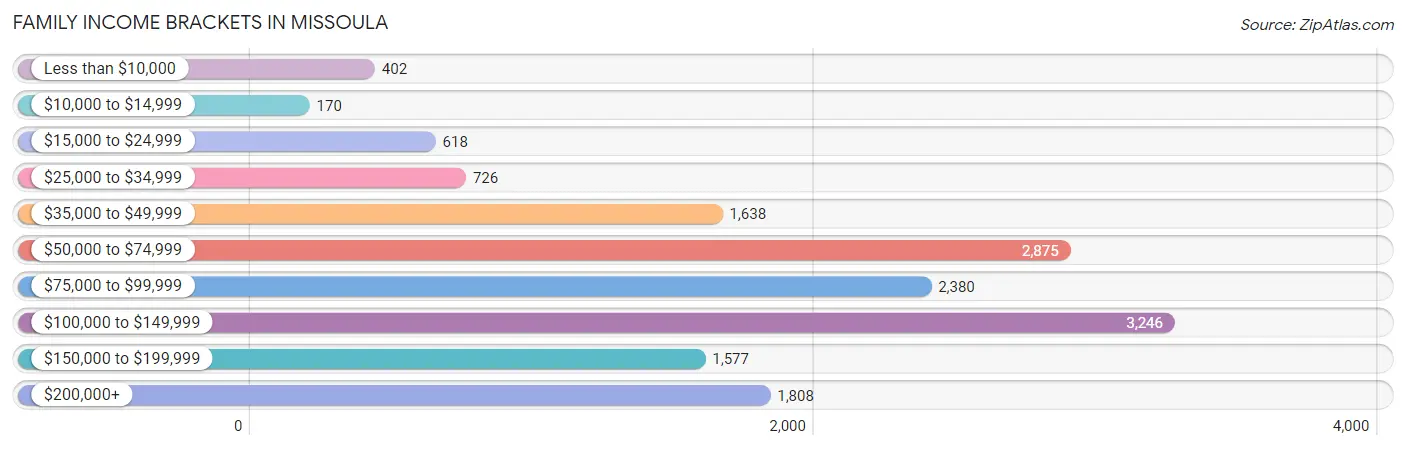
Family Income Brackets in Missoula
According to the Missoula family income data, there are 3,246 families falling into the $100,000 to $149,999 income range, which is the most common income bracket and makes up 21.0% of all families. Conversely, the $10,000 to $14,999 income bracket is the least frequent group with only 170 families (1.1%) belonging to this category.
| Income Bracket | # Families | % Families |
| Less than $10,000 | 402 | 2.6% |
| $10,000 to $14,999 | 170 | 1.1% |
| $15,000 to $24,999 | 618 | 4.0% |
| $25,000 to $34,999 | 726 | 4.7% |
| $35,000 to $49,999 | 1,638 | 10.6% |
| $50,000 to $74,999 | 2,875 | 18.6% |
| $75,000 to $99,999 | 2,380 | 15.4% |
| $100,000 to $149,999 | 3,246 | 21.0% |
| $150,000 to $199,999 | 1,577 | 10.2% |
| $200,000+ | 1,808 | 11.7% |
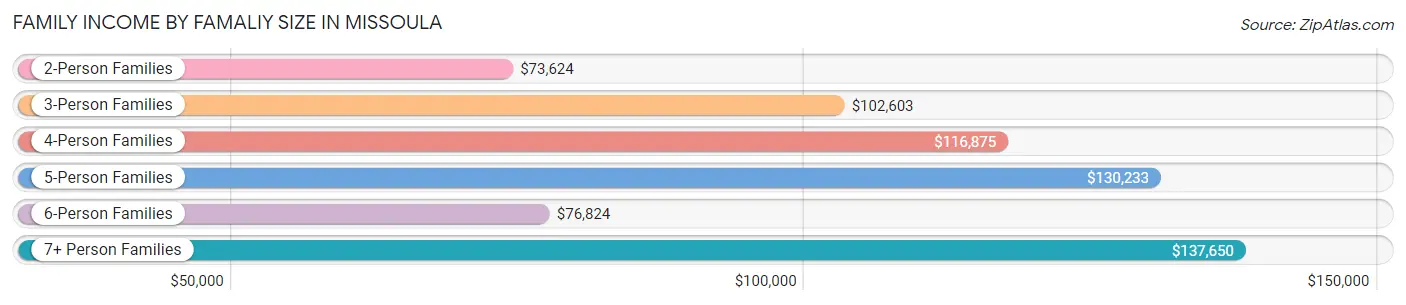
Family Income by Famaliy Size in Missoula
7+ person families (67 | 0.4%) account for the highest median family income in Missoula with $137,650 per family, while 2-person families (7,971 | 51.6%) have the highest median income of $36,812 per family member.
| Income Bracket | # Families | Median Income |
| 2-Person Families | 7,971 (51.6%) | $73,624 |
| 3-Person Families | 3,808 (24.6%) | $102,603 |
| 4-Person Families | 2,704 (17.5%) | $116,875 |
| 5-Person Families | 678 (4.4%) | $130,233 |
| 6-Person Families | 228 (1.5%) | $76,824 |
| 7+ Person Families | 67 (0.4%) | $137,650 |
| Total | 15,456 (100.0%) | $87,915 |
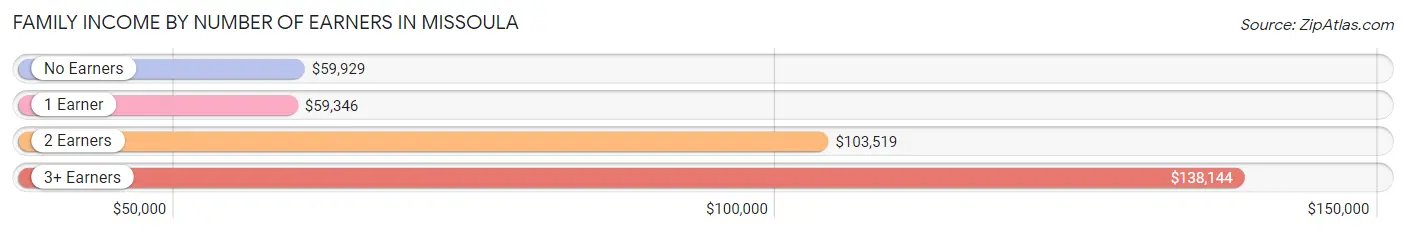
Family Income by Number of Earners in Missoula
The median family income in Missoula is $87,915, with families comprising 3+ earners (1,461) having the highest median family income of $138,144, while families with 1 earner (4,457) have the lowest median family income of $59,346, accounting for 9.5% and 28.8% of families, respectively.
| Number of Earners | # Families | Median Income |
| No Earners | 1,910 (12.4%) | $59,929 |
| 1 Earner | 4,457 (28.8%) | $59,346 |
| 2 Earners | 7,628 (49.3%) | $103,519 |
| 3+ Earners | 1,461 (9.5%) | $138,144 |
| Total | 15,456 (100.0%) | $87,915 |
Household Income in Missoula
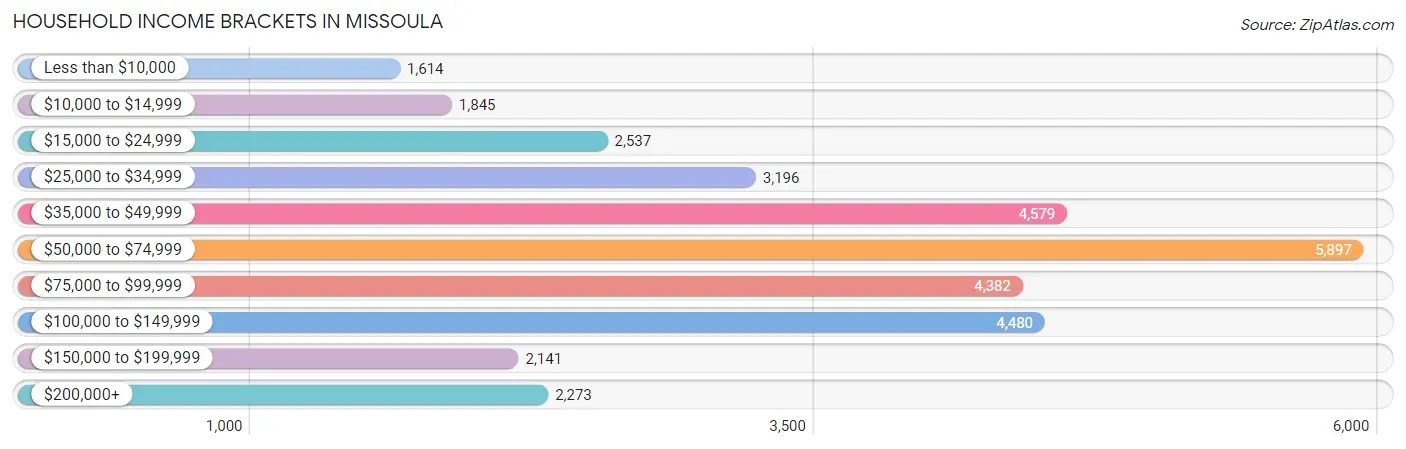
Household Income Brackets in Missoula
With 5,897 households falling in the category, the $50,000 to $74,999 income range is the most frequent in Missoula, accounting for 17.9% of all households. In contrast, only 1,614 households (4.9%) fall into the less than $10,000 income bracket, making it the least populous group.
| Income Bracket | # Households | % Households |
| Less than $10,000 | 1,614 | 4.9% |
| $10,000 to $14,999 | 1,845 | 5.6% |
| $15,000 to $24,999 | 2,537 | 7.7% |
| $25,000 to $34,999 | 3,196 | 9.7% |
| $35,000 to $49,999 | 4,579 | 13.9% |
| $50,000 to $74,999 | 5,897 | 17.9% |
| $75,000 to $99,999 | 4,382 | 13.3% |
| $100,000 to $149,999 | 4,480 | 13.6% |
| $150,000 to $199,999 | 2,141 | 6.5% |
| $200,000+ | 2,273 | 6.9% |
Household Income by Householder Age in Missoula
The median household income in Missoula is $59,783, with the highest median household income of $81,567 found in the 45 to 64 years age bracket for the primary householder. A total of 8,644 households (26.2%) fall into this category. Meanwhile, the 15 to 24 years age bracket for the primary householder has the lowest median household income of $31,665, with 4,160 households (12.6%) in this group.
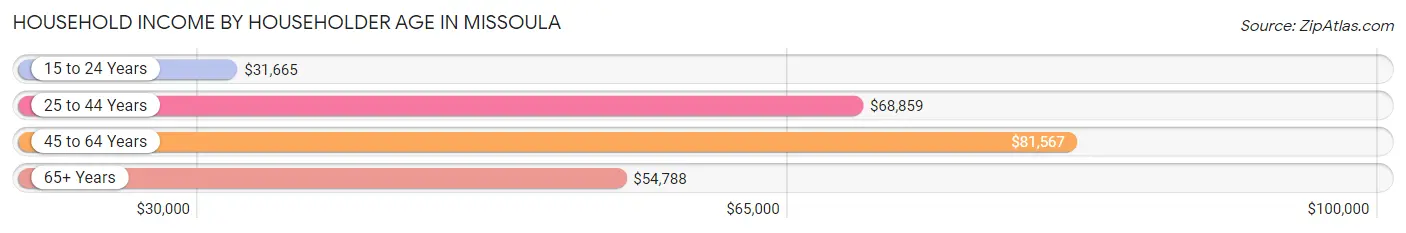
| Income Bracket | # Households | Median Income |
| 15 to 24 Years | 4,160 (12.6%) | $31,665 |
| 25 to 44 Years | 12,973 (39.4%) | $68,859 |
| 45 to 64 Years | 8,644 (26.2%) | $81,567 |
| 65+ Years | 7,167 (21.8%) | $54,788 |
| Total | 32,944 (100.0%) | $59,783 |
Poverty in Missoula
Income Below Poverty by Sex and Age in Missoula
With 14.4% poverty level for males and 14.8% for females among the residents of Missoula, 18 to 24 year old males and 18 to 24 year old females are the most vulnerable to poverty, with 1,968 males (36.0%) and 2,015 females (35.2%) in their respective age groups living below the poverty level.
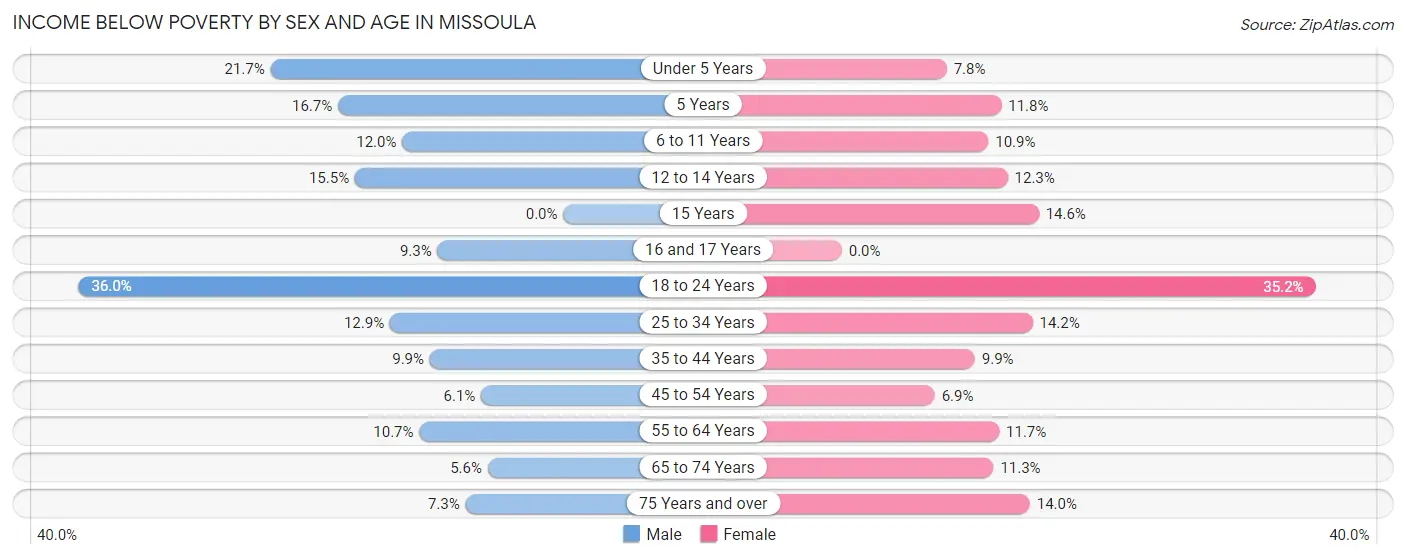
| Age Bracket | Male | Female |
| Under 5 Years | 318 (21.7%) | 121 (7.8%) |
| 5 Years | 45 (16.7%) | 38 (11.8%) |
| 6 to 11 Years | 287 (12.0%) | 228 (10.9%) |
| 12 to 14 Years | 200 (15.5%) | 124 (12.3%) |
| 15 Years | 0 (0.0%) | 68 (14.6%) |
| 16 and 17 Years | 51 (9.3%) | 0 (0.0%) |
| 18 to 24 Years | 1,968 (36.0%) | 2,015 (35.2%) |
| 25 to 34 Years | 866 (12.9%) | 916 (14.2%) |
| 35 to 44 Years | 509 (9.9%) | 513 (9.9%) |
| 45 to 54 Years | 243 (6.1%) | 261 (6.9%) |
| 55 to 64 Years | 337 (10.7%) | 445 (11.7%) |
| 65 to 74 Years | 182 (5.6%) | 386 (11.3%) |
| 75 Years and over | 112 (7.3%) | 290 (14.0%) |
| Total | 5,118 (14.4%) | 5,405 (14.8%) |
Income Above Poverty by Sex and Age in Missoula
According to the poverty statistics in Missoula, males aged 15 years and females aged 16 and 17 years are the age groups that are most secure financially, with 100.0% of males and 100.0% of females in these age groups living above the poverty line.
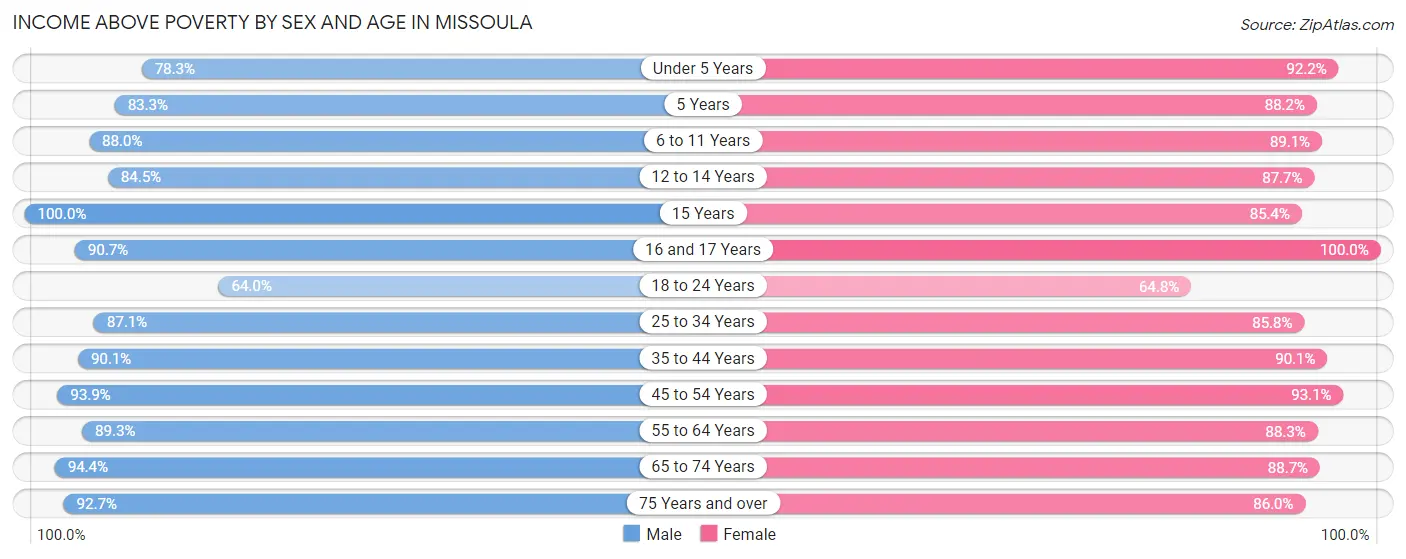
| Age Bracket | Male | Female |
| Under 5 Years | 1,145 (78.3%) | 1,432 (92.2%) |
| 5 Years | 224 (83.3%) | 283 (88.2%) |
| 6 to 11 Years | 2,113 (88.0%) | 1,868 (89.1%) |
| 12 to 14 Years | 1,093 (84.5%) | 883 (87.7%) |
| 15 Years | 344 (100.0%) | 397 (85.4%) |
| 16 and 17 Years | 495 (90.7%) | 685 (100.0%) |
| 18 to 24 Years | 3,499 (64.0%) | 3,716 (64.8%) |
| 25 to 34 Years | 5,865 (87.1%) | 5,551 (85.8%) |
| 35 to 44 Years | 4,626 (90.1%) | 4,681 (90.1%) |
| 45 to 54 Years | 3,740 (93.9%) | 3,523 (93.1%) |
| 55 to 64 Years | 2,815 (89.3%) | 3,366 (88.3%) |
| 65 to 74 Years | 3,064 (94.4%) | 3,043 (88.7%) |
| 75 Years and over | 1,430 (92.7%) | 1,788 (86.0%) |
| Total | 30,453 (85.6%) | 31,216 (85.2%) |
Income Below Poverty Among Married-Couple Families in Missoula
The poverty statistics for married-couple families in Missoula show that 2.7% or 311 of the total 11,408 families live below the poverty line. Families with no children have the highest poverty rate of 2.9%, comprising of 193 families. On the other hand, families with 5 or more children have the lowest poverty rate of 0.0%, which includes 0 families.
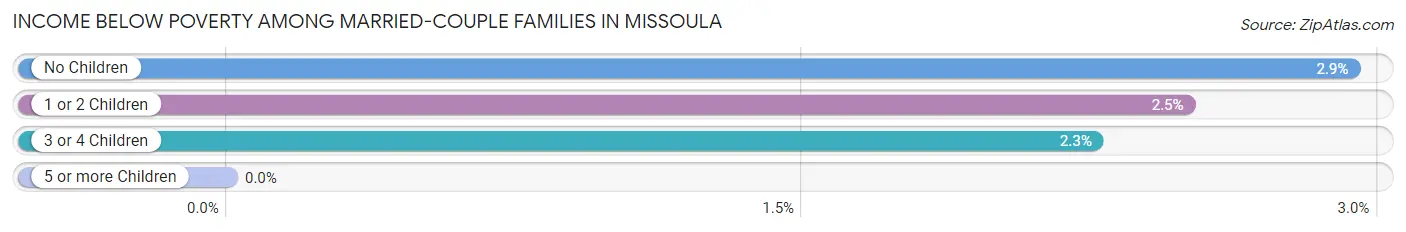
| Children | Above Poverty | Below Poverty |
| No Children | 6,383 (97.1%) | 193 (2.9%) |
| 1 or 2 Children | 4,023 (97.5%) | 103 (2.5%) |
| 3 or 4 Children | 649 (97.7%) | 15 (2.3%) |
| 5 or more Children | 42 (100.0%) | 0 (0.0%) |
| Total | 11,097 (97.3%) | 311 (2.7%) |
Income Below Poverty Among Single-Parent Households in Missoula
According to the poverty data in Missoula, 14.4% or 177 single-father households and 22.4% or 630 single-mother households are living below the poverty line. Among single-father households, those with 3 or 4 children have the highest poverty rate, with 51 households (100.0%) experiencing poverty. Likewise, among single-mother households, those with 3 or 4 children have the highest poverty rate, with 81 households (45.8%) falling below the poverty line.
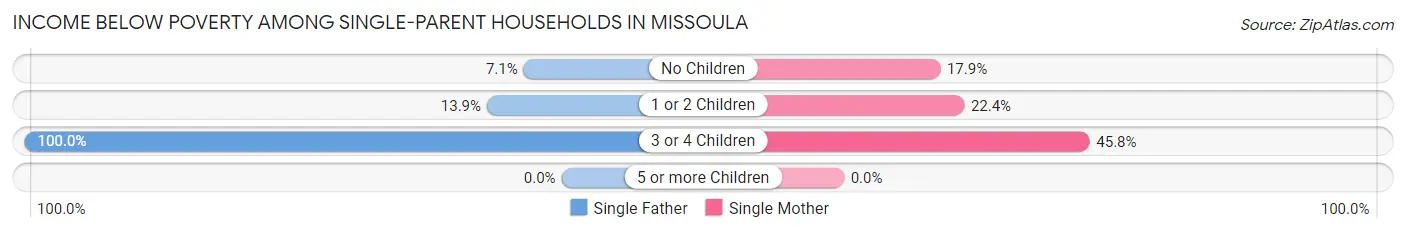
| Children | Single Father | Single Mother |
| No Children | 39 (7.1%) | 172 (17.9%) |
| 1 or 2 Children | 87 (13.9%) | 377 (22.4%) |
| 3 or 4 Children | 51 (100.0%) | 81 (45.8%) |
| 5 or more Children | 0 (0.0%) | 0 (0.0%) |
| Total | 177 (14.4%) | 630 (22.4%) |
Income Below Poverty Among Married-Couple vs Single-Parent Households in Missoula
The poverty data for Missoula shows that 311 of the married-couple family households (2.7%) and 807 of the single-parent households (19.9%) are living below the poverty level. Within the married-couple family households, those with no children have the highest poverty rate, with 193 households (2.9%) falling below the poverty line. Among the single-parent households, those with 3 or 4 children have the highest poverty rate, with 132 household (57.9%) living below poverty.
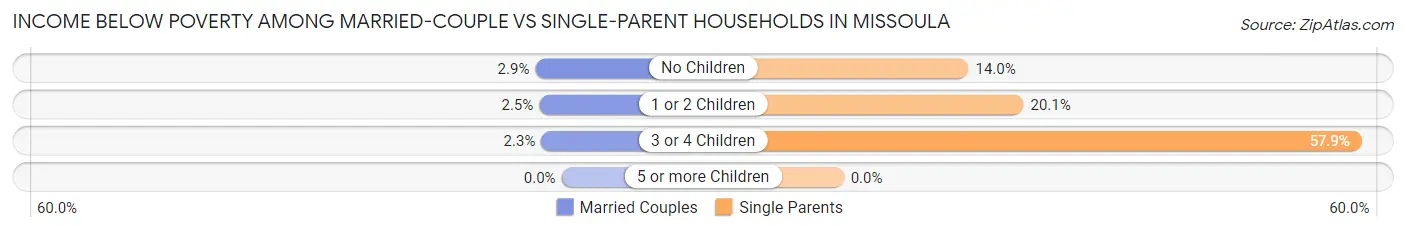
| Children | Married-Couple Families | Single-Parent Households |
| No Children | 193 (2.9%) | 211 (14.0%) |
| 1 or 2 Children | 103 (2.5%) | 464 (20.1%) |
| 3 or 4 Children | 15 (2.3%) | 132 (57.9%) |
| 5 or more Children | 0 (0.0%) | 0 (0.0%) |
| Total | 311 (2.7%) | 807 (19.9%) |
Race in Missoula
The most populous races in Missoula are White / Caucasian (65,594 | 87.9%), Two or more Races (4,734 | 6.3%), and Hispanic or Latino (3,337 | 4.5%).
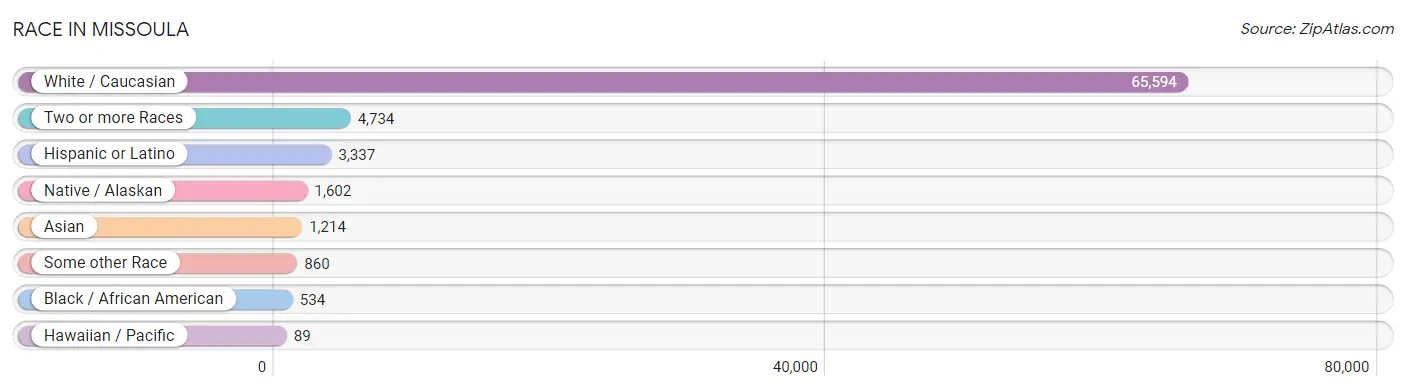
| Race | # Population | % Population |
| Asian | 1,214 | 1.6% |
| Black / African American | 534 | 0.7% |
| Hawaiian / Pacific | 89 | 0.1% |
| Hispanic or Latino | 3,337 | 4.5% |
| Native / Alaskan | 1,602 | 2.1% |
| White / Caucasian | 65,594 | 87.9% |
| Two or more Races | 4,734 | 6.3% |
| Some other Race | 860 | 1.1% |
| Total | 74,627 | 100.0% |
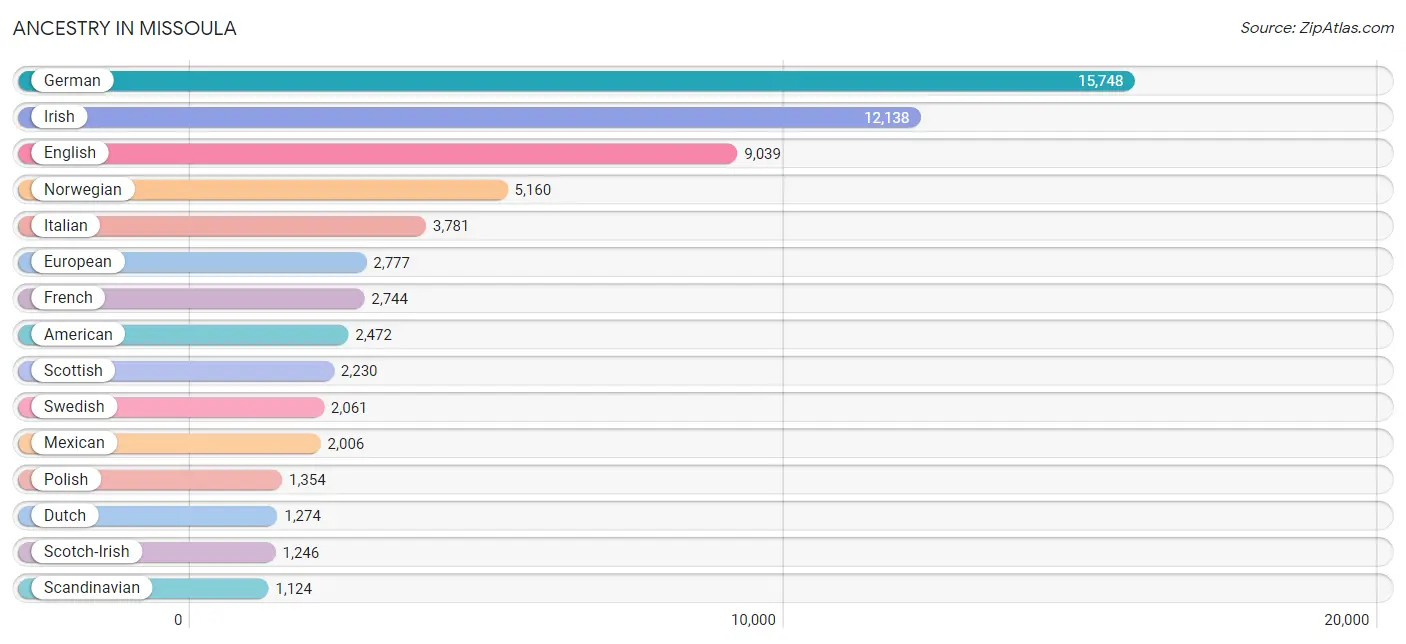
Ancestry in Missoula
The most populous ancestries reported in Missoula are German (15,748 | 21.1%), Irish (12,138 | 16.3%), English (9,039 | 12.1%), Norwegian (5,160 | 6.9%), and Italian (3,781 | 5.1%), together accounting for 61.4% of all Missoula residents.
| Ancestry | # Population | % Population |
| African | 78 | 0.1% |
| Albanian | 10 | 0.0% |
| Aleut | 33 | 0.0% |
| American | 2,472 | 3.3% |
| Apache | 16 | 0.0% |
| Arab | 162 | 0.2% |
| Argentinean | 26 | 0.0% |
| Armenian | 23 | 0.0% |
| Australian | 4 | 0.0% |
| Austrian | 218 | 0.3% |
| Barbadian | 31 | 0.0% |
| Basque | 43 | 0.1% |
| Belgian | 176 | 0.2% |
| Bermudan | 24 | 0.0% |
| Bhutanese | 306 | 0.4% |
| Blackfeet | 714 | 1.0% |
| British | 523 | 0.7% |
| Burmese | 143 | 0.2% |
| Cajun | 14 | 0.0% |
| Canadian | 176 | 0.2% |
| Central American | 81 | 0.1% |
| Cherokee | 77 | 0.1% |
| Cheyenne | 78 | 0.1% |
| Chickasaw | 18 | 0.0% |
| Chilean | 179 | 0.2% |
| Chippewa | 71 | 0.1% |
| Choctaw | 25 | 0.0% |
| Colombian | 165 | 0.2% |
| Colville | 21 | 0.0% |
| Comanche | 30 | 0.0% |
| Costa Rican | 17 | 0.0% |
| Cree | 91 | 0.1% |
| Creek | 26 | 0.0% |
| Croatian | 243 | 0.3% |
| Crow | 72 | 0.1% |
| Czech | 310 | 0.4% |
| Czechoslovakian | 34 | 0.1% |
| Danish | 546 | 0.7% |
| Dominican | 208 | 0.3% |
| Dutch | 1,274 | 1.7% |
| Eastern European | 148 | 0.2% |
| English | 9,039 | 12.1% |
| Ethiopian | 3 | 0.0% |
| European | 2,777 | 3.7% |
| Filipino | 59 | 0.1% |
| Finnish | 333 | 0.4% |
| French | 2,744 | 3.7% |
| French American Indian | 49 | 0.1% |
| French Canadian | 208 | 0.3% |
| German | 15,748 | 21.1% |
| Ghanaian | 13 | 0.0% |
| Greek | 177 | 0.2% |
| Guamanian / Chamorro | 3 | 0.0% |
| Guatemalan | 6 | 0.0% |
| Haitian | 25 | 0.0% |
| Hungarian | 361 | 0.5% |
| Icelander | 68 | 0.1% |
| Indian (Asian) | 488 | 0.6% |
| Inupiat | 70 | 0.1% |
| Iranian | 27 | 0.0% |
| Irish | 12,138 | 16.3% |
| Iroquois | 40 | 0.1% |
| Italian | 3,781 | 5.1% |
| Jamaican | 15 | 0.0% |
| Japanese | 1 | 0.0% |
| Kiowa | 17 | 0.0% |
| Korean | 782 | 1.1% |
| Latvian | 9 | 0.0% |
| Lebanese | 91 | 0.1% |
| Lithuanian | 44 | 0.1% |
| Luxembourger | 40 | 0.1% |
| Mexican | 2,006 | 2.7% |
| Mexican American Indian | 44 | 0.1% |
| Mongolian | 35 | 0.1% |
| Moroccan | 2 | 0.0% |
| Native Hawaiian | 137 | 0.2% |
| Navajo | 20 | 0.0% |
| New Zealander | 6 | 0.0% |
| Nicaraguan | 30 | 0.0% |
| Nigerian | 5 | 0.0% |
| Northern European | 280 | 0.4% |
| Norwegian | 5,160 | 6.9% |
| Pakistani | 52 | 0.1% |
| Palestinian | 9 | 0.0% |
| Panamanian | 11 | 0.0% |
| Pennsylvania German | 5 | 0.0% |
| Polish | 1,354 | 1.8% |
| Portuguese | 174 | 0.2% |
| Puerto Rican | 234 | 0.3% |
| Romanian | 40 | 0.1% |
| Russian | 578 | 0.8% |
| Salvadoran | 17 | 0.0% |
| Samoan | 45 | 0.1% |
| Scandinavian | 1,124 | 1.5% |
| Scotch-Irish | 1,246 | 1.7% |
| Scottish | 2,230 | 3.0% |
| Seminole | 9 | 0.0% |
| Serbian | 68 | 0.1% |
| Shoshone | 193 | 0.3% |
| Sioux | 119 | 0.2% |
| Slavic | 118 | 0.2% |
| Slovak | 49 | 0.1% |
| Slovene | 14 | 0.0% |
| South African | 30 | 0.0% |
| South American | 381 | 0.5% |
| Spaniard | 85 | 0.1% |
| Spanish | 298 | 0.4% |
| Sri Lankan | 100 | 0.1% |
| Subsaharan African | 133 | 0.2% |
| Swedish | 2,061 | 2.8% |
| Swiss | 298 | 0.4% |
| Thai | 39 | 0.1% |
| Tlingit-Haida | 68 | 0.1% |
| Ukrainian | 226 | 0.3% |
| Uruguayan | 11 | 0.0% |
| Ute | 18 | 0.0% |
| Welsh | 539 | 0.7% |
| Yugoslavian | 36 | 0.1% | View All 118 Rows |
Immigrants in Missoula
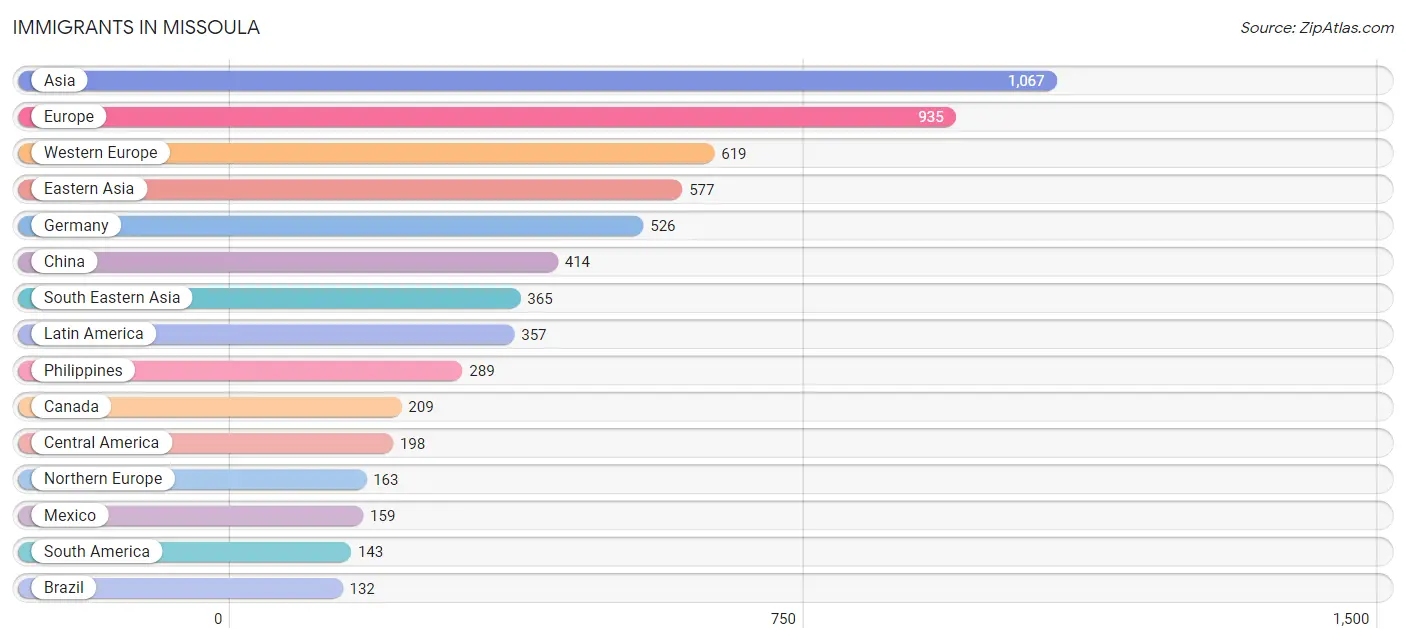
The most numerous immigrant groups reported in Missoula came from Asia (1,067 | 1.4%), Europe (935 | 1.3%), Western Europe (619 | 0.8%), Eastern Asia (577 | 0.8%), and Germany (526 | 0.7%), together accounting for 5.0% of all Missoula residents.
| Immigration Origin | # Population | % Population |
| Africa | 84 | 0.1% |
| Asia | 1,067 | 1.4% |
| Australia | 28 | 0.0% |
| Belarus | 64 | 0.1% |
| Brazil | 132 | 0.2% |
| Canada | 209 | 0.3% |
| Caribbean | 16 | 0.0% |
| Central America | 198 | 0.3% |
| China | 414 | 0.5% |
| Eastern Africa | 3 | 0.0% |
| Eastern Asia | 577 | 0.8% |
| Eastern Europe | 103 | 0.1% |
| England | 11 | 0.0% |
| Ethiopia | 3 | 0.0% |
| Europe | 935 | 1.3% |
| Fiji | 15 | 0.0% |
| France | 34 | 0.1% |
| Germany | 526 | 0.7% |
| Ghana | 9 | 0.0% |
| Guatemala | 6 | 0.0% |
| Haiti | 16 | 0.0% |
| Hong Kong | 62 | 0.1% |
| Italy | 43 | 0.1% |
| Japan | 32 | 0.0% |
| Korea | 131 | 0.2% |
| Latin America | 357 | 0.5% |
| Lebanon | 28 | 0.0% |
| Malaysia | 17 | 0.0% |
| Mexico | 159 | 0.2% |
| Middle Africa | 4 | 0.0% |
| Netherlands | 46 | 0.1% |
| Nicaragua | 23 | 0.0% |
| Northern Africa | 1 | 0.0% |
| Northern Europe | 163 | 0.2% |
| Oceania | 84 | 0.1% |
| Panama | 10 | 0.0% |
| Philippines | 289 | 0.4% |
| Romania | 31 | 0.0% |
| South Africa | 25 | 0.0% |
| South America | 143 | 0.2% |
| South Central Asia | 97 | 0.1% |
| South Eastern Asia | 365 | 0.5% |
| Southern Europe | 46 | 0.1% |
| Spain | 3 | 0.0% |
| Sri Lanka | 47 | 0.1% |
| Sweden | 5 | 0.0% |
| Switzerland | 13 | 0.0% |
| Taiwan | 21 | 0.0% |
| Thailand | 10 | 0.0% |
| Uruguay | 11 | 0.0% |
| Vietnam | 49 | 0.1% |
| Western Africa | 51 | 0.1% |
| Western Asia | 28 | 0.0% |
| Western Europe | 619 | 0.8% | View All 54 Rows |
Sex and Age in Missoula
Sex and Age in Missoula
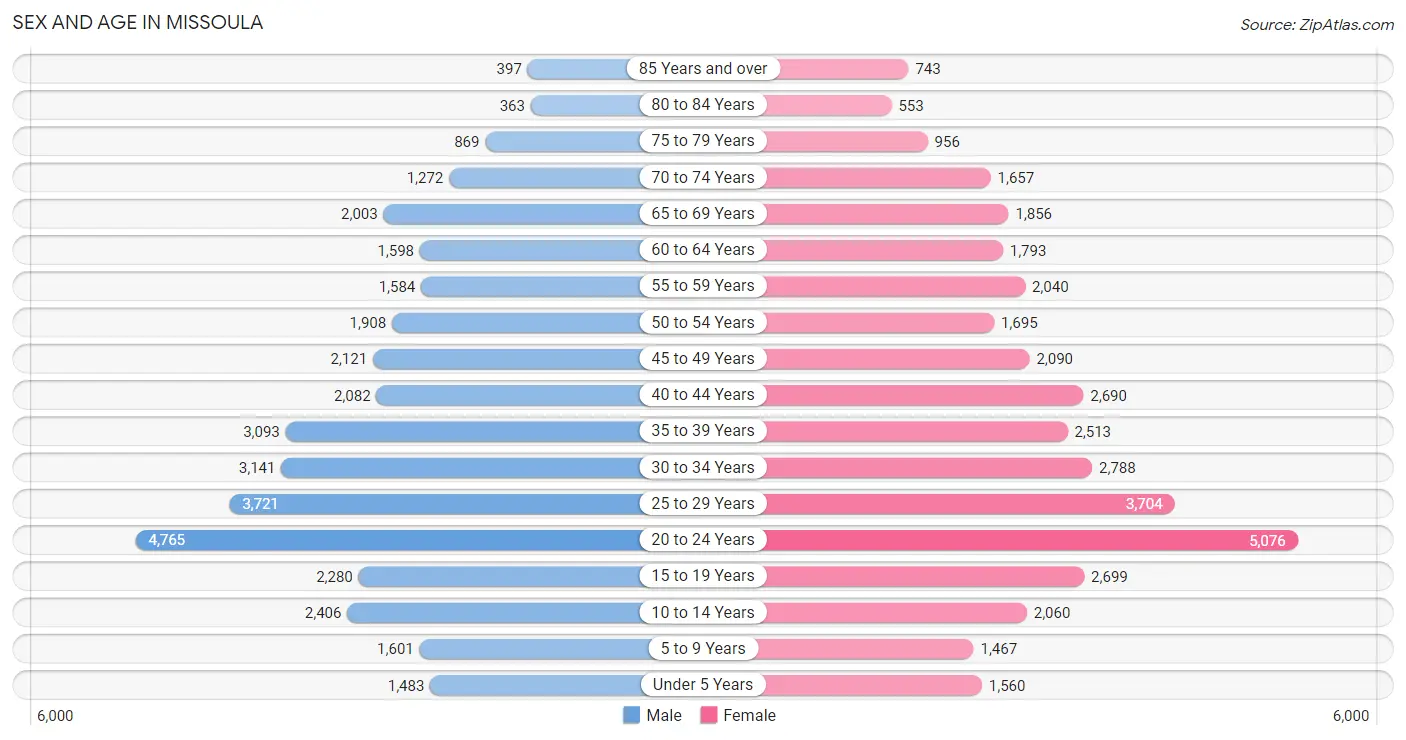
The most populous age groups in Missoula are 20 to 24 Years (4,765 | 13.0%) for men and 20 to 24 Years (5,076 | 13.4%) for women.
| Age Bracket | Male | Female |
| Under 5 Years | 1,483 (4.0%) | 1,560 (4.1%) |
| 5 to 9 Years | 1,601 (4.4%) | 1,467 (3.9%) |
| 10 to 14 Years | 2,406 (6.6%) | 2,060 (5.4%) |
| 15 to 19 Years | 2,280 (6.2%) | 2,699 (7.1%) |
| 20 to 24 Years | 4,765 (13.0%) | 5,076 (13.4%) |
| 25 to 29 Years | 3,721 (10.1%) | 3,704 (9.8%) |
| 30 to 34 Years | 3,141 (8.6%) | 2,788 (7.3%) |
| 35 to 39 Years | 3,093 (8.4%) | 2,513 (6.6%) |
| 40 to 44 Years | 2,082 (5.7%) | 2,690 (7.1%) |
| 45 to 49 Years | 2,121 (5.8%) | 2,090 (5.5%) |
| 50 to 54 Years | 1,908 (5.2%) | 1,695 (4.5%) |
| 55 to 59 Years | 1,584 (4.3%) | 2,040 (5.4%) |
| 60 to 64 Years | 1,598 (4.4%) | 1,793 (4.7%) |
| 65 to 69 Years | 2,003 (5.5%) | 1,856 (4.9%) |
| 70 to 74 Years | 1,272 (3.5%) | 1,657 (4.4%) |
| 75 to 79 Years | 869 (2.4%) | 956 (2.5%) |
| 80 to 84 Years | 363 (1.0%) | 553 (1.5%) |
| 85 Years and over | 397 (1.1%) | 743 (2.0%) |
| Total | 36,687 (100.0%) | 37,940 (100.0%) |
Families and Households in Missoula
Median Family Size in Missoula
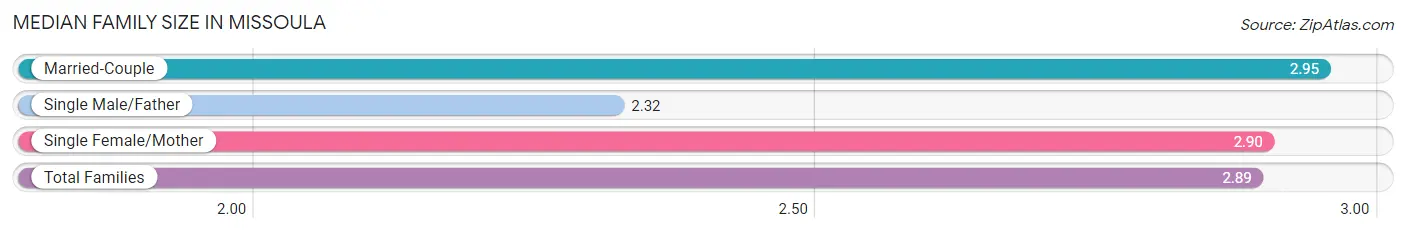
The median family size in Missoula is 2.89 persons per family, with married-couple families (11,408 | 73.8%) accounting for the largest median family size of 2.95 persons per family. On the other hand, single male/father families (1,229 | 8.0%) represent the smallest median family size with 2.32 persons per family.
| Family Type | # Families | Family Size |
| Married-Couple | 11,408 (73.8%) | 2.95 |
| Single Male/Father | 1,229 (8.0%) | 2.32 |
| Single Female/Mother | 2,819 (18.2%) | 2.90 |
| Total Families | 15,456 (100.0%) | 2.89 |
Median Household Size in Missoula
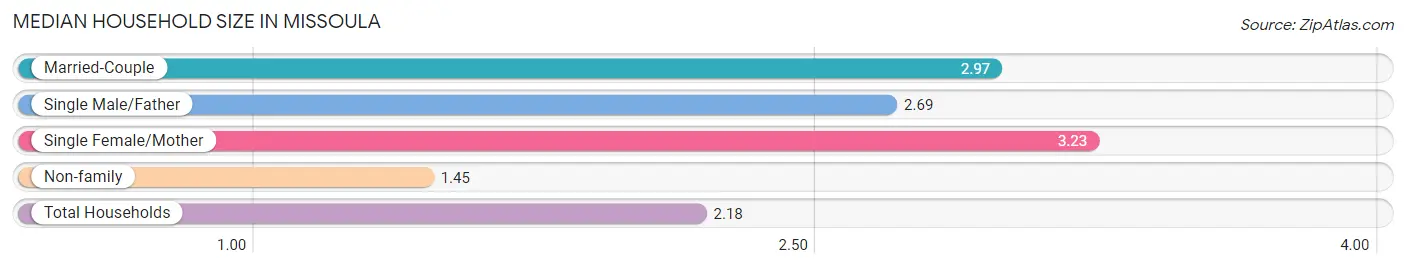
The median household size in Missoula is 2.18 persons per household, with single female/mother households (2,819 | 8.6%) accounting for the largest median household size of 3.23 persons per household. non-family households (17,488 | 53.1%) represent the smallest median household size with 1.45 persons per household.
| Household Type | # Households | Household Size |
| Married-Couple | 11,408 (34.6%) | 2.97 |
| Single Male/Father | 1,229 (3.7%) | 2.69 |
| Single Female/Mother | 2,819 (8.6%) | 3.23 |
| Non-family | 17,488 (53.1%) | 1.45 |
| Total Households | 32,944 (100.0%) | 2.18 |
Household Size by Marriage Status in Missoula
Out of a total of 32,944 households in Missoula, 15,456 (46.9%) are family households, while 17,488 (53.1%) are nonfamily households. The most numerous type of family households are 2-person households, comprising 7,119, and the most common type of nonfamily households are 1-person households, comprising 11,819.
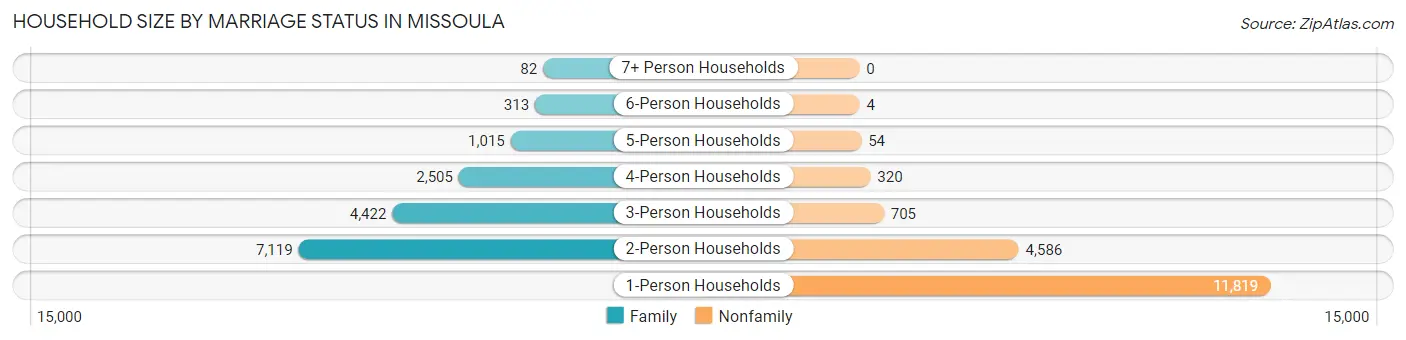
| Household Size | Family Households | Nonfamily Households |
| 1-Person Households | - | 11,819 (35.9%) |
| 2-Person Households | 7,119 (21.6%) | 4,586 (13.9%) |
| 3-Person Households | 4,422 (13.4%) | 705 (2.1%) |
| 4-Person Households | 2,505 (7.6%) | 320 (1.0%) |
| 5-Person Households | 1,015 (3.1%) | 54 (0.2%) |
| 6-Person Households | 313 (0.9%) | 4 (0.0%) |
| 7+ Person Households | 82 (0.3%) | 0 (0.0%) |
| Total | 15,456 (46.9%) | 17,488 (53.1%) |
Female Fertility in Missoula
Fertility by Age in Missoula
Average fertility rate in Missoula is 28.0 births per 1,000 women. Women in the age bracket of 20 to 34 years have the highest fertility rate with 33.0 births per 1,000 women. Women in the age bracket of 20 to 34 years acount for 60.8% of all women with births.
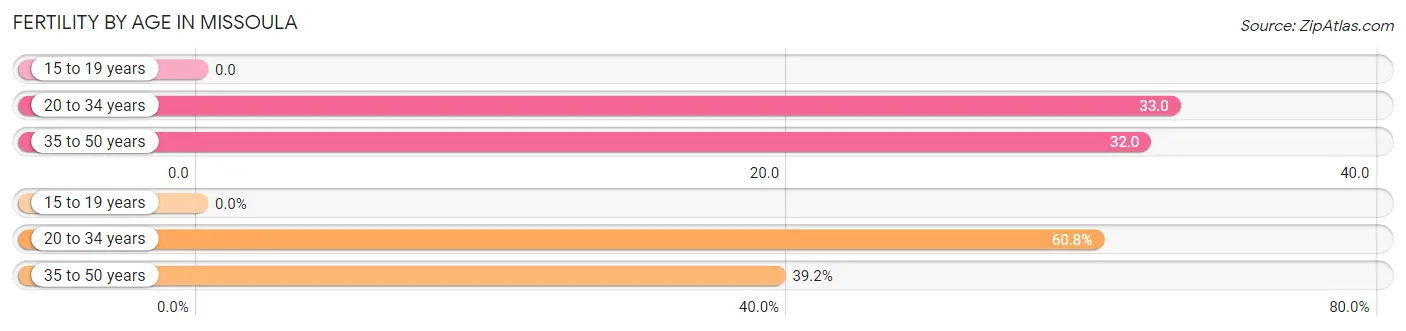
| Age Bracket | Women with Births | Births / 1,000 Women |
| 15 to 19 years | 0 (0.0%) | 0.0 |
| 20 to 34 years | 377 (60.8%) | 33.0 |
| 35 to 50 years | 243 (39.2%) | 32.0 |
| Total | 620 (100.0%) | 28.0 |
Fertility by Age by Marriage Status in Missoula
84.2% of women with births (620) in Missoula are married. The highest percentage of unmarried women with births falls into 20 to 34 years age bracket with 19.9% of them unmarried at the time of birth, while the lowest percentage of unmarried women with births belong to 35 to 50 years age bracket with 9.5% of them unmarried.
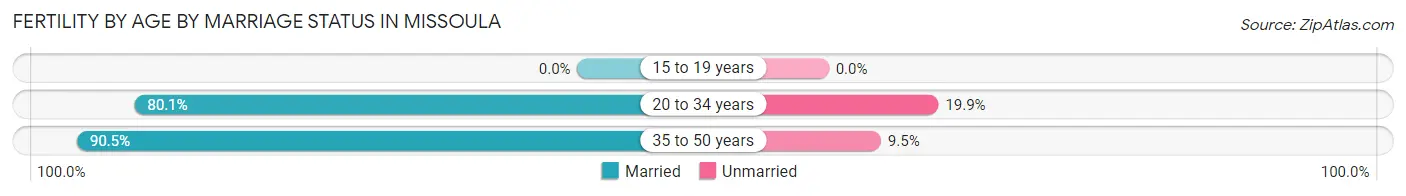
| Age Bracket | Married | Unmarried |
| 15 to 19 years | 0 (0.0%) | 0 (0.0%) |
| 20 to 34 years | 302 (80.1%) | 75 (19.9%) |
| 35 to 50 years | 220 (90.5%) | 23 (9.5%) |
| Total | 522 (84.2%) | 98 (15.8%) |
Fertility by Education in Missoula
Average fertility rate in Missoula is 28.0 births per 1,000 women. Women with the education attainment of graduate degree have the highest fertility rate of 40.0 births per 1,000 women, while women with the education attainment of high school diploma have the lowest fertility at 10.0 births per 1,000 women. Women with the education attainment of college or associate's degree represent 32.6% of all women with births.
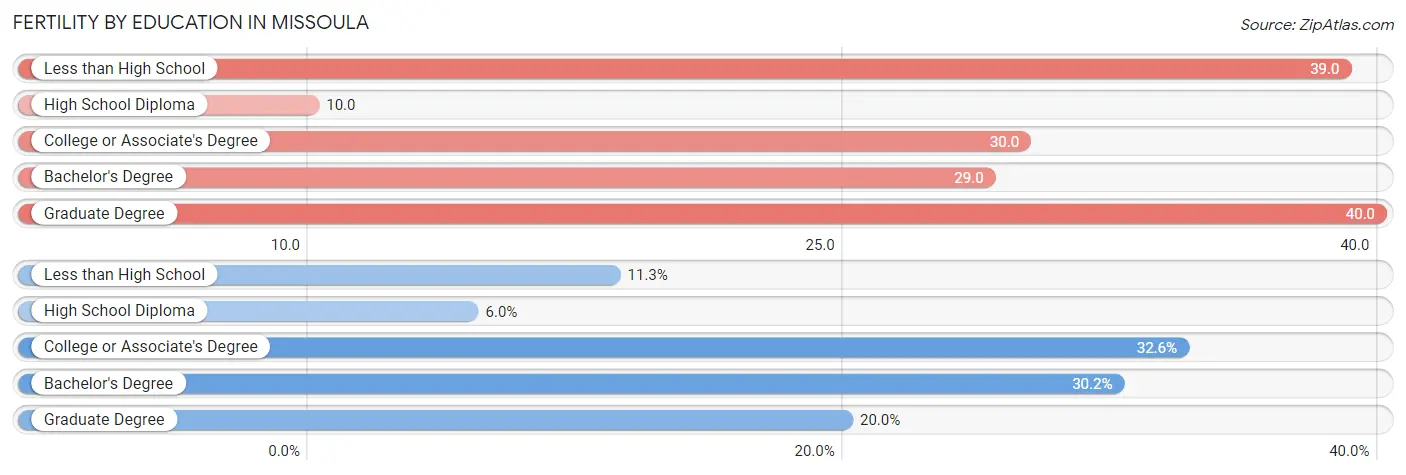
| Educational Attainment | Women with Births | Births / 1,000 Women |
| Less than High School | 70 (11.3%) | 39.0 |
| High School Diploma | 37 (6.0%) | 10.0 |
| College or Associate's Degree | 202 (32.6%) | 30.0 |
| Bachelor's Degree | 187 (30.2%) | 29.0 |
| Graduate Degree | 124 (20.0%) | 40.0 |
| Total | 620 (100.0%) | 28.0 |
Fertility by Education by Marriage Status in Missoula
15.8% of women with births in Missoula are unmarried. Women with the educational attainment of high school diploma are most likely to be married with 100.0% of them married at childbirth, while women with the educational attainment of less than high school are least likely to be married with 21.4% of them unmarried at childbirth.
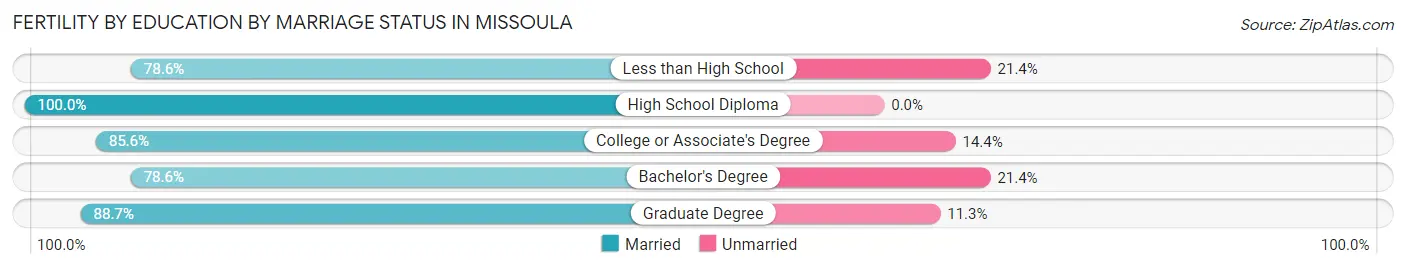
| Educational Attainment | Married | Unmarried |
| Less than High School | 55 (78.6%) | 15 (21.4%) |
| High School Diploma | 37 (100.0%) | 0 (0.0%) |
| College or Associate's Degree | 173 (85.6%) | 29 (14.4%) |
| Bachelor's Degree | 147 (78.6%) | 40 (21.4%) |
| Graduate Degree | 110 (88.7%) | 14 (11.3%) |
| Total | 522 (84.2%) | 98 (15.8%) |
Employment Characteristics in Missoula
Employment by Class of Employer in Missoula
Among the 43,245 employed individuals in Missoula, private company employees (27,331 | 63.2%), not-for-profit organizations (4,251 | 9.8%), and self-employed (not incorporated) (3,490 | 8.1%) make up the most common classes of employment.
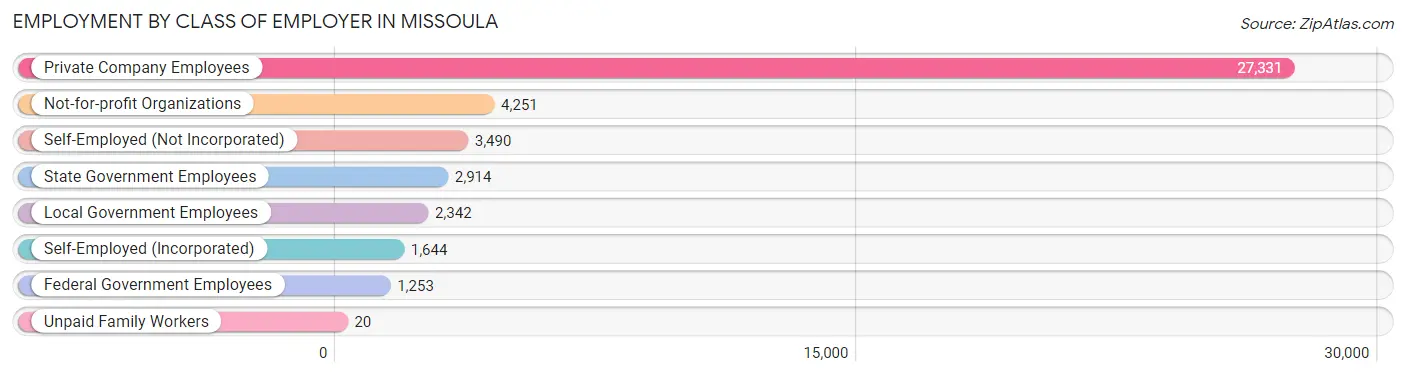
| Employer Class | # Employees | % Employees |
| Private Company Employees | 27,331 | 63.2% |
| Self-Employed (Incorporated) | 1,644 | 3.8% |
| Self-Employed (Not Incorporated) | 3,490 | 8.1% |
| Not-for-profit Organizations | 4,251 | 9.8% |
| Local Government Employees | 2,342 | 5.4% |
| State Government Employees | 2,914 | 6.7% |
| Federal Government Employees | 1,253 | 2.9% |
| Unpaid Family Workers | 20 | 0.1% |
| Total | 43,245 | 100.0% |
Employment Status by Age in Missoula
According to the labor force statistics for Missoula, out of the total population over 16 years of age (63,239), 73.2% or 46,291 individuals are in the labor force, with 4.6% or 2,129 of them unemployed. The age group with the highest labor force participation rate is 45 to 54 years, with 91.0% or 7,111 individuals in the labor force. Within the labor force, the 16 to 19 years age range has the highest percentage of unemployed individuals, with 14.3% or 336 of them being unemployed.
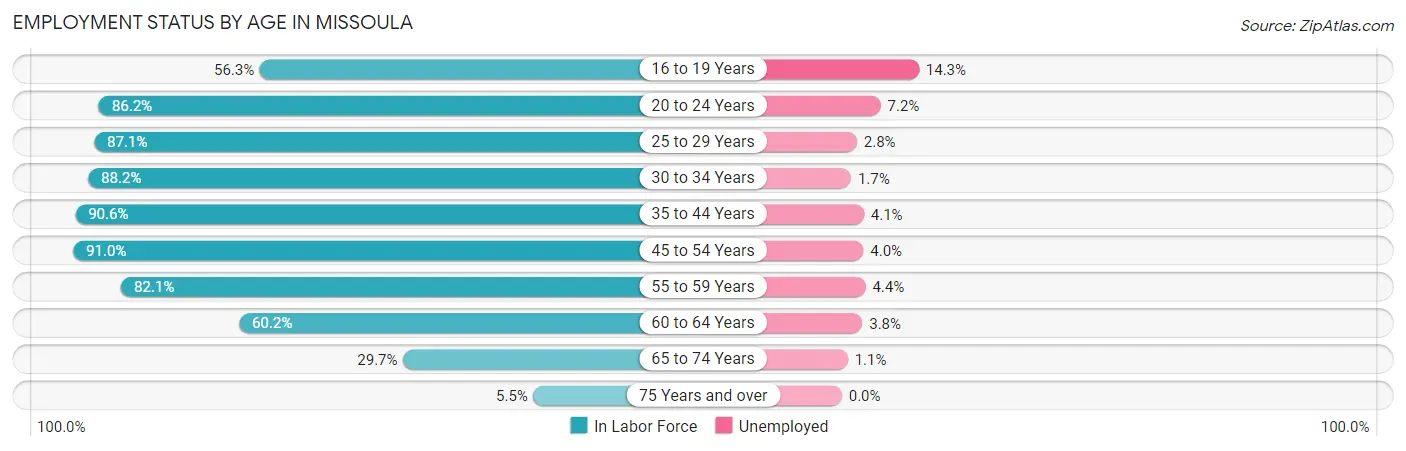
| Age Bracket | In Labor Force | Unemployed |
| 16 to 19 Years | 2,347 (56.3%) | 336 (14.3%) |
| 20 to 24 Years | 8,483 (86.2%) | 611 (7.2%) |
| 25 to 29 Years | 6,467 (87.1%) | 181 (2.8%) |
| 30 to 34 Years | 5,229 (88.2%) | 89 (1.7%) |
| 35 to 44 Years | 9,402 (90.6%) | 385 (4.1%) |
| 45 to 54 Years | 7,111 (91.0%) | 284 (4.0%) |
| 55 to 59 Years | 2,975 (82.1%) | 131 (4.4%) |
| 60 to 64 Years | 2,041 (60.2%) | 78 (3.8%) |
| 65 to 74 Years | 2,016 (29.7%) | 22 (1.1%) |
| 75 Years and over | 213 (5.5%) | 0 (0.0%) |
| Total | 46,291 (73.2%) | 2,129 (4.6%) |
Employment Status by Educational Attainment in Missoula
According to labor force statistics for Missoula, 86.2% of individuals (33,240) out of the total population between 25 and 64 years of age (38,561) are in the labor force, with 3.5% or 1,163 of them being unemployed. The group with the highest labor force participation rate are those with the educational attainment of bachelor's degree or higher, with 92.3% or 18,022 individuals in the labor force. Within the labor force, individuals with less than high school education have the highest percentage of unemployment, with 15.3% or 101 of them being unemployed.
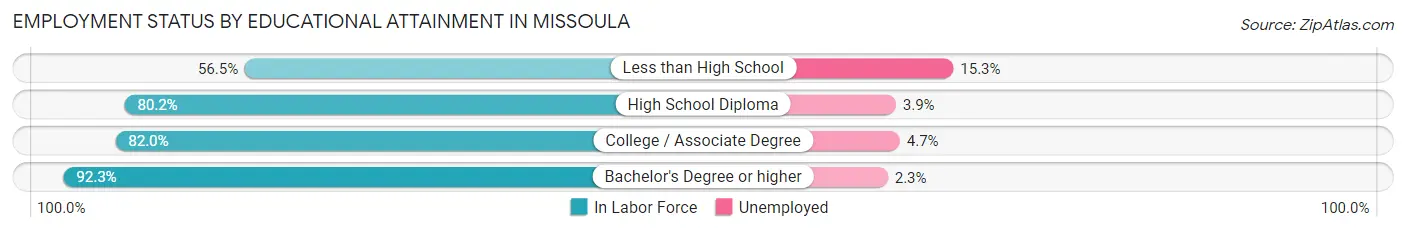
| Educational Attainment | In Labor Force | Unemployed |
| Less than High School | 661 (56.5%) | 179 (15.3%) |
| High School Diploma | 5,200 (80.2%) | 253 (3.9%) |
| College / Associate Degree | 9,333 (82.0%) | 535 (4.7%) |
| Bachelor's Degree or higher | 18,022 (92.3%) | 449 (2.3%) |
| Total | 33,240 (86.2%) | 1,350 (3.5%) |
Employment Occupations by Sex in Missoula
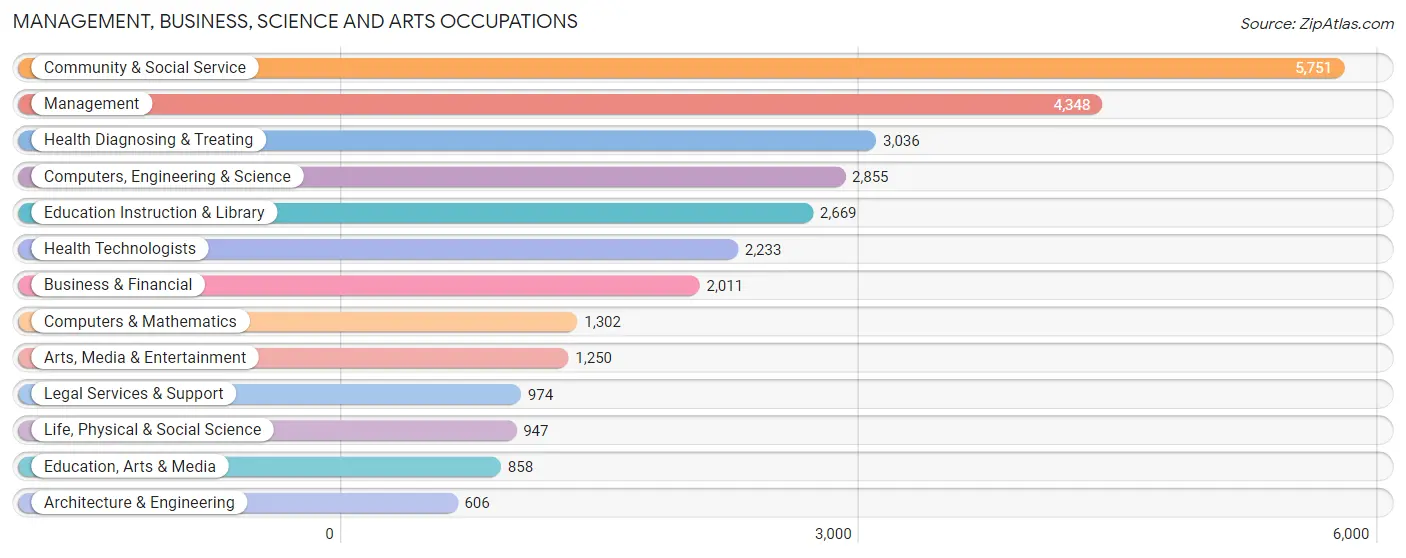
Management, Business, Science and Arts Occupations
The most common Management, Business, Science and Arts occupations in Missoula are Community & Social Service (5,751 | 13.0%), Management (4,348 | 9.9%), Health Diagnosing & Treating (3,036 | 6.9%), Computers, Engineering & Science (2,855 | 6.5%), and Education Instruction & Library (2,669 | 6.0%).
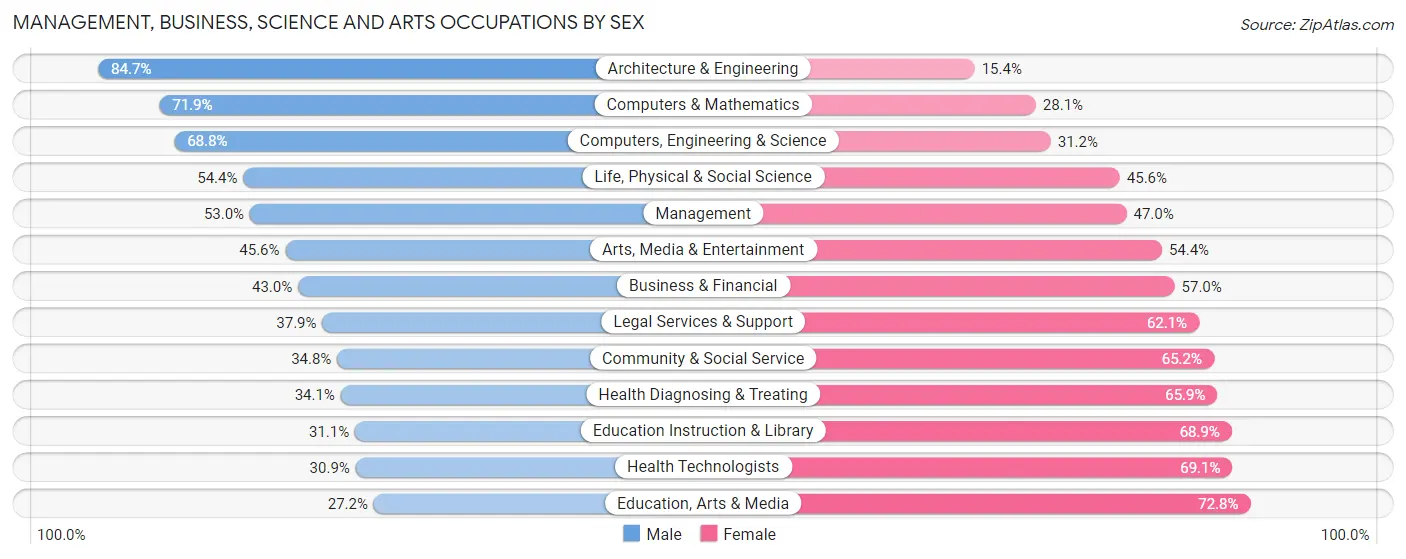
Management, Business, Science and Arts Occupations by Sex
Within the Management, Business, Science and Arts occupations in Missoula, the most male-oriented occupations are Architecture & Engineering (84.7%), Computers & Mathematics (71.9%), and Computers, Engineering & Science (68.8%), while the most female-oriented occupations are Education, Arts & Media (72.8%), Health Technologists (69.1%), and Education Instruction & Library (68.9%).
| Occupation | Male | Female |
| Management | 2,304 (53.0%) | 2,044 (47.0%) |
| Business & Financial | 864 (43.0%) | 1,147 (57.0%) |
| Computers, Engineering & Science | 1,964 (68.8%) | 891 (31.2%) |
| Computers & Mathematics | 936 (71.9%) | 366 (28.1%) |
| Architecture & Engineering | 513 (84.7%) | 93 (15.3%) |
| Life, Physical & Social Science | 515 (54.4%) | 432 (45.6%) |
| Community & Social Service | 2,001 (34.8%) | 3,750 (65.2%) |
| Education, Arts & Media | 233 (27.2%) | 625 (72.8%) |
| Legal Services & Support | 369 (37.9%) | 605 (62.1%) |
| Education Instruction & Library | 829 (31.1%) | 1,840 (68.9%) |
| Arts, Media & Entertainment | 570 (45.6%) | 680 (54.4%) |
| Health Diagnosing & Treating | 1,034 (34.1%) | 2,002 (65.9%) |
| Health Technologists | 691 (30.9%) | 1,542 (69.1%) |
| Total (Category) | 8,167 (45.4%) | 9,834 (54.6%) |
| Total (Overall) | 21,833 (49.5%) | 22,304 (50.5%) |
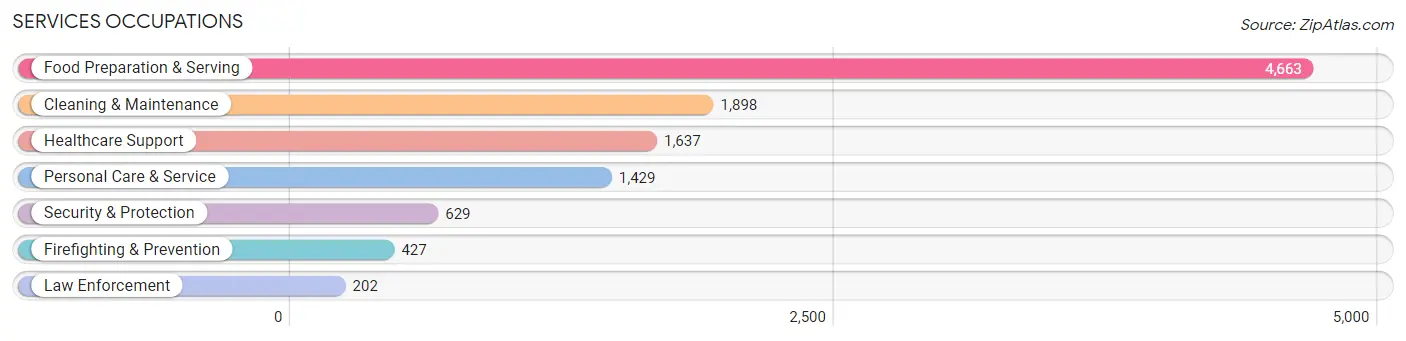
Services Occupations
The most common Services occupations in Missoula are Food Preparation & Serving (4,663 | 10.6%), Cleaning & Maintenance (1,898 | 4.3%), Healthcare Support (1,637 | 3.7%), Personal Care & Service (1,429 | 3.2%), and Security & Protection (629 | 1.4%).
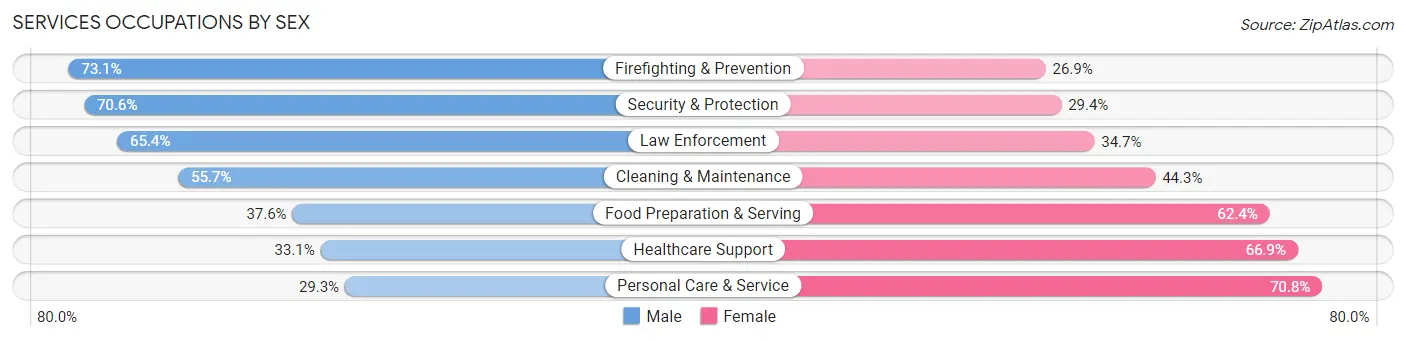
Services Occupations by Sex
Within the Services occupations in Missoula, the most male-oriented occupations are Firefighting & Prevention (73.1%), Security & Protection (70.6%), and Law Enforcement (65.3%), while the most female-oriented occupations are Personal Care & Service (70.8%), Healthcare Support (66.9%), and Food Preparation & Serving (62.4%).
| Occupation | Male | Female |
| Healthcare Support | 542 (33.1%) | 1,095 (66.9%) |
| Security & Protection | 444 (70.6%) | 185 (29.4%) |
| Firefighting & Prevention | 312 (73.1%) | 115 (26.9%) |
| Law Enforcement | 132 (65.3%) | 70 (34.6%) |
| Food Preparation & Serving | 1,752 (37.6%) | 2,911 (62.4%) |
| Cleaning & Maintenance | 1,057 (55.7%) | 841 (44.3%) |
| Personal Care & Service | 418 (29.2%) | 1,011 (70.8%) |
| Total (Category) | 4,213 (41.1%) | 6,043 (58.9%) |
| Total (Overall) | 21,833 (49.5%) | 22,304 (50.5%) |
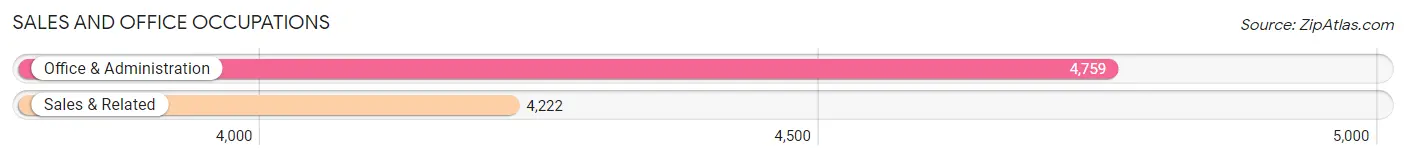
Sales and Office Occupations
The most common Sales and Office occupations in Missoula are Office & Administration (4,759 | 10.8%), and Sales & Related (4,222 | 9.6%).
Sales and Office Occupations by Sex
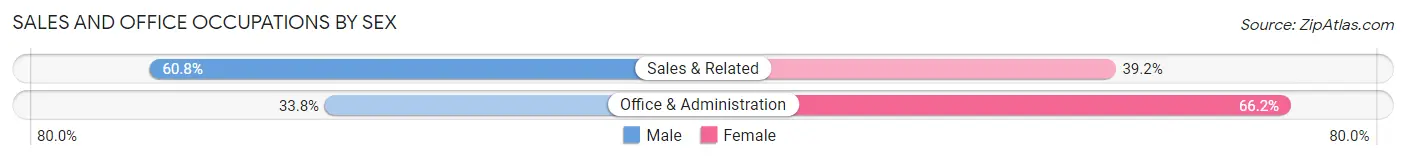
| Occupation | Male | Female |
| Sales & Related | 2,566 (60.8%) | 1,656 (39.2%) |
| Office & Administration | 1,608 (33.8%) | 3,151 (66.2%) |
| Total (Category) | 4,174 (46.5%) | 4,807 (53.5%) |
| Total (Overall) | 21,833 (49.5%) | 22,304 (50.5%) |
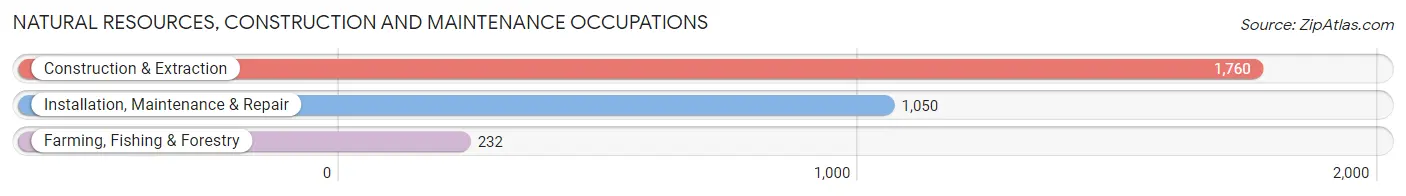
Natural Resources, Construction and Maintenance Occupations
The most common Natural Resources, Construction and Maintenance occupations in Missoula are Construction & Extraction (1,760 | 4.0%), Installation, Maintenance & Repair (1,050 | 2.4%), and Farming, Fishing & Forestry (232 | 0.5%).
Natural Resources, Construction and Maintenance Occupations by Sex
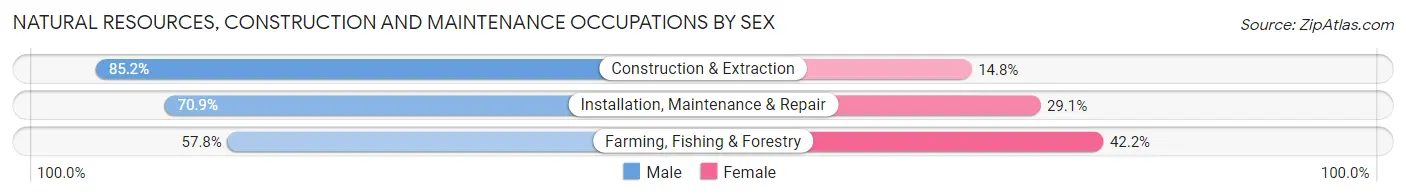
| Occupation | Male | Female |
| Farming, Fishing & Forestry | 134 (57.8%) | 98 (42.2%) |
| Construction & Extraction | 1,499 (85.2%) | 261 (14.8%) |
| Installation, Maintenance & Repair | 744 (70.9%) | 306 (29.1%) |
| Total (Category) | 2,377 (78.1%) | 665 (21.9%) |
| Total (Overall) | 21,833 (49.5%) | 22,304 (50.5%) |
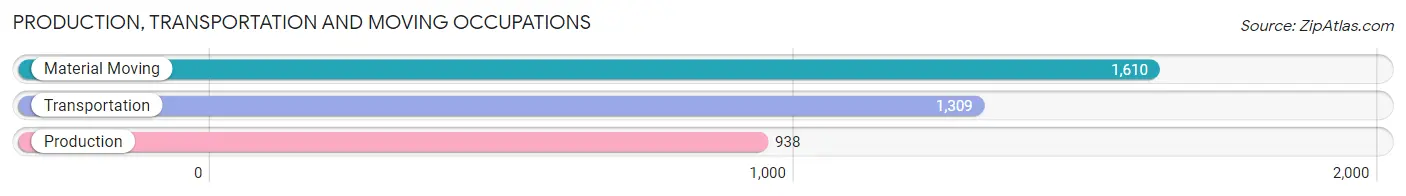
Production, Transportation and Moving Occupations
The most common Production, Transportation and Moving occupations in Missoula are Material Moving (1,610 | 3.6%), Transportation (1,309 | 3.0%), and Production (938 | 2.1%).
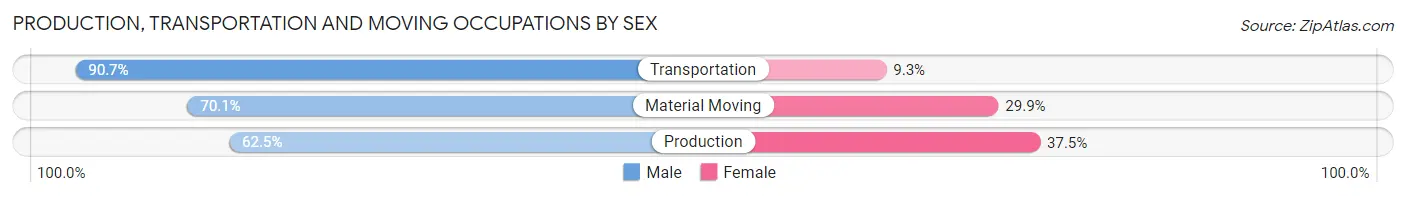
Production, Transportation and Moving Occupations by Sex
| Occupation | Male | Female |
| Production | 586 (62.5%) | 352 (37.5%) |
| Transportation | 1,187 (90.7%) | 122 (9.3%) |
| Material Moving | 1,129 (70.1%) | 481 (29.9%) |
| Total (Category) | 2,902 (75.2%) | 955 (24.8%) |
| Total (Overall) | 21,833 (49.5%) | 22,304 (50.5%) |
Employment Industries by Sex in Missoula
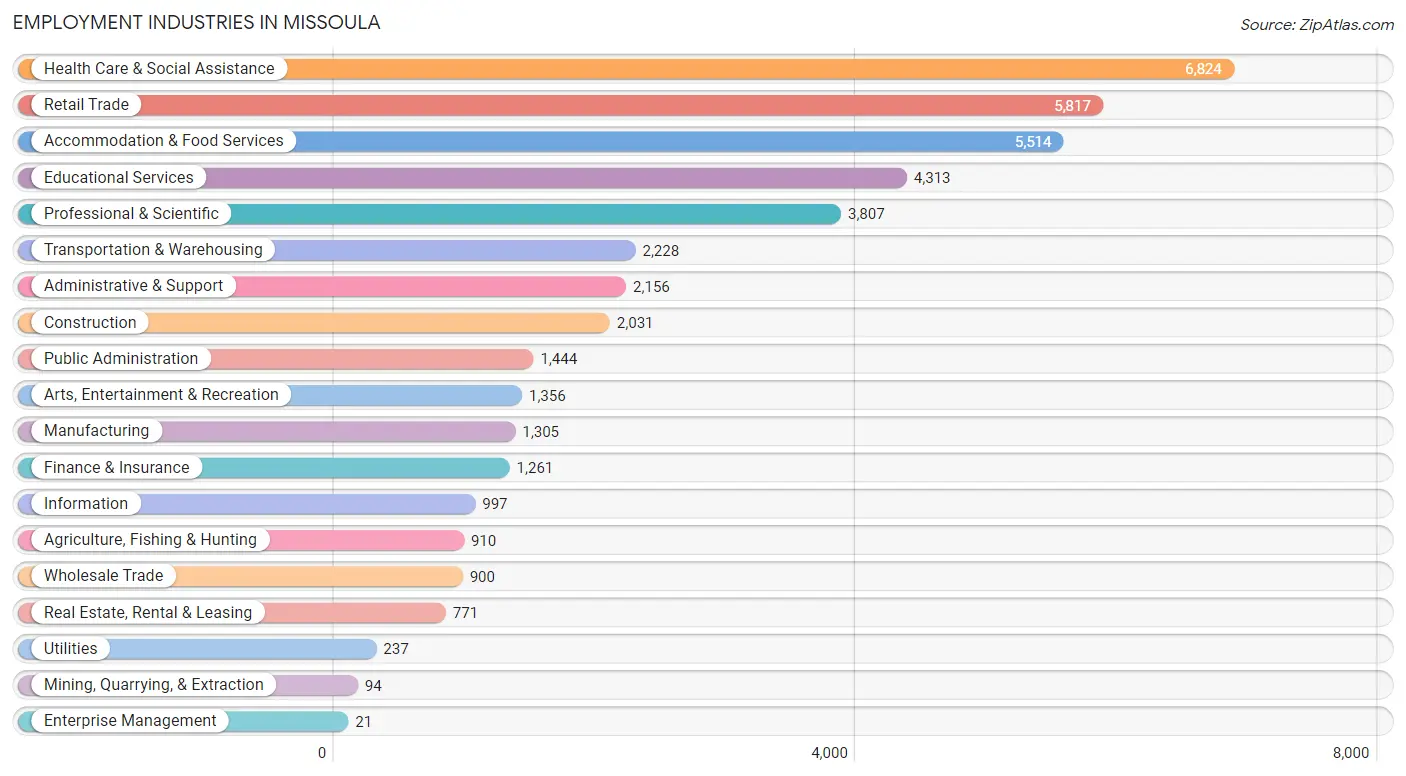
Employment Industries in Missoula
The major employment industries in Missoula include Health Care & Social Assistance (6,824 | 15.5%), Retail Trade (5,817 | 13.2%), Accommodation & Food Services (5,514 | 12.5%), Educational Services (4,313 | 9.8%), and Professional & Scientific (3,807 | 8.6%).
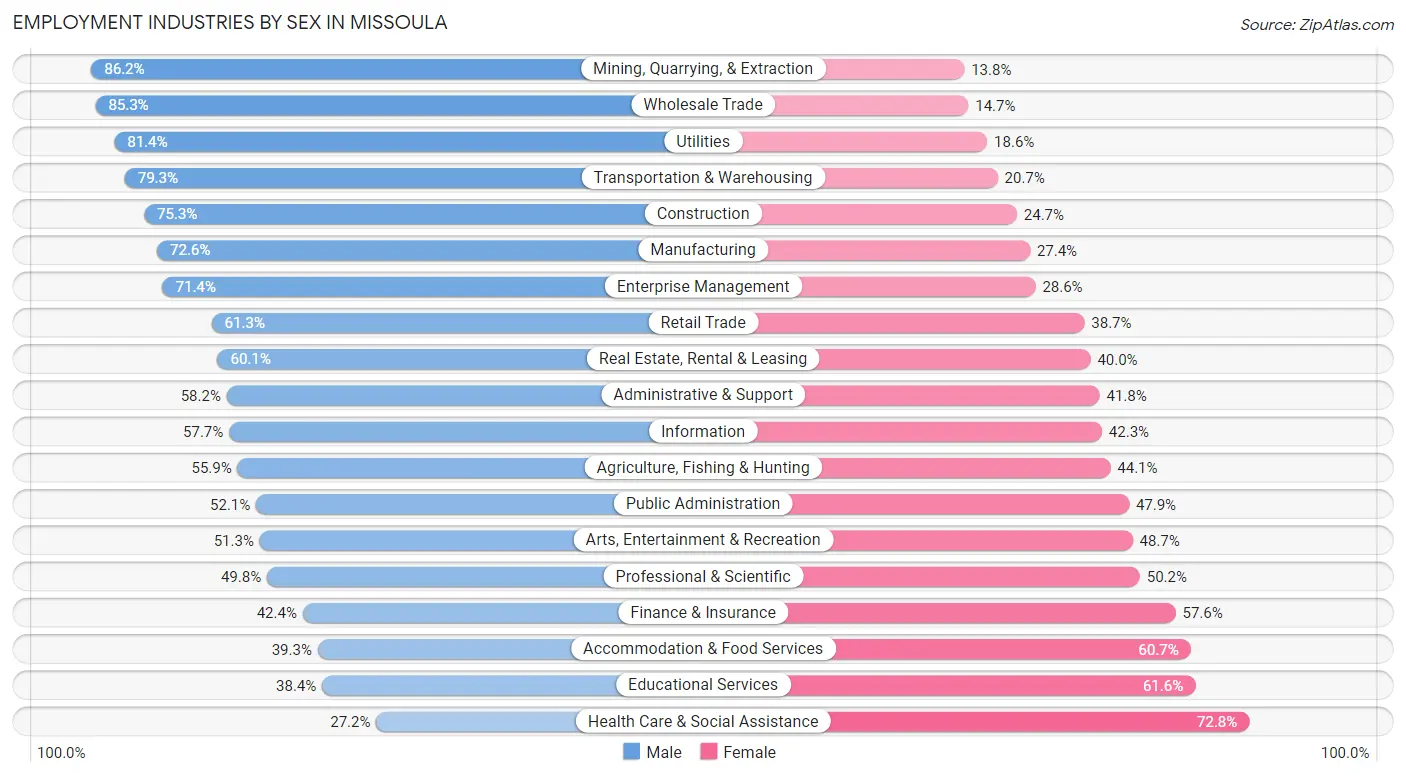
Employment Industries by Sex in Missoula
The Missoula industries that see more men than women are Mining, Quarrying, & Extraction (86.2%), Wholesale Trade (85.3%), and Utilities (81.4%), whereas the industries that tend to have a higher number of women are Health Care & Social Assistance (72.8%), Educational Services (61.6%), and Accommodation & Food Services (60.7%).
| Industry | Male | Female |
| Agriculture, Fishing & Hunting | 509 (55.9%) | 401 (44.1%) |
| Mining, Quarrying, & Extraction | 81 (86.2%) | 13 (13.8%) |
| Construction | 1,529 (75.3%) | 502 (24.7%) |
| Manufacturing | 947 (72.6%) | 358 (27.4%) |
| Wholesale Trade | 768 (85.3%) | 132 (14.7%) |
| Retail Trade | 3,566 (61.3%) | 2,251 (38.7%) |
| Transportation & Warehousing | 1,766 (79.3%) | 462 (20.7%) |
| Utilities | 193 (81.4%) | 44 (18.6%) |
| Information | 575 (57.7%) | 422 (42.3%) |
| Finance & Insurance | 535 (42.4%) | 726 (57.6%) |
| Real Estate, Rental & Leasing | 463 (60.1%) | 308 (40.0%) |
| Professional & Scientific | 1,897 (49.8%) | 1,910 (50.2%) |
| Enterprise Management | 15 (71.4%) | 6 (28.6%) |
| Administrative & Support | 1,254 (58.2%) | 902 (41.8%) |
| Educational Services | 1,657 (38.4%) | 2,656 (61.6%) |
| Health Care & Social Assistance | 1,857 (27.2%) | 4,967 (72.8%) |
| Arts, Entertainment & Recreation | 696 (51.3%) | 660 (48.7%) |
| Accommodation & Food Services | 2,168 (39.3%) | 3,346 (60.7%) |
| Public Administration | 752 (52.1%) | 692 (47.9%) |
| Total | 21,833 (49.5%) | 22,304 (50.5%) |
Education in Missoula
School Enrollment in Missoula
The most common levels of schooling among the 19,723 students in Missoula are college / undergraduate (7,411 | 37.6%), middle school (3,342 | 16.9%), and high school (2,907 | 14.7%).
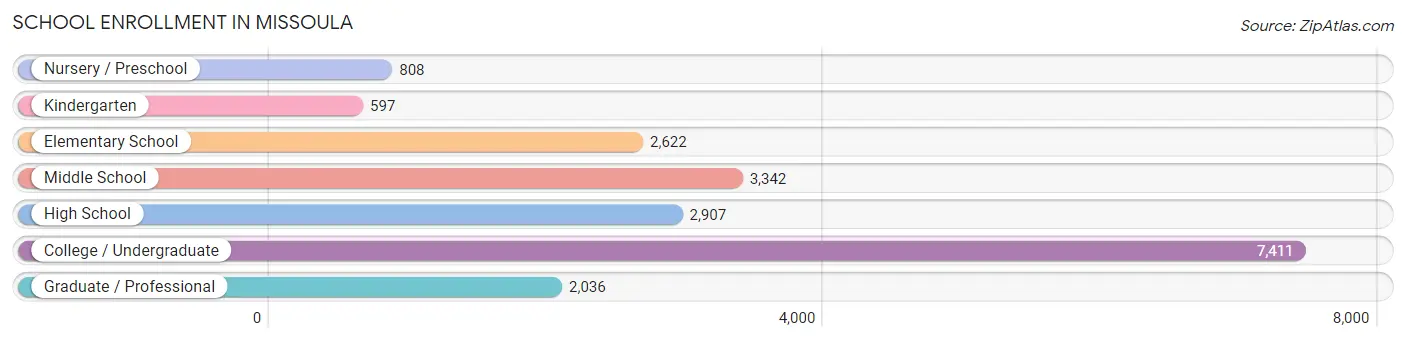
| School Level | # Students | % Students |
| Nursery / Preschool | 808 | 4.1% |
| Kindergarten | 597 | 3.0% |
| Elementary School | 2,622 | 13.3% |
| Middle School | 3,342 | 16.9% |
| High School | 2,907 | 14.7% |
| College / Undergraduate | 7,411 | 37.6% |
| Graduate / Professional | 2,036 | 10.3% |
| Total | 19,723 | 100.0% |
School Enrollment by Age by Funding Source in Missoula
Out of a total of 19,723 students who are enrolled in schools in Missoula, 1,854 (9.4%) attend a private institution, while the remaining 17,869 (90.6%) are enrolled in public schools. The age group of 3 to 4 year olds has the highest likelihood of being enrolled in private schools, with 323 (48.8% in the age bracket) enrolled. Conversely, the age group of 15 to 17 year olds has the lowest likelihood of being enrolled in a private school, with 1,972 (97.0% in the age bracket) attending a public institution.
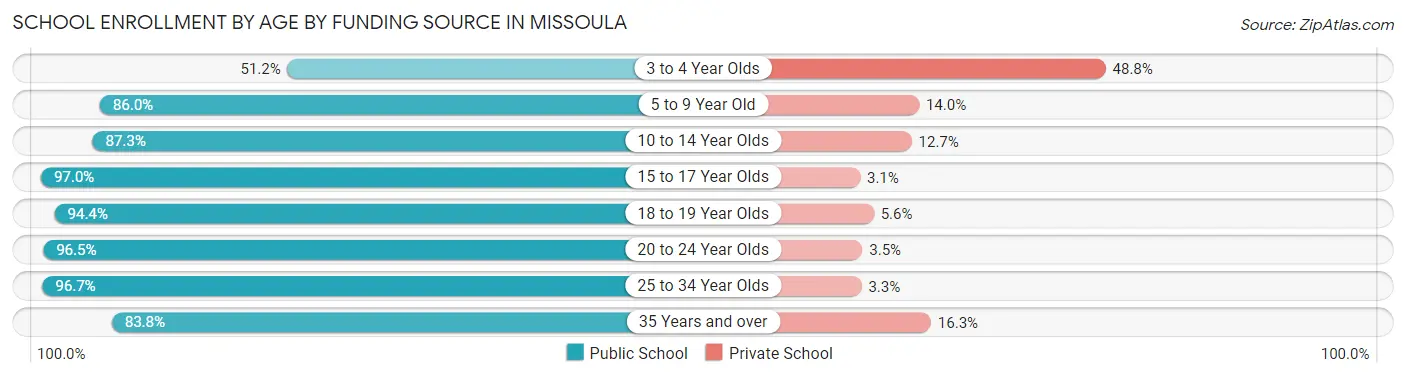
| Age Bracket | Public School | Private School |
| 3 to 4 Year Olds | 339 (51.2%) | 323 (48.8%) |
| 5 to 9 Year Old | 2,334 (86.0%) | 381 (14.0%) |
| 10 to 14 Year Olds | 3,706 (87.3%) | 537 (12.7%) |
| 15 to 17 Year Olds | 1,972 (97.0%) | 62 (3.0%) |
| 18 to 19 Year Olds | 2,328 (94.4%) | 138 (5.6%) |
| 20 to 24 Year Olds | 3,988 (96.5%) | 144 (3.5%) |
| 25 to 34 Year Olds | 2,154 (96.7%) | 74 (3.3%) |
| 35 Years and over | 1,041 (83.8%) | 202 (16.3%) |
| Total | 17,869 (90.6%) | 1,854 (9.4%) |
Educational Attainment by Field of Study in Missoula
Business (3,862 | 13.8%), social sciences (3,516 | 12.5%), bio, nature & agricultural (3,229 | 11.5%), education (2,787 | 9.9%), and science & technology (2,564 | 9.1%) are the most common fields of study among 28,066 individuals in Missoula who have obtained a bachelor's degree or higher.
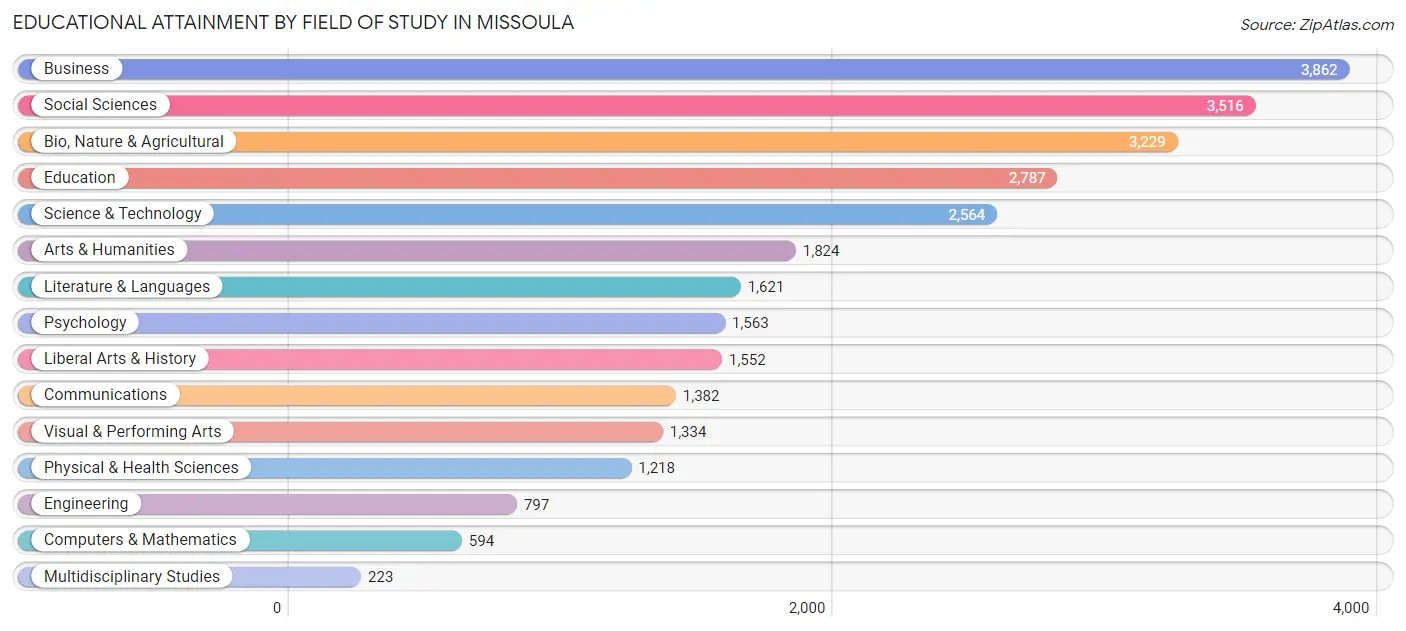
| Field of Study | # Graduates | % Graduates |
| Computers & Mathematics | 594 | 2.1% |
| Bio, Nature & Agricultural | 3,229 | 11.5% |
| Physical & Health Sciences | 1,218 | 4.3% |
| Psychology | 1,563 | 5.6% |
| Social Sciences | 3,516 | 12.5% |
| Engineering | 797 | 2.8% |
| Multidisciplinary Studies | 223 | 0.8% |
| Science & Technology | 2,564 | 9.1% |
| Business | 3,862 | 13.8% |
| Education | 2,787 | 9.9% |
| Literature & Languages | 1,621 | 5.8% |
| Liberal Arts & History | 1,552 | 5.5% |
| Visual & Performing Arts | 1,334 | 4.8% |
| Communications | 1,382 | 4.9% |
| Arts & Humanities | 1,824 | 6.5% |
| Total | 28,066 | 100.0% |
Transportation & Commute in Missoula
Vehicle Availability by Sex in Missoula
The most prevalent vehicle ownership categories in Missoula are males with 2 vehicles (9,457, accounting for 44.9%) and females with 2 vehicles (9,140, making up 44.4%).
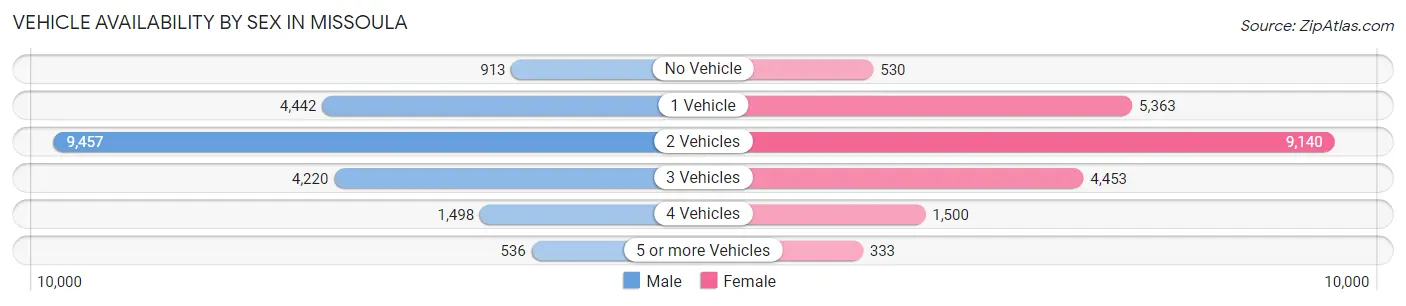
| Vehicles Available | Male | Female |
| No Vehicle | 913 (4.3%) | 530 (2.5%) |
| 1 Vehicle | 4,442 (21.1%) | 5,363 (25.2%) |
| 2 Vehicles | 9,457 (44.9%) | 9,140 (42.9%) |
| 3 Vehicles | 4,220 (20.0%) | 4,453 (20.9%) |
| 4 Vehicles | 1,498 (7.1%) | 1,500 (7.0%) |
| 5 or more Vehicles | 536 (2.5%) | 333 (1.6%) |
| Total | 21,066 (100.0%) | 21,319 (100.0%) |
Commute Time in Missoula
The most frequently occuring commute durations in Missoula are 10 to 14 minutes (10,607 commuters, 27.5%), 15 to 19 minutes (8,970 commuters, 23.2%), and 5 to 9 minutes (8,008 commuters, 20.7%).
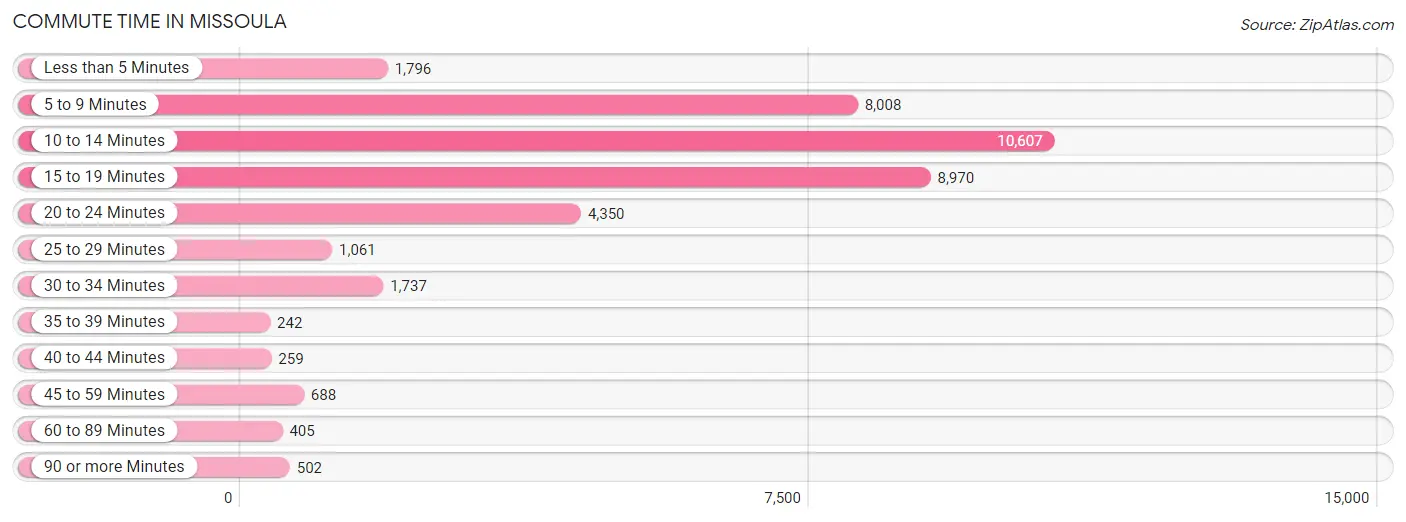
| Commute Time | # Commuters | % Commuters |
| Less than 5 Minutes | 1,796 | 4.6% |
| 5 to 9 Minutes | 8,008 | 20.7% |
| 10 to 14 Minutes | 10,607 | 27.5% |
| 15 to 19 Minutes | 8,970 | 23.2% |
| 20 to 24 Minutes | 4,350 | 11.3% |
| 25 to 29 Minutes | 1,061 | 2.8% |
| 30 to 34 Minutes | 1,737 | 4.5% |
| 35 to 39 Minutes | 242 | 0.6% |
| 40 to 44 Minutes | 259 | 0.7% |
| 45 to 59 Minutes | 688 | 1.8% |
| 60 to 89 Minutes | 405 | 1.1% |
| 90 or more Minutes | 502 | 1.3% |
Commute Time by Sex in Missoula
The most common commute times in Missoula are 10 to 14 minutes (5,285 commuters, 27.7%) for males and 10 to 14 minutes (5,322 commuters, 27.2%) for females.
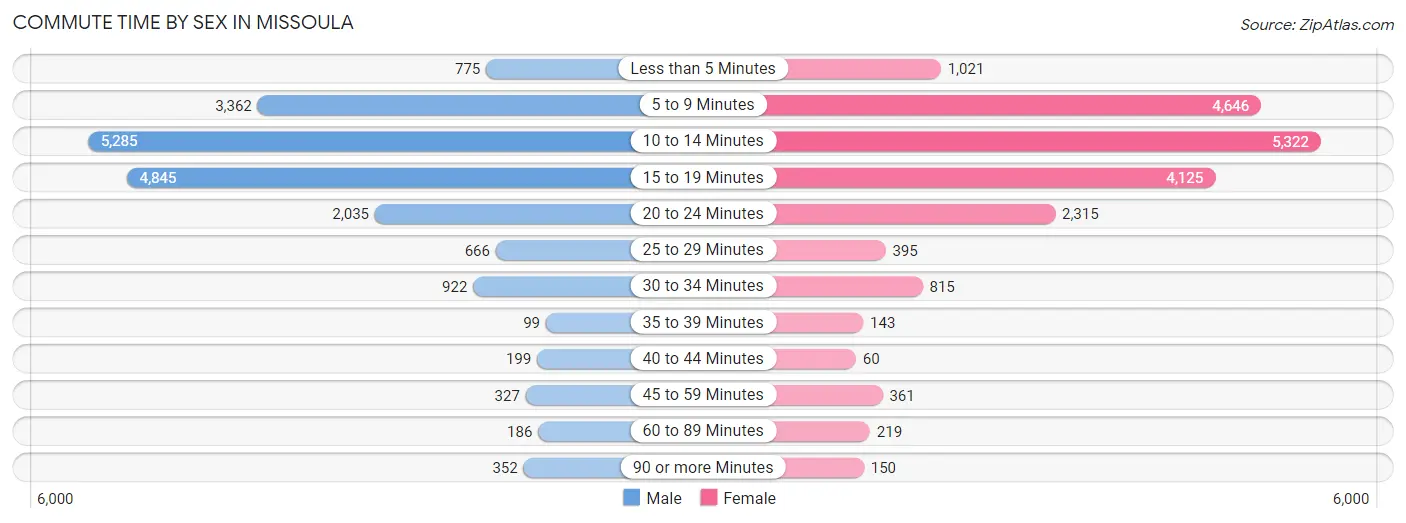
| Commute Time | Male | Female |
| Less than 5 Minutes | 775 (4.1%) | 1,021 (5.2%) |
| 5 to 9 Minutes | 3,362 (17.6%) | 4,646 (23.7%) |
| 10 to 14 Minutes | 5,285 (27.7%) | 5,322 (27.2%) |
| 15 to 19 Minutes | 4,845 (25.4%) | 4,125 (21.1%) |
| 20 to 24 Minutes | 2,035 (10.7%) | 2,315 (11.8%) |
| 25 to 29 Minutes | 666 (3.5%) | 395 (2.0%) |
| 30 to 34 Minutes | 922 (4.8%) | 815 (4.2%) |
| 35 to 39 Minutes | 99 (0.5%) | 143 (0.7%) |
| 40 to 44 Minutes | 199 (1.0%) | 60 (0.3%) |
| 45 to 59 Minutes | 327 (1.7%) | 361 (1.8%) |
| 60 to 89 Minutes | 186 (1.0%) | 219 (1.1%) |
| 90 or more Minutes | 352 (1.8%) | 150 (0.8%) |
Time of Departure to Work by Sex in Missoula
The most frequent times of departure to work in Missoula are 7:30 AM to 7:59 AM (3,336, 17.5%) for males and 7:30 AM to 7:59 AM (3,579, 18.3%) for females.
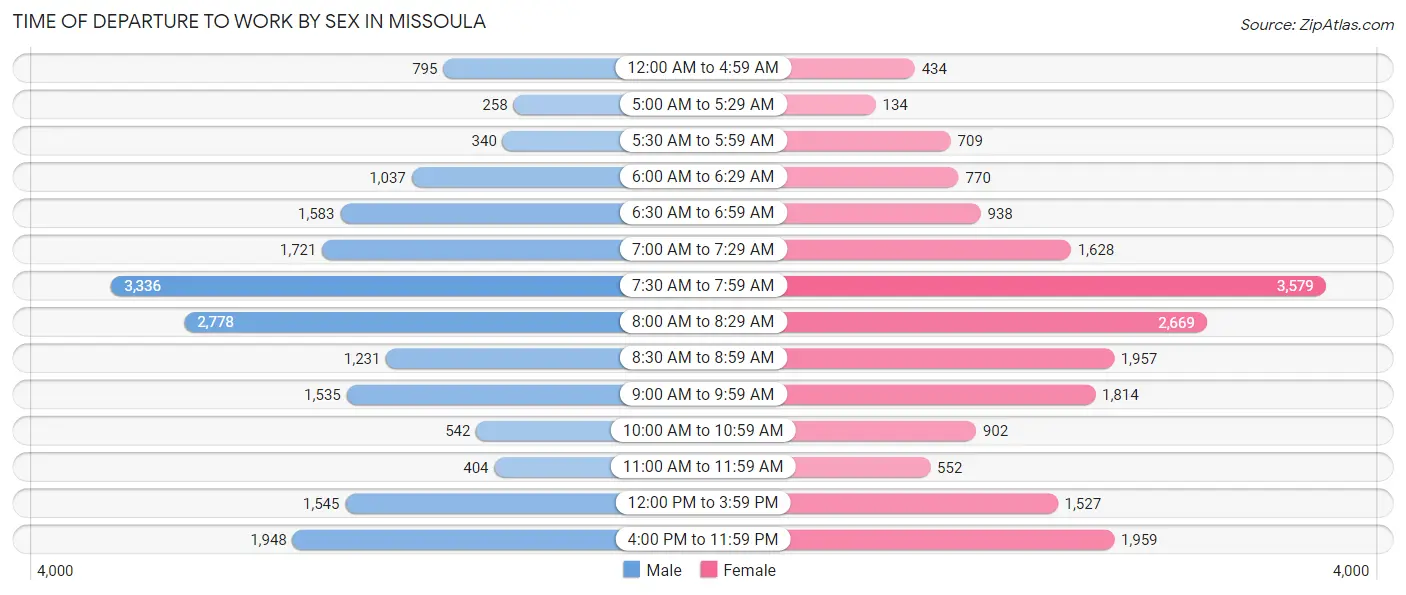
| Time of Departure | Male | Female |
| 12:00 AM to 4:59 AM | 795 (4.2%) | 434 (2.2%) |
| 5:00 AM to 5:29 AM | 258 (1.3%) | 134 (0.7%) |
| 5:30 AM to 5:59 AM | 340 (1.8%) | 709 (3.6%) |
| 6:00 AM to 6:29 AM | 1,037 (5.4%) | 770 (3.9%) |
| 6:30 AM to 6:59 AM | 1,583 (8.3%) | 938 (4.8%) |
| 7:00 AM to 7:29 AM | 1,721 (9.0%) | 1,628 (8.3%) |
| 7:30 AM to 7:59 AM | 3,336 (17.5%) | 3,579 (18.3%) |
| 8:00 AM to 8:29 AM | 2,778 (14.6%) | 2,669 (13.6%) |
| 8:30 AM to 8:59 AM | 1,231 (6.5%) | 1,957 (10.0%) |
| 9:00 AM to 9:59 AM | 1,535 (8.1%) | 1,814 (9.3%) |
| 10:00 AM to 10:59 AM | 542 (2.8%) | 902 (4.6%) |
| 11:00 AM to 11:59 AM | 404 (2.1%) | 552 (2.8%) |
| 12:00 PM to 3:59 PM | 1,545 (8.1%) | 1,527 (7.8%) |
| 4:00 PM to 11:59 PM | 1,948 (10.2%) | 1,959 (10.0%) |
| Total | 19,053 (100.0%) | 19,572 (100.0%) |
Housing Occupancy in Missoula
Occupancy by Ownership in Missoula
Of the total 32,944 dwellings in Missoula, owner-occupied units account for 15,444 (46.9%), while renter-occupied units make up 17,500 (53.1%).
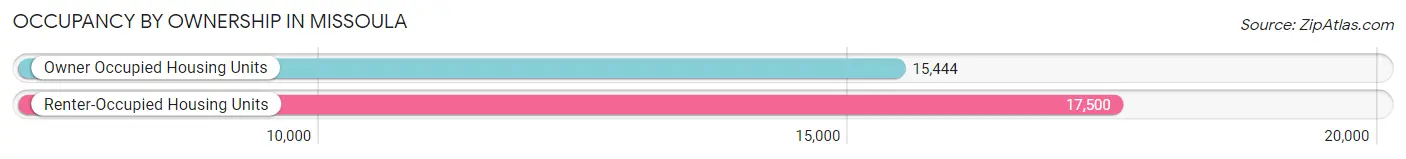
| Occupancy | # Housing Units | % Housing Units |
| Owner Occupied Housing Units | 15,444 | 46.9% |
| Renter-Occupied Housing Units | 17,500 | 53.1% |
| Total Occupied Housing Units | 32,944 | 100.0% |
Occupancy by Household Size in Missoula
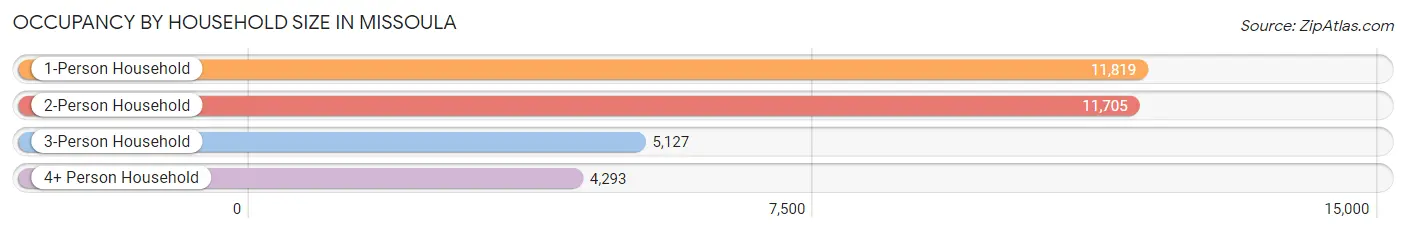
| Household Size | # Housing Units | % Housing Units |
| 1-Person Household | 11,819 | 35.9% |
| 2-Person Household | 11,705 | 35.5% |
| 3-Person Household | 5,127 | 15.6% |
| 4+ Person Household | 4,293 | 13.0% |
| Total Housing Units | 32,944 | 100.0% |
Occupancy by Ownership by Household Size in Missoula
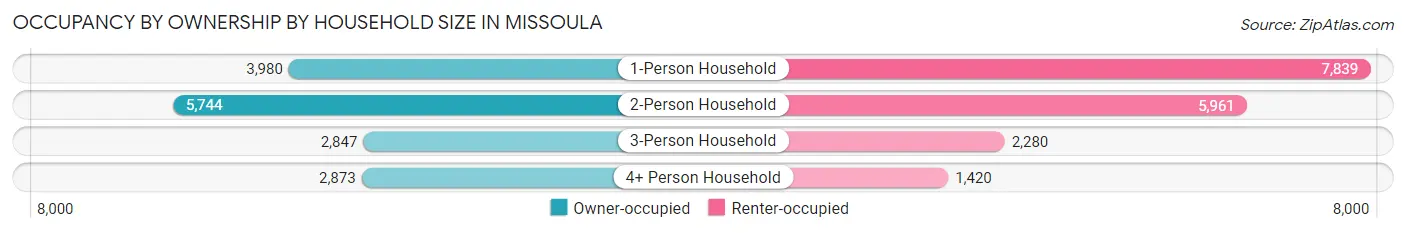
| Household Size | Owner-occupied | Renter-occupied |
| 1-Person Household | 3,980 (33.7%) | 7,839 (66.3%) |
| 2-Person Household | 5,744 (49.1%) | 5,961 (50.9%) |
| 3-Person Household | 2,847 (55.5%) | 2,280 (44.5%) |
| 4+ Person Household | 2,873 (66.9%) | 1,420 (33.1%) |
| Total Housing Units | 15,444 (46.9%) | 17,500 (53.1%) |
Occupancy by Educational Attainment in Missoula
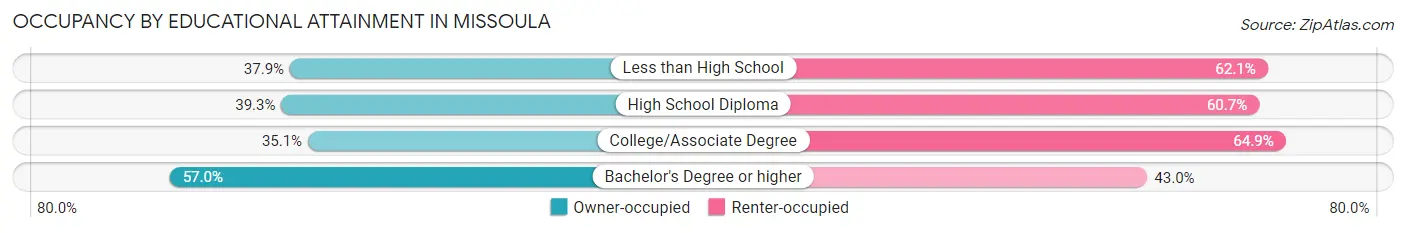
| Household Size | Owner-occupied | Renter-occupied |
| Less than High School | 295 (37.9%) | 483 (62.1%) |
| High School Diploma | 1,877 (39.3%) | 2,900 (60.7%) |
| College/Associate Degree | 3,732 (35.1%) | 6,914 (64.9%) |
| Bachelor's Degree or higher | 9,540 (57.0%) | 7,203 (43.0%) |
Occupancy by Age of Householder in Missoula
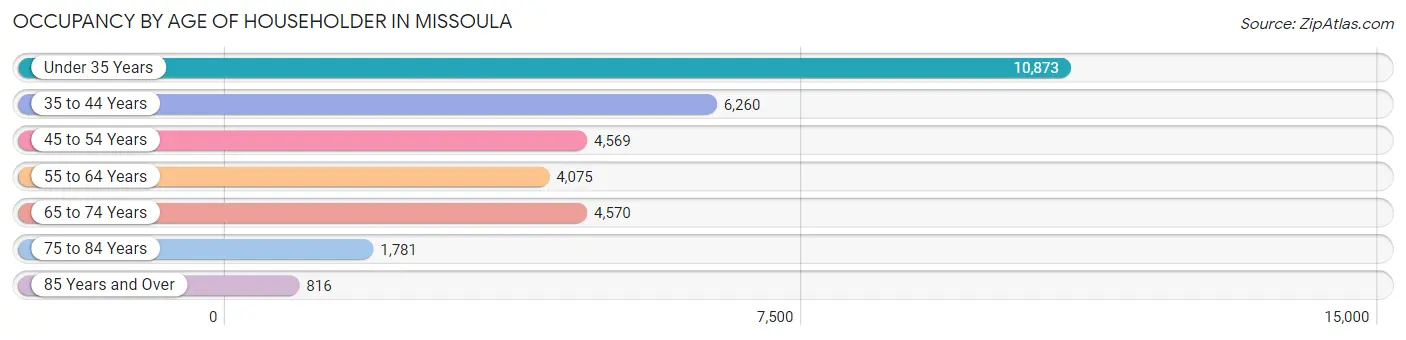
| Age Bracket | # Households | % Households |
| Under 35 Years | 10,873 | 33.0% |
| 35 to 44 Years | 6,260 | 19.0% |
| 45 to 54 Years | 4,569 | 13.9% |
| 55 to 64 Years | 4,075 | 12.4% |
| 65 to 74 Years | 4,570 | 13.9% |
| 75 to 84 Years | 1,781 | 5.4% |
| 85 Years and Over | 816 | 2.5% |
| Total | 32,944 | 100.0% |
Housing Finances in Missoula
Median Income by Occupancy in Missoula
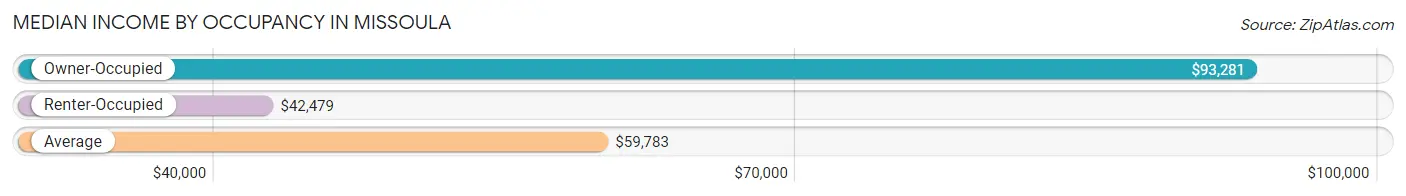
| Occupancy Type | # Households | Median Income |
| Owner-Occupied | 15,444 (46.9%) | $93,281 |
| Renter-Occupied | 17,500 (53.1%) | $42,479 |
| Average | 32,944 (100.0%) | $59,783 |
Occupancy by Householder Income Bracket in Missoula
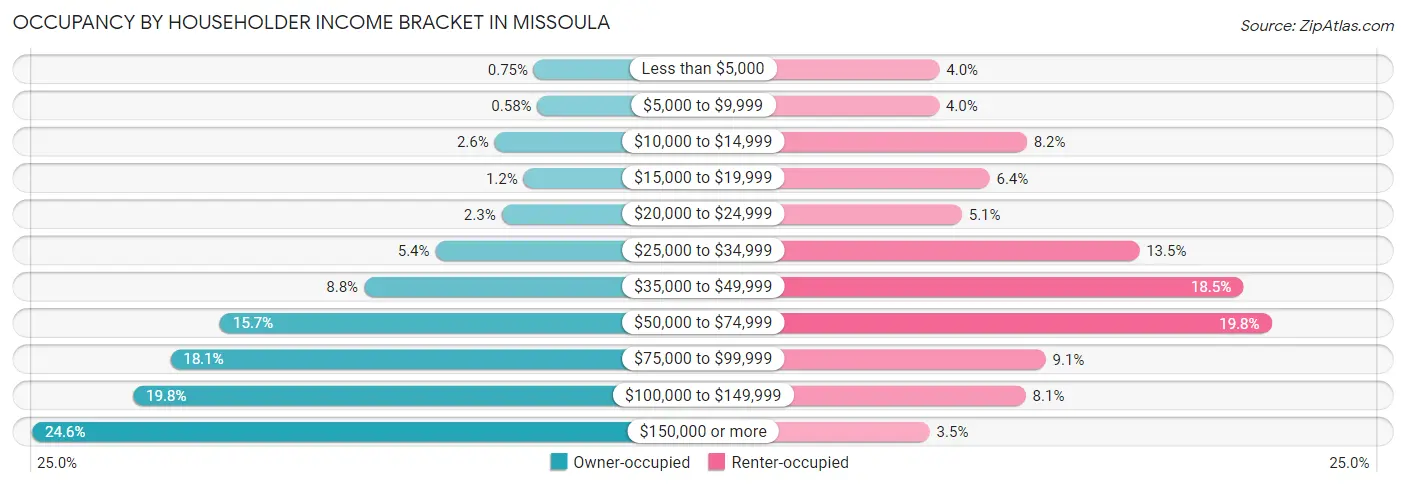
| Income Bracket | Owner-occupied | Renter-occupied |
| Less than $5,000 | 116 (0.7%) | 699 (4.0%) |
| $5,000 to $9,999 | 89 (0.6%) | 695 (4.0%) |
| $10,000 to $14,999 | 405 (2.6%) | 1,427 (8.2%) |
| $15,000 to $19,999 | 192 (1.2%) | 1,117 (6.4%) |
| $20,000 to $24,999 | 353 (2.3%) | 886 (5.1%) |
| $25,000 to $34,999 | 840 (5.4%) | 2,364 (13.5%) |
| $35,000 to $49,999 | 1,366 (8.8%) | 3,228 (18.4%) |
| $50,000 to $74,999 | 2,425 (15.7%) | 3,465 (19.8%) |
| $75,000 to $99,999 | 2,789 (18.1%) | 1,584 (9.0%) |
| $100,000 to $149,999 | 3,063 (19.8%) | 1,417 (8.1%) |
| $150,000 or more | 3,806 (24.6%) | 618 (3.5%) |
| Total | 15,444 (100.0%) | 17,500 (100.0%) |
Monthly Housing Cost Tiers in Missoula
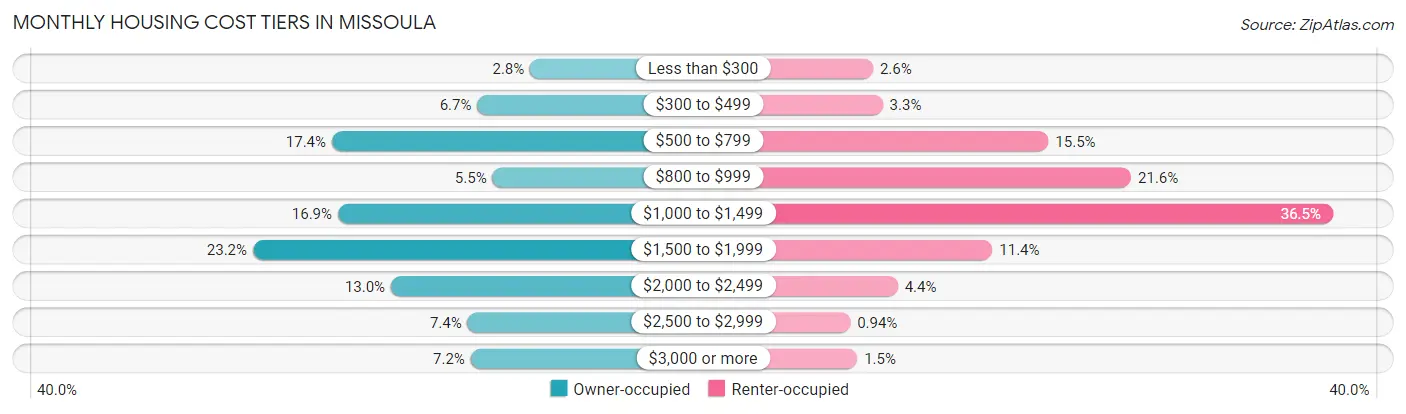
| Monthly Cost | Owner-occupied | Renter-occupied |
| Less than $300 | 428 (2.8%) | 458 (2.6%) |
| $300 to $499 | 1,028 (6.7%) | 582 (3.3%) |
| $500 to $799 | 2,683 (17.4%) | 2,719 (15.5%) |
| $800 to $999 | 855 (5.5%) | 3,786 (21.6%) |
| $1,000 to $1,499 | 2,615 (16.9%) | 6,384 (36.5%) |
| $1,500 to $1,999 | 3,581 (23.2%) | 1,996 (11.4%) |
| $2,000 to $2,499 | 2,011 (13.0%) | 777 (4.4%) |
| $2,500 to $2,999 | 1,139 (7.4%) | 164 (0.9%) |
| $3,000 or more | 1,104 (7.1%) | 255 (1.5%) |
| Total | 15,444 (100.0%) | 17,500 (100.0%) |
Physical Housing Characteristics in Missoula
Housing Structures in Missoula
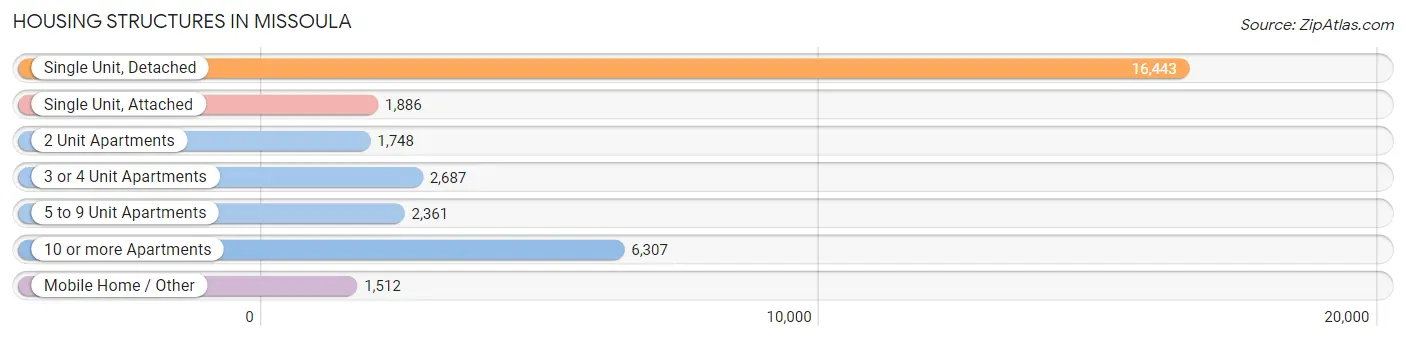
| Structure Type | # Housing Units | % Housing Units |
| Single Unit, Detached | 16,443 | 49.9% |
| Single Unit, Attached | 1,886 | 5.7% |
| 2 Unit Apartments | 1,748 | 5.3% |
| 3 or 4 Unit Apartments | 2,687 | 8.2% |
| 5 to 9 Unit Apartments | 2,361 | 7.2% |
| 10 or more Apartments | 6,307 | 19.1% |
| Mobile Home / Other | 1,512 | 4.6% |
| Total | 32,944 | 100.0% |
Housing Structures by Occupancy in Missoula
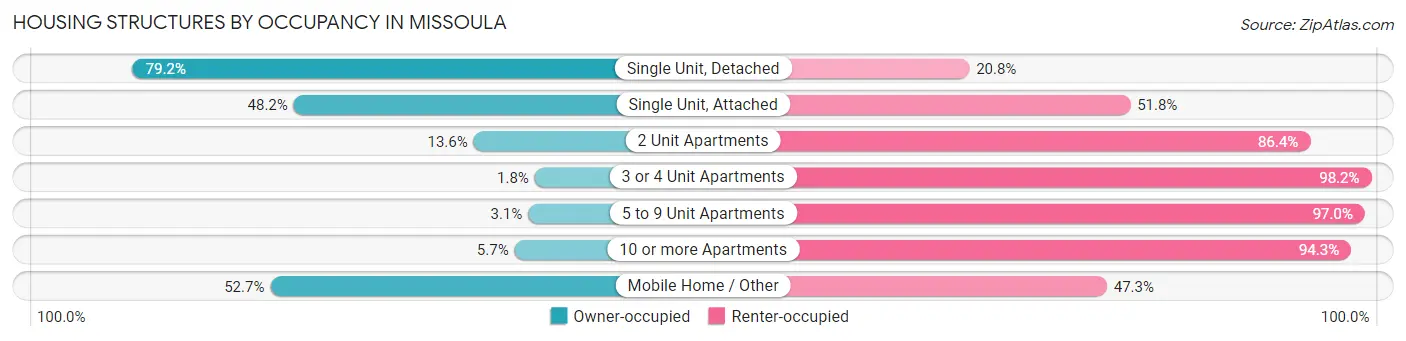
| Structure Type | Owner-occupied | Renter-occupied |
| Single Unit, Detached | 13,023 (79.2%) | 3,420 (20.8%) |
| Single Unit, Attached | 909 (48.2%) | 977 (51.8%) |
| 2 Unit Apartments | 237 (13.6%) | 1,511 (86.4%) |
| 3 or 4 Unit Apartments | 48 (1.8%) | 2,639 (98.2%) |
| 5 to 9 Unit Apartments | 72 (3.0%) | 2,289 (97.0%) |
| 10 or more Apartments | 358 (5.7%) | 5,949 (94.3%) |
| Mobile Home / Other | 797 (52.7%) | 715 (47.3%) |
| Total | 15,444 (46.9%) | 17,500 (53.1%) |
Housing Structures by Number of Rooms in Missoula
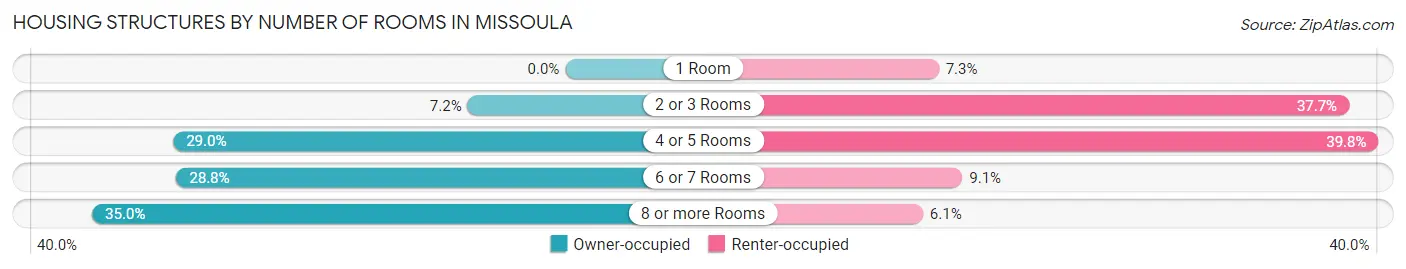
| Number of Rooms | Owner-occupied | Renter-occupied |
| 1 Room | 0 (0.0%) | 1,280 (7.3%) |
| 2 or 3 Rooms | 1,117 (7.2%) | 6,590 (37.7%) |
| 4 or 5 Rooms | 4,478 (29.0%) | 6,970 (39.8%) |
| 6 or 7 Rooms | 4,443 (28.8%) | 1,586 (9.1%) |
| 8 or more Rooms | 5,406 (35.0%) | 1,074 (6.1%) |
| Total | 15,444 (100.0%) | 17,500 (100.0%) |
Housing Structure by Heating Type in Missoula
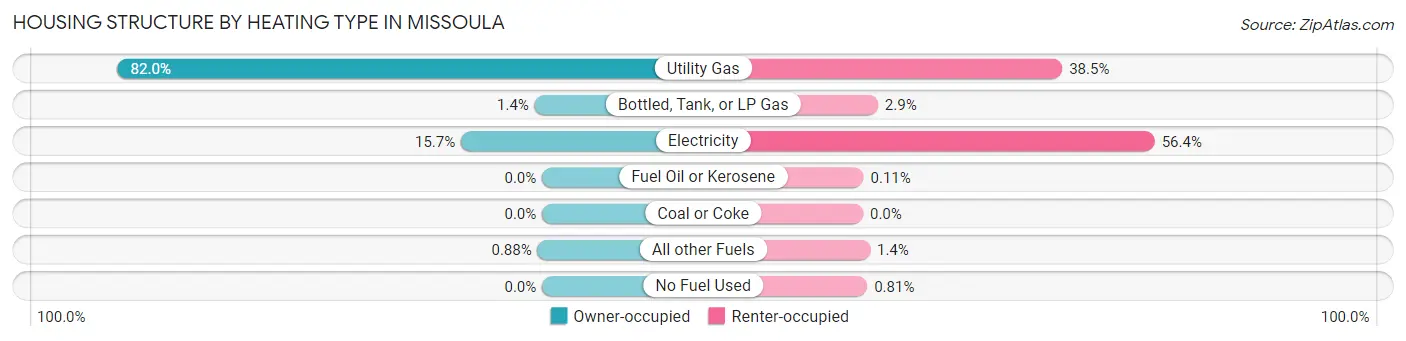
| Heating Type | Owner-occupied | Renter-occupied |
| Utility Gas | 12,665 (82.0%) | 6,735 (38.5%) |
| Bottled, Tank, or LP Gas | 223 (1.4%) | 502 (2.9%) |
| Electricity | 2,420 (15.7%) | 9,864 (56.4%) |
| Fuel Oil or Kerosene | 0 (0.0%) | 20 (0.1%) |
| Coal or Coke | 0 (0.0%) | 0 (0.0%) |
| All other Fuels | 136 (0.9%) | 237 (1.3%) |
| No Fuel Used | 0 (0.0%) | 142 (0.8%) |
| Total | 15,444 (100.0%) | 17,500 (100.0%) |
Household Vehicle Usage in Missoula
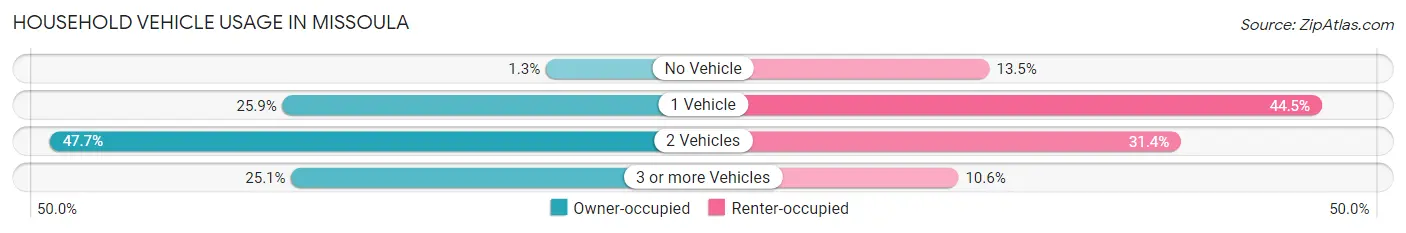
| Vehicles per Household | Owner-occupied | Renter-occupied |
| No Vehicle | 206 (1.3%) | 2,362 (13.5%) |
| 1 Vehicle | 4,003 (25.9%) | 7,791 (44.5%) |
| 2 Vehicles | 7,359 (47.6%) | 5,492 (31.4%) |
| 3 or more Vehicles | 3,876 (25.1%) | 1,855 (10.6%) |
| Total | 15,444 (100.0%) | 17,500 (100.0%) |
Real Estate & Mortgages in Missoula
Real Estate and Mortgage Overview in Missoula
| Characteristic | Without Mortgage | With Mortgage |
| Housing Units | 4,985 | 10,459 |
| Median Property Value | $357,100 | $388,000 |
| Median Household Income | $60,958 | $3,100 |
| Monthly Housing Costs | $624 | $1,061 |
| Real Estate Taxes | $3,612 | $46 |
Property Value by Mortgage Status in Missoula
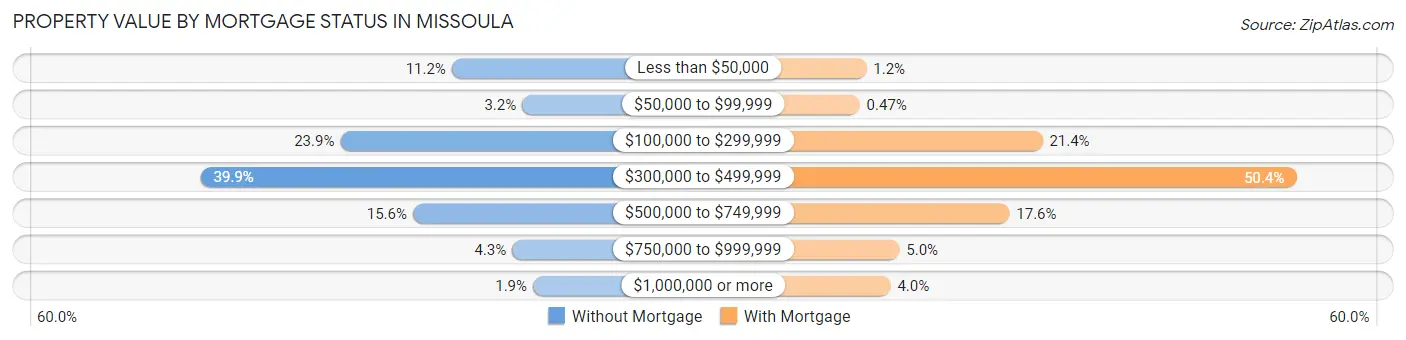
| Property Value | Without Mortgage | With Mortgage |
| Less than $50,000 | 558 (11.2%) | 129 (1.2%) |
| $50,000 to $99,999 | 157 (3.2%) | 49 (0.5%) |
| $100,000 to $299,999 | 1,193 (23.9%) | 2,234 (21.4%) |
| $300,000 to $499,999 | 1,989 (39.9%) | 5,267 (50.4%) |
| $500,000 to $749,999 | 779 (15.6%) | 1,839 (17.6%) |
| $750,000 to $999,999 | 214 (4.3%) | 524 (5.0%) |
| $1,000,000 or more | 95 (1.9%) | 417 (4.0%) |
| Total | 4,985 (100.0%) | 10,459 (100.0%) |
Household Income by Mortgage Status in Missoula
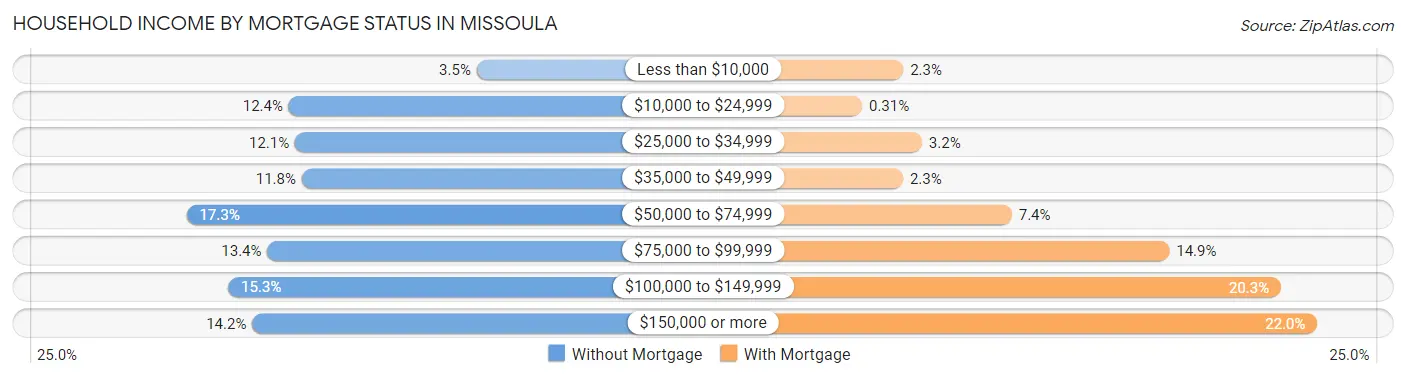
| Household Income | Without Mortgage | With Mortgage |
| Less than $10,000 | 173 (3.5%) | 237 (2.3%) |
| $10,000 to $24,999 | 619 (12.4%) | 32 (0.3%) |
| $25,000 to $34,999 | 604 (12.1%) | 331 (3.2%) |
| $35,000 to $49,999 | 588 (11.8%) | 236 (2.3%) |
| $50,000 to $74,999 | 862 (17.3%) | 778 (7.4%) |
| $75,000 to $99,999 | 670 (13.4%) | 1,563 (14.9%) |
| $100,000 to $149,999 | 763 (15.3%) | 2,119 (20.3%) |
| $150,000 or more | 706 (14.2%) | 2,300 (22.0%) |
| Total | 4,985 (100.0%) | 10,459 (100.0%) |
Property Value to Household Income Ratio in Missoula
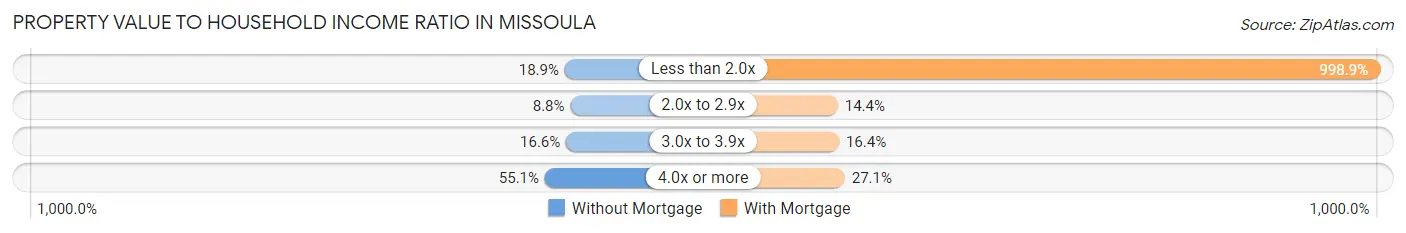
| Value-to-Income Ratio | Without Mortgage | With Mortgage |
| Less than 2.0x | 944 (18.9%) | 104,477 (998.9%) |
| 2.0x to 2.9x | 440 (8.8%) | 1,501 (14.3%) |
| 3.0x to 3.9x | 826 (16.6%) | 1,719 (16.4%) |
| 4.0x or more | 2,747 (55.1%) | 2,832 (27.1%) |
| Total | 4,985 (100.0%) | 10,459 (100.0%) |
Real Estate Taxes by Mortgage Status in Missoula
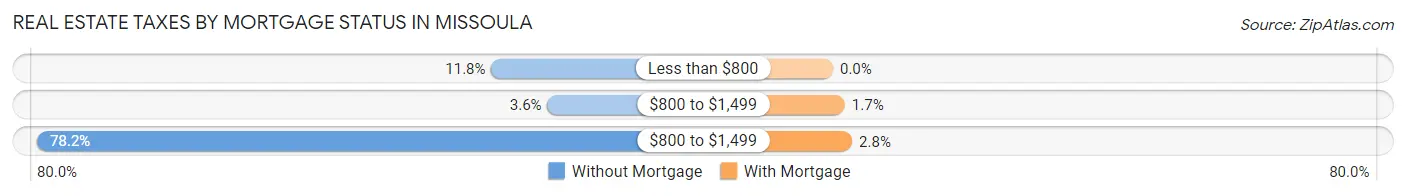
| Property Taxes | Without Mortgage | With Mortgage |
| Less than $800 | 588 (11.8%) | 0 (0.0%) |
| $800 to $1,499 | 180 (3.6%) | 181 (1.7%) |
| $800 to $1,499 | 3,898 (78.2%) | 292 (2.8%) |
| Total | 4,985 (100.0%) | 10,459 (100.0%) |
Health & Disability in Missoula
Health Insurance Coverage by Age in Missoula
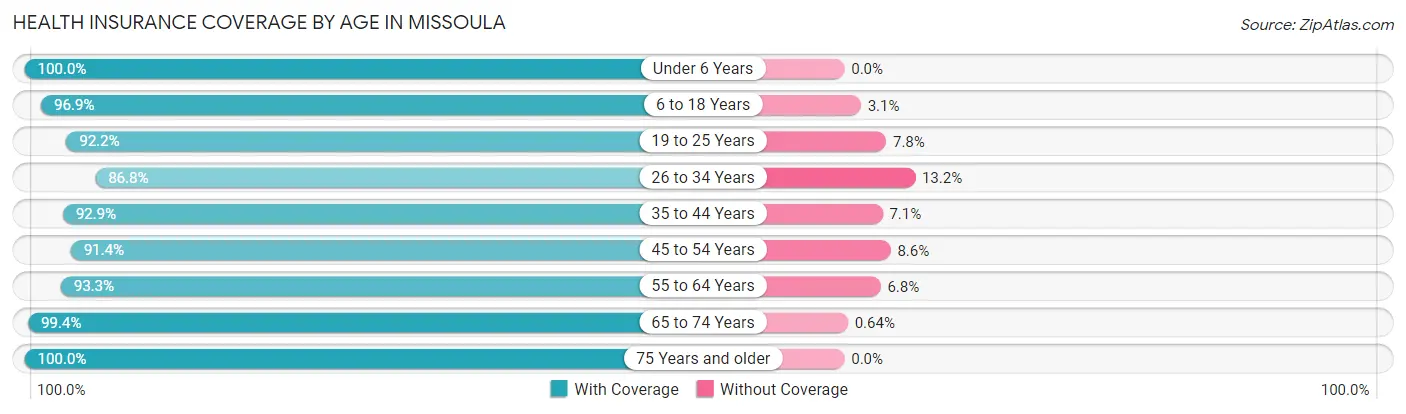
| Age Bracket | With Coverage | Without Coverage |
| Under 6 Years | 3,637 (100.0%) | 0 (0.0%) |
| 6 to 18 Years | 9,970 (96.9%) | 316 (3.1%) |
| 19 to 25 Years | 12,076 (92.2%) | 1,019 (7.8%) |
| 26 to 34 Years | 10,054 (86.8%) | 1,526 (13.2%) |
| 35 to 44 Years | 9,583 (92.9%) | 735 (7.1%) |
| 45 to 54 Years | 7,098 (91.4%) | 669 (8.6%) |
| 55 to 64 Years | 6,493 (93.2%) | 470 (6.8%) |
| 65 to 74 Years | 6,632 (99.4%) | 43 (0.6%) |
| 75 Years and older | 3,620 (100.0%) | 0 (0.0%) |
| Total | 69,163 (93.5%) | 4,778 (6.5%) |
Health Insurance Coverage by Citizenship Status in Missoula
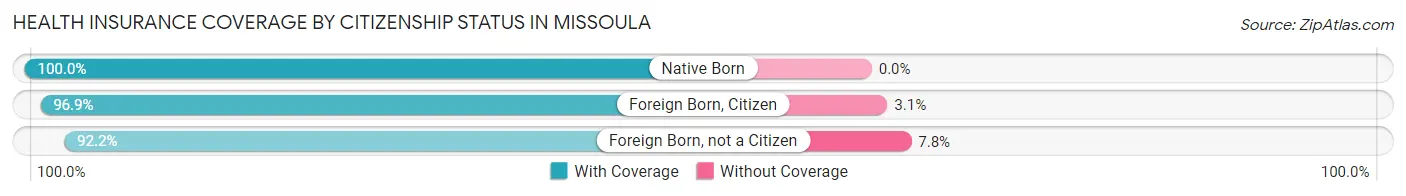
| Citizenship Status | With Coverage | Without Coverage |
| Native Born | 3,637 (100.0%) | 0 (0.0%) |
| Foreign Born, Citizen | 9,970 (96.9%) | 316 (3.1%) |
| Foreign Born, not a Citizen | 12,076 (92.2%) | 1,019 (7.8%) |
Health Insurance Coverage by Household Income in Missoula
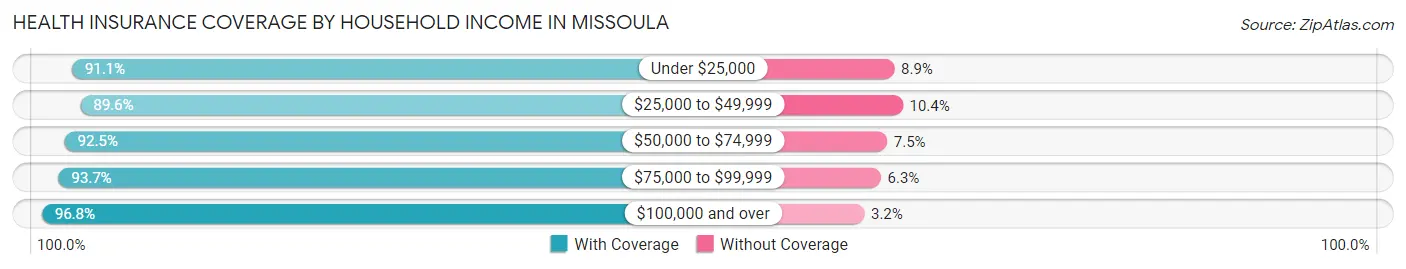
| Household Income | With Coverage | Without Coverage |
| Under $25,000 | 8,154 (91.1%) | 793 (8.9%) |
| $25,000 to $49,999 | 11,595 (89.6%) | 1,352 (10.4%) |
| $50,000 to $74,999 | 12,201 (92.5%) | 989 (7.5%) |
| $75,000 to $99,999 | 9,778 (93.7%) | 662 (6.3%) |
| $100,000 and over | 25,343 (96.8%) | 846 (3.2%) |
Public vs Private Health Insurance Coverage by Age in Missoula
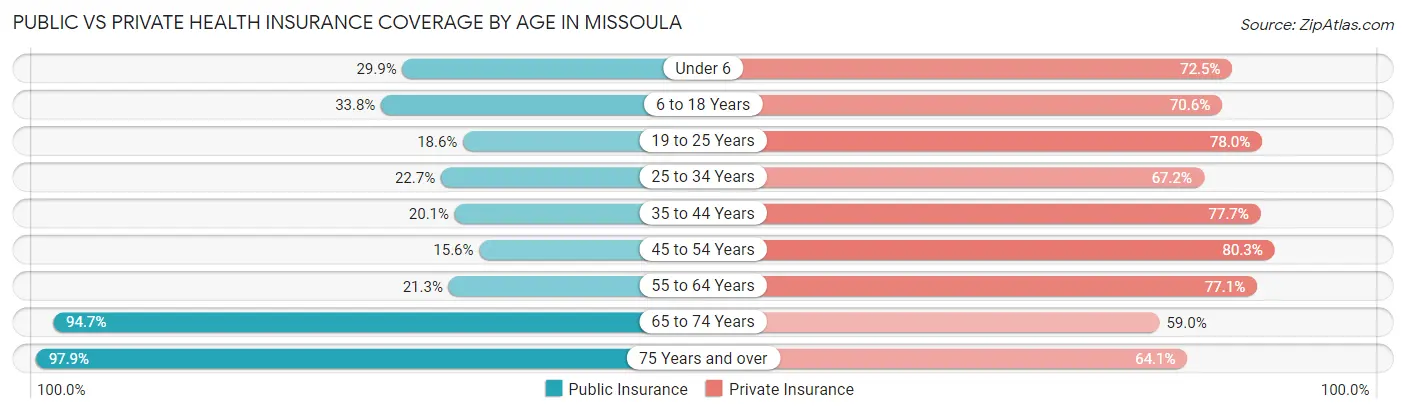
| Age Bracket | Public Insurance | Private Insurance |
| Under 6 | 1,086 (29.9%) | 2,636 (72.5%) |
| 6 to 18 Years | 3,478 (33.8%) | 7,258 (70.6%) |
| 19 to 25 Years | 2,434 (18.6%) | 10,215 (78.0%) |
| 25 to 34 Years | 2,630 (22.7%) | 7,779 (67.2%) |
| 35 to 44 Years | 2,078 (20.1%) | 8,020 (77.7%) |
| 45 to 54 Years | 1,211 (15.6%) | 6,239 (80.3%) |
| 55 to 64 Years | 1,481 (21.3%) | 5,366 (77.1%) |
| 65 to 74 Years | 6,321 (94.7%) | 3,936 (59.0%) |
| 75 Years and over | 3,545 (97.9%) | 2,321 (64.1%) |
| Total | 24,264 (32.8%) | 53,770 (72.7%) |
Disability Status by Sex by Age in Missoula
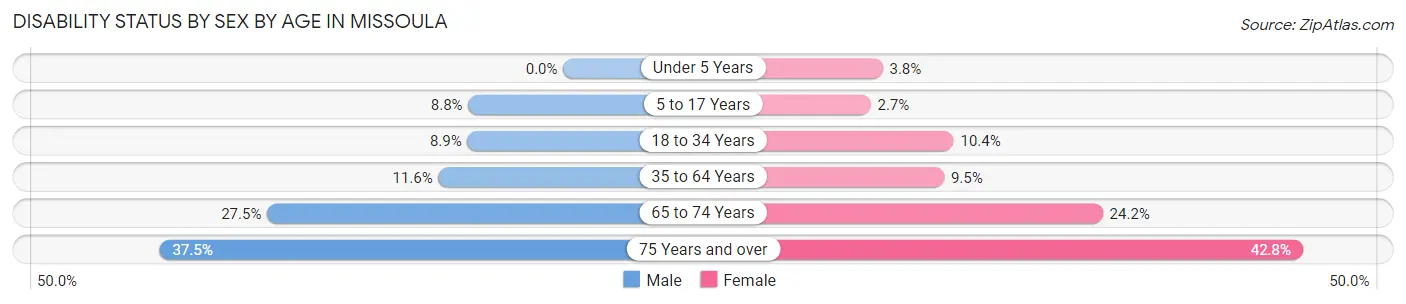
| Age Bracket | Male | Female |
| Under 5 Years | 0 (0.0%) | 59 (3.8%) |
| 5 to 17 Years | 431 (8.8%) | 125 (2.7%) |
| 18 to 34 Years | 1,145 (8.9%) | 1,358 (10.4%) |
| 35 to 64 Years | 1,419 (11.6%) | 1,213 (9.5%) |
| 65 to 74 Years | 892 (27.5%) | 830 (24.2%) |
| 75 Years and over | 578 (37.5%) | 889 (42.8%) |
Disability Class by Sex by Age in Missoula
Disability Class: Hearing Difficulty
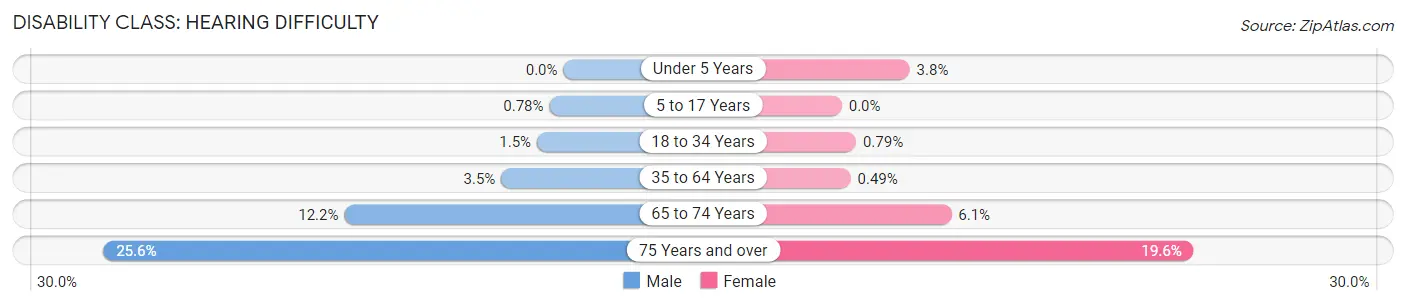
| Age Bracket | Male | Female |
| Under 5 Years | 0 (0.0%) | 59 (3.8%) |
| 5 to 17 Years | 38 (0.8%) | 0 (0.0%) |
| 18 to 34 Years | 189 (1.5%) | 103 (0.8%) |
| 35 to 64 Years | 424 (3.5%) | 63 (0.5%) |
| 65 to 74 Years | 396 (12.2%) | 209 (6.1%) |
| 75 Years and over | 395 (25.6%) | 407 (19.6%) |
Disability Class: Vision Difficulty
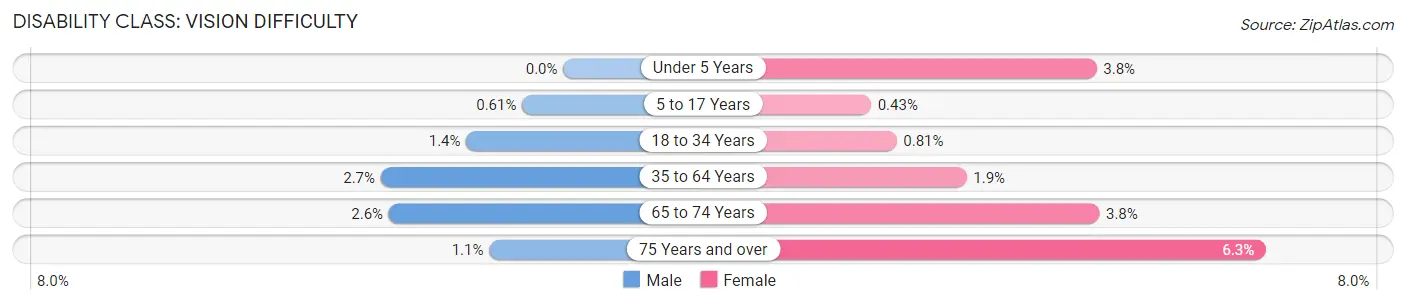
| Age Bracket | Male | Female |
| Under 5 Years | 0 (0.0%) | 59 (3.8%) |
| 5 to 17 Years | 30 (0.6%) | 20 (0.4%) |
| 18 to 34 Years | 186 (1.4%) | 106 (0.8%) |
| 35 to 64 Years | 332 (2.7%) | 237 (1.8%) |
| 65 to 74 Years | 84 (2.6%) | 131 (3.8%) |
| 75 Years and over | 17 (1.1%) | 131 (6.3%) |
Disability Class: Cognitive Difficulty
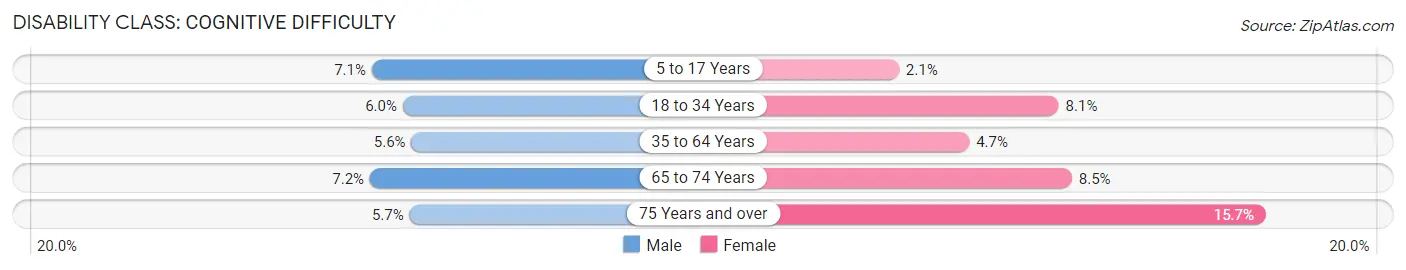
| Age Bracket | Male | Female |
| 5 to 17 Years | 348 (7.1%) | 99 (2.1%) |
| 18 to 34 Years | 768 (6.0%) | 1,055 (8.1%) |
| 35 to 64 Years | 691 (5.6%) | 605 (4.7%) |
| 65 to 74 Years | 233 (7.2%) | 293 (8.5%) |
| 75 Years and over | 88 (5.7%) | 327 (15.7%) |
Disability Class: Ambulatory Difficulty
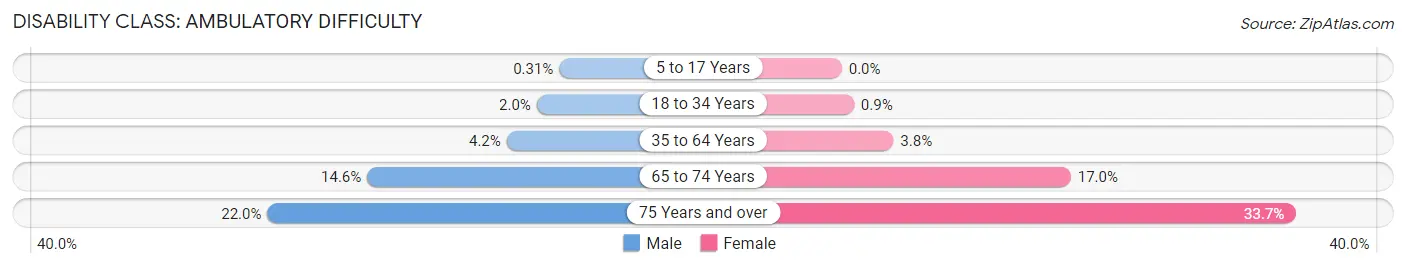
| Age Bracket | Male | Female |
| 5 to 17 Years | 15 (0.3%) | 0 (0.0%) |
| 18 to 34 Years | 255 (2.0%) | 118 (0.9%) |
| 35 to 64 Years | 516 (4.2%) | 490 (3.8%) |
| 65 to 74 Years | 473 (14.6%) | 583 (17.0%) |
| 75 Years and over | 339 (22.0%) | 701 (33.7%) |
Disability Class: Self-Care Difficulty
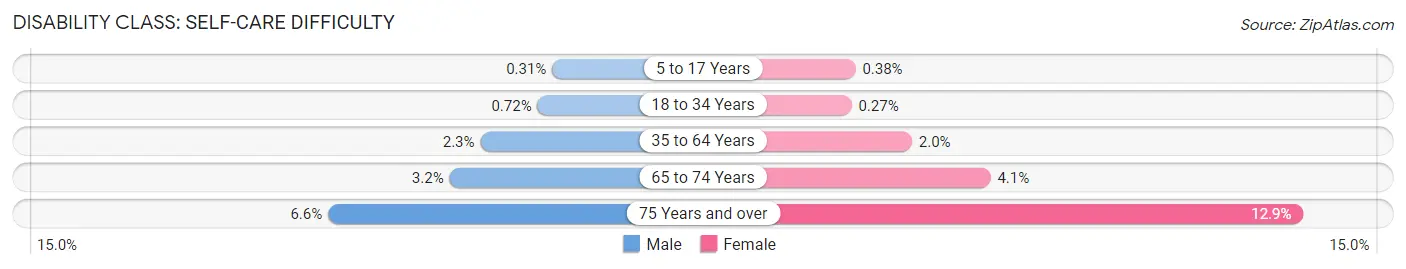
| Age Bracket | Male | Female |
| 5 to 17 Years | 15 (0.3%) | 18 (0.4%) |
| 18 to 34 Years | 93 (0.7%) | 36 (0.3%) |
| 35 to 64 Years | 283 (2.3%) | 249 (1.9%) |
| 65 to 74 Years | 103 (3.2%) | 142 (4.1%) |
| 75 Years and over | 101 (6.6%) | 267 (12.9%) |
Technology Access in Missoula
Computing Device Access in Missoula
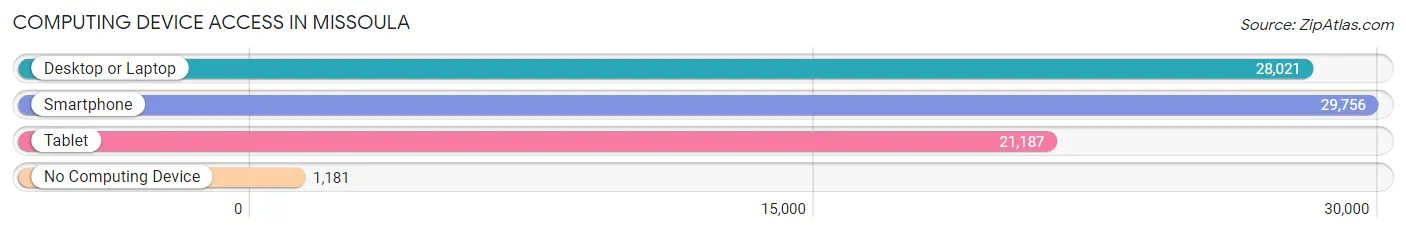
| Device Type | # Households | % Households |
| Desktop or Laptop | 28,021 | 85.1% |
| Smartphone | 29,756 | 90.3% |
| Tablet | 21,187 | 64.3% |
| No Computing Device | 1,181 | 3.6% |
| Total | 32,944 | 100.0% |
Internet Access in Missoula
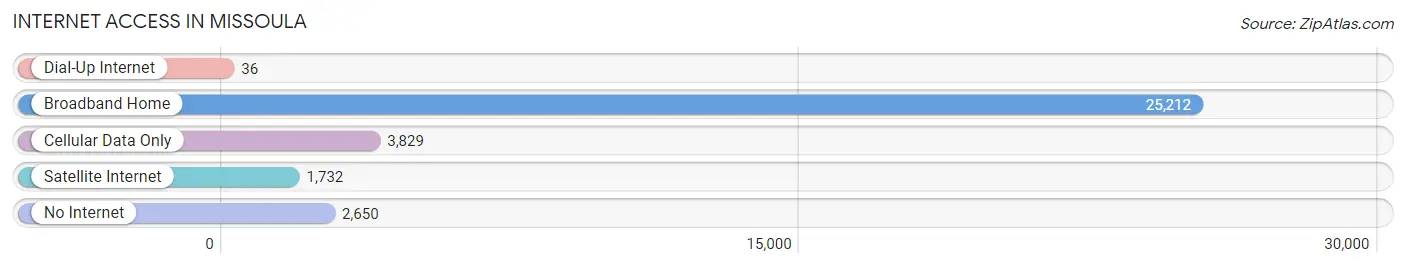
| Internet Type | # Households | % Households |
| Dial-Up Internet | 36 | 0.1% |
| Broadband Home | 25,212 | 76.5% |
| Cellular Data Only | 3,829 | 11.6% |
| Satellite Internet | 1,732 | 5.3% |
| No Internet | 2,650 | 8.0% |
| Total | 32,944 | 100.0% |
Missoula Summary
Missoula, Montana is a city located in the western part of the state, in the heart of the Rocky Mountains. It is the second largest city in Montana, with a population of approximately 71,000 people. The city is known for its vibrant culture, outdoor recreation, and its proximity to some of the most beautiful natural scenery in the United States.
Missoula is located in the Missoula Valley, which is surrounded by the Bitterroot Mountains to the east, the Sapphire Mountains to the west, and the Rattlesnake Mountains to the south. The city is situated at the confluence of the Clark Fork and Bitterroot Rivers, and is the county seat of Missoula County.
Missoula has a rich history, dating back to the early 1800s when it was inhabited by the Salish and Kootenai tribes. In the 1860s, the city was established as a trading post and later became a major stop on the Northern Pacific Railroad. The city was officially incorporated in 1877 and has since grown to become a major hub for commerce, education, and culture in the region.
The economy of Missoula is largely based on the service industry, with the University of Montana, St. Patrick Hospital, and the Missoula County Public Schools being the largest employers in the city. Other major industries include tourism, manufacturing, and retail. The city is also home to several technology companies, including RightNow Technologies, which is a major provider of customer relationship management software.
Missoula has a diverse population, with a median age of 33.7 years. The city is home to a variety of ethnic and racial groups, including Native Americans, African Americans, Asians, and Hispanics. The city also has a large student population, with the University of Montana enrolling over 11,000 students.
Missoula is a great place to live, work, and play. The city is home to a variety of outdoor activities, including hiking, camping, fishing, and skiing. The city also has a vibrant arts and culture scene, with a variety of museums, galleries, and theaters. The city is also home to a variety of festivals and events throughout the year, including the International Wildlife Film Festival and the Missoula Marathon.
Missoula is a great place to call home, with its beautiful scenery, vibrant culture, and diverse population. The city is a great place to live, work, and play, and is sure to provide a great quality of life for its residents.
Common Questions
What is Per Capita Income in Missoula?
Per Capita income in Missoula is $39,374.
What is the Median Family Income in Missoula?
Median Family Income in Missoula is $87,915.
What is the Median Household income in Missoula?
Median Household Income in Missoula is $59,783.
What is Income or Wage Gap in Missoula?
Income or Wage Gap in Missoula is 11.9%.
Women in Missoula earn 88.1 cents for every dollar earned by a man.
What is Family Income Deficit in Missoula?
Family Income Deficit in Missoula is $9,346.
Families that are below poverty line in Missoula earn $9,346 less on average than the poverty threshold level.
What is Inequality or Gini Index in Missoula?
Inequality or Gini Index in Missoula is 0.48.
What is the Total Population of Missoula?
Total Population of Missoula is 74,627.
What is the Total Male Population of Missoula?
Total Male Population of Missoula is 36,687.
What is the Total Female Population of Missoula?
Total Female Population of Missoula is 37,940.
What is the Ratio of Males per 100 Females in Missoula?
There are 96.70 Males per 100 Females in Missoula.
What is the Ratio of Females per 100 Males in Missoula?
There are 103.42 Females per 100 Males in Missoula.
What is the Median Population Age in Missoula?
Median Population Age in Missoula is 34.0 Years.
What is the Average Family Size in Missoula
Average Family Size in Missoula is 2.9 People.
What is the Average Household Size in Missoula
Average Household Size in Missoula is 2.2 People.
How Large is the Labor Force in Missoula?
There are 46,291 People in the Labor Forcein in Missoula.
What is the Percentage of People in the Labor Force in Missoula?
73.2% of People are in the Labor Force in Missoula.
What is the Unemployment Rate in Missoula?
Unemployment Rate in Missoula is 4.6%.