Absarokee, MT Map & Demographics
Absarokee Map
Absarokee Overview
$46,624
PER CAPITA INCOME
$58,576
AVG FAMILY INCOME
$56,786
AVG HOUSEHOLD INCOME
0.53
INEQUALITY / GINI INDEX
869
TOTAL POPULATION
415
MALE POPULATION
454
FEMALE POPULATION
91.41
MALES / 100 FEMALES
109.40
FEMALES / 100 MALES
49.7
MEDIAN AGE
2.6
AVG FAMILY SIZE
2.0
AVG HOUSEHOLD SIZE
427
LABOR FORCE [ PEOPLE ]
59.4%
PERCENT IN LABOR FORCE
Absarokee Zip Codes
Absarokee Area Codes
Income in Absarokee
Income Overview in Absarokee
Per Capita Income in Absarokee is $46,624, while median incomes of families and households are $58,576 and $56,786 respectively.
| Characteristic | Number | Measure |
| Per Capita Income | 869 | $46,624 |
| Median Family Income | 263 | $58,576 |
| Mean Family Income | 263 | $91,552 |
| Median Household Income | 424 | $56,786 |
| Mean Household Income | 424 | $96,707 |
| Income Deficit | 263 | $0 |
| Wage / Income Gap (%) | 869 | 0.00% |
| Wage / Income Gap ($) | 869 | 100.00¢ per $1 |
| Gini / Inequality Index | 869 | 0.53 |
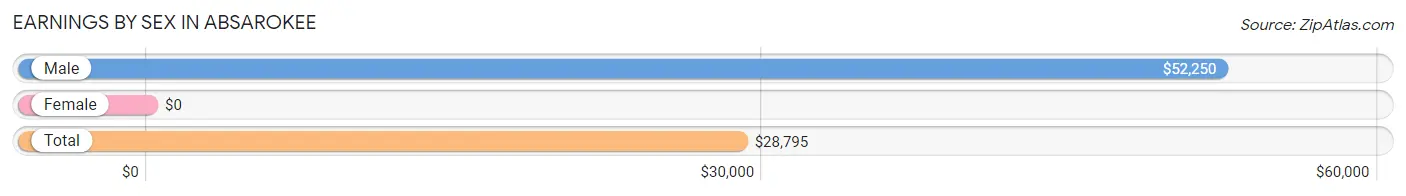
Earnings by Sex in Absarokee
| Sex | Number | Average Earnings |
| Male | 237 (50.5%) | $52,250 |
| Female | 232 (49.5%) | $0 |
| Total | 469 (100.0%) | $28,795 |
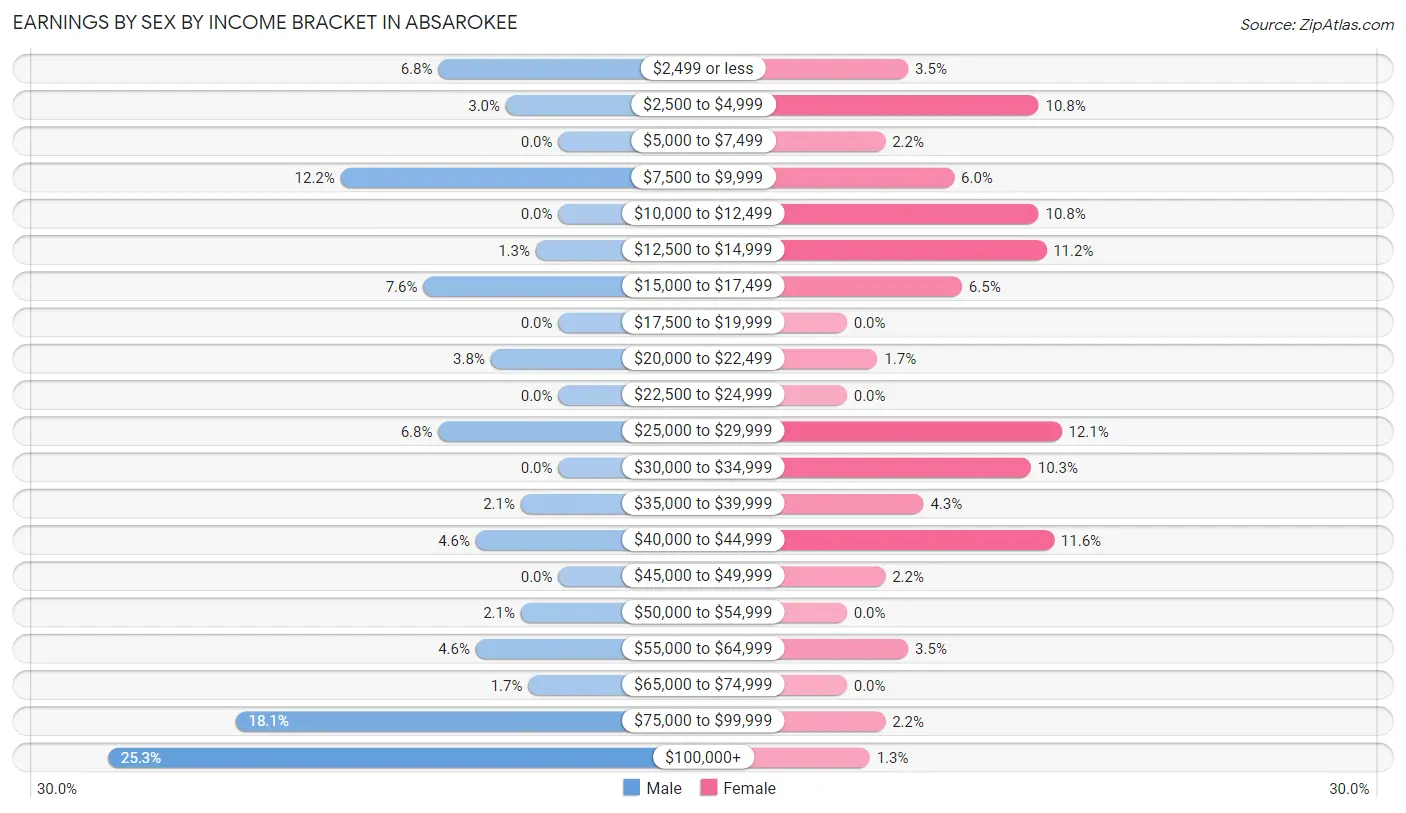
Earnings by Sex by Income Bracket in Absarokee
The most common earnings brackets in Absarokee are $100,000+ for men (60 | 25.3%) and $25,000 to $29,999 for women (28 | 12.1%).
| Income | Male | Female |
| $2,499 or less | 16 (6.8%) | 8 (3.5%) |
| $2,500 to $4,999 | 7 (2.9%) | 25 (10.8%) |
| $5,000 to $7,499 | 0 (0.0%) | 5 (2.2%) |
| $7,500 to $9,999 | 29 (12.2%) | 14 (6.0%) |
| $10,000 to $12,499 | 0 (0.0%) | 25 (10.8%) |
| $12,500 to $14,999 | 3 (1.3%) | 26 (11.2%) |
| $15,000 to $17,499 | 18 (7.6%) | 15 (6.5%) |
| $17,500 to $19,999 | 0 (0.0%) | 0 (0.0%) |
| $20,000 to $22,499 | 9 (3.8%) | 4 (1.7%) |
| $22,500 to $24,999 | 0 (0.0%) | 0 (0.0%) |
| $25,000 to $29,999 | 16 (6.8%) | 28 (12.1%) |
| $30,000 to $34,999 | 0 (0.0%) | 24 (10.3%) |
| $35,000 to $39,999 | 5 (2.1%) | 10 (4.3%) |
| $40,000 to $44,999 | 11 (4.6%) | 27 (11.6%) |
| $45,000 to $49,999 | 0 (0.0%) | 5 (2.2%) |
| $50,000 to $54,999 | 5 (2.1%) | 0 (0.0%) |
| $55,000 to $64,999 | 11 (4.6%) | 8 (3.5%) |
| $65,000 to $74,999 | 4 (1.7%) | 0 (0.0%) |
| $75,000 to $99,999 | 43 (18.1%) | 5 (2.2%) |
| $100,000+ | 60 (25.3%) | 3 (1.3%) |
| Total | 237 (100.0%) | 232 (100.0%) |
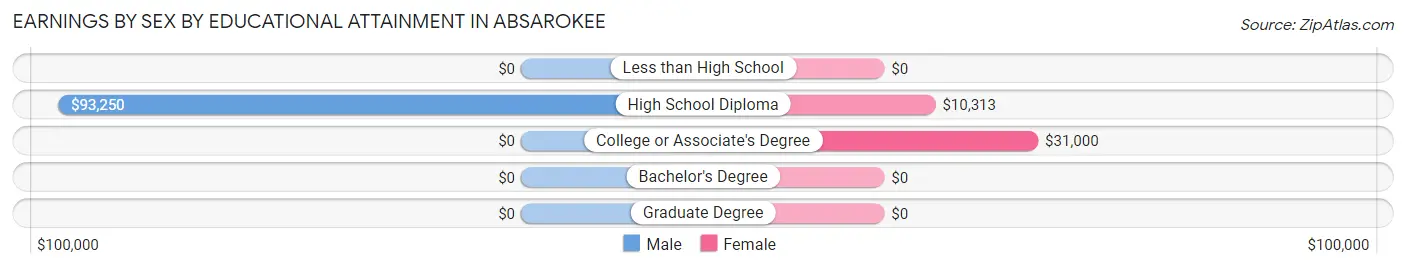
Earnings by Sex by Educational Attainment in Absarokee
Average earnings in Absarokee are $66,250 for men and $28,036 for women, a difference of 57.7%. Men with an educational attainment of high school diploma enjoy the highest average annual earnings of $93,250, while those with high school diploma education earn the least with $93,250. Women with an educational attainment of college or associate's degree earn the most with the average annual earnings of $31,000, while those with high school diploma education have the smallest earnings of $10,313.
| Educational Attainment | Male Income | Female Income |
| Less than High School | - | - |
| High School Diploma | $93,250 | $10,313 |
| College or Associate's Degree | - | - |
| Bachelor's Degree | - | - |
| Graduate Degree | - | - |
| Total | $66,250 | $28,036 |
Family Income in Absarokee
Family Income Brackets in Absarokee
According to the Absarokee family income data, there are 55 families falling into the $25,000 to $34,999 income range, which is the most common income bracket and makes up 20.9% of all families.
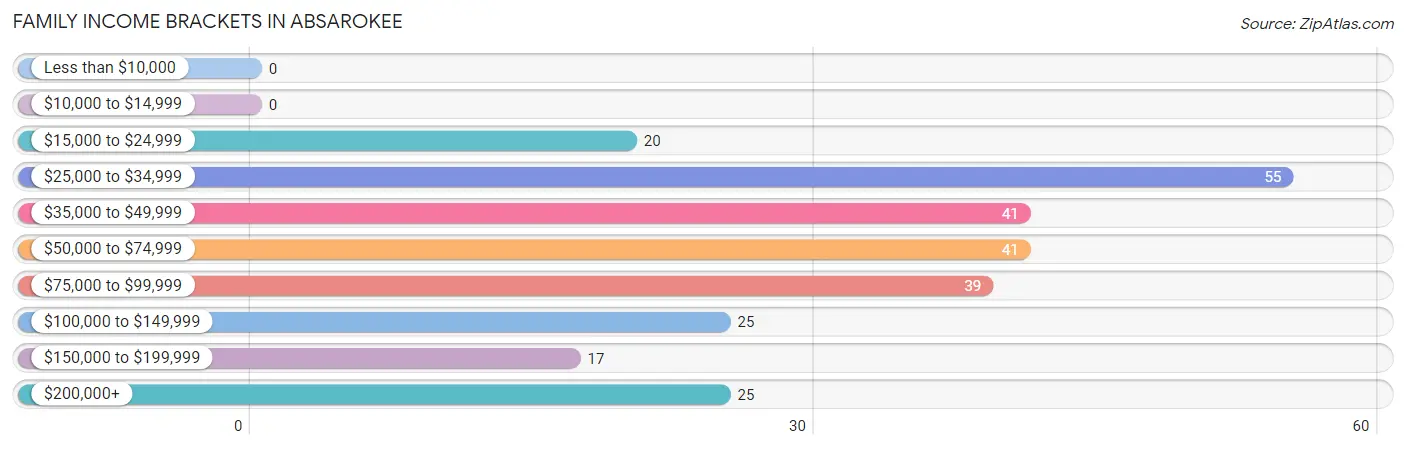
| Income Bracket | # Families | % Families |
| Less than $10,000 | 0 | 0.0% |
| $10,000 to $14,999 | 0 | 0.0% |
| $15,000 to $24,999 | 20 | 7.6% |
| $25,000 to $34,999 | 55 | 20.9% |
| $35,000 to $49,999 | 41 | 15.6% |
| $50,000 to $74,999 | 41 | 15.6% |
| $75,000 to $99,999 | 39 | 14.8% |
| $100,000 to $149,999 | 25 | 9.5% |
| $150,000 to $199,999 | 17 | 6.5% |
| $200,000+ | 25 | 9.5% |
Family Income by Famaliy Size in Absarokee
4-person families (31 | 11.8%) account for the highest median family income in Absarokee with $250,001 per family, while 4-person families (31 | 11.8%) have the highest median income of $62,500 per family member.
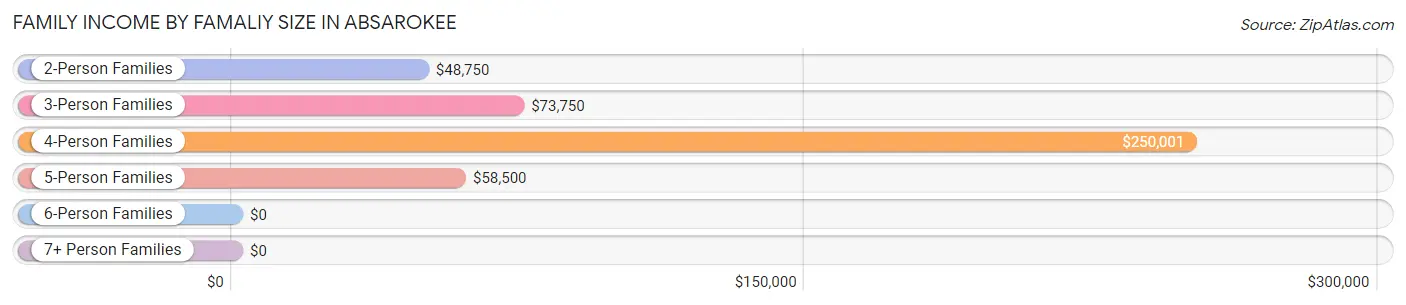
| Income Bracket | # Families | Median Income |
| 2-Person Families | 174 (66.2%) | $48,750 |
| 3-Person Families | 29 (11.0%) | $73,750 |
| 4-Person Families | 31 (11.8%) | $250,001 |
| 5-Person Families | 26 (9.9%) | $58,500 |
| 6-Person Families | 3 (1.1%) | $0 |
| 7+ Person Families | 0 (0.0%) | $0 |
| Total | 263 (100.0%) | $58,576 |
Family Income by Number of Earners in Absarokee
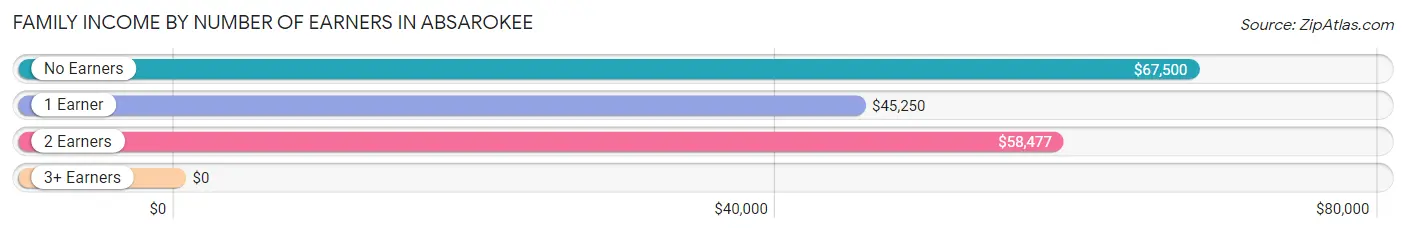
| Number of Earners | # Families | Median Income |
| No Earners | 60 (22.8%) | $67,500 |
| 1 Earner | 55 (20.9%) | $45,250 |
| 2 Earners | 141 (53.6%) | $58,477 |
| 3+ Earners | 7 (2.7%) | $0 |
| Total | 263 (100.0%) | $58,576 |
Household Income in Absarokee
Household Income Brackets in Absarokee
With 82 households falling in the category, the $75,000 to $99,999 income range is the most frequent in Absarokee, accounting for 19.3% of all households. In contrast, only 2 households (0.5%) fall into the less than $10,000 income bracket, making it the least populous group.
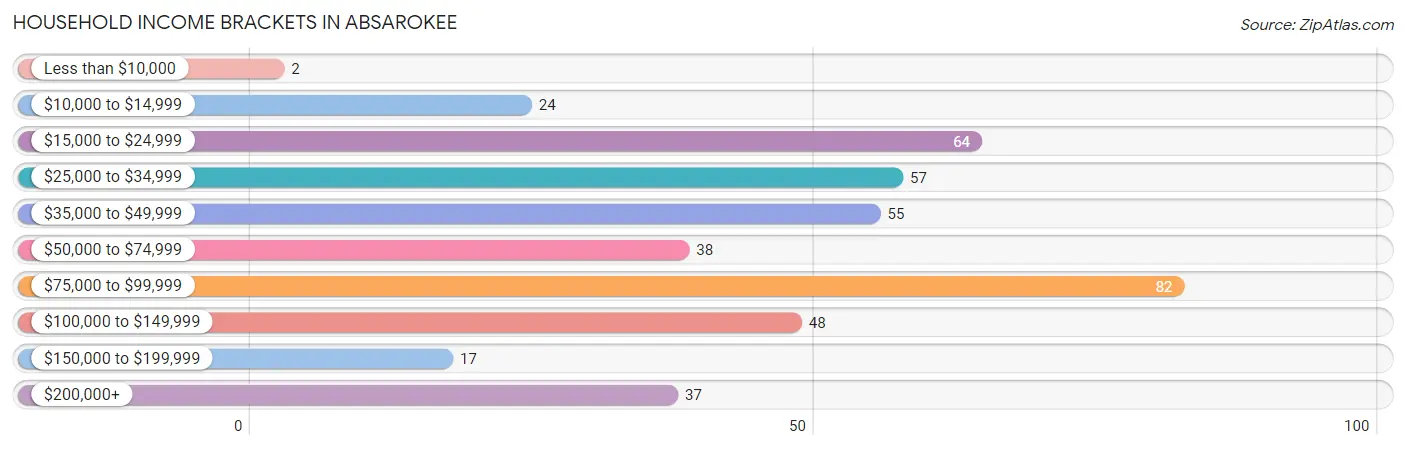
| Income Bracket | # Households | % Households |
| Less than $10,000 | 2 | 0.5% |
| $10,000 to $14,999 | 24 | 5.7% |
| $15,000 to $24,999 | 64 | 15.1% |
| $25,000 to $34,999 | 57 | 13.4% |
| $35,000 to $49,999 | 55 | 13.0% |
| $50,000 to $74,999 | 38 | 9.0% |
| $75,000 to $99,999 | 82 | 19.3% |
| $100,000 to $149,999 | 48 | 11.3% |
| $150,000 to $199,999 | 17 | 4.0% |
| $200,000+ | 37 | 8.7% |
Household Income by Householder Age in Absarokee
The median household income in Absarokee is $56,786, with the highest median household income of $77,457 found in the 45 to 64 years age bracket for the primary householder. A total of 147 households (34.7%) fall into this category. Meanwhile, the 15 to 24 years age bracket for the primary householder has the lowest median household income of $0, with 43 households (10.1%) in this group.
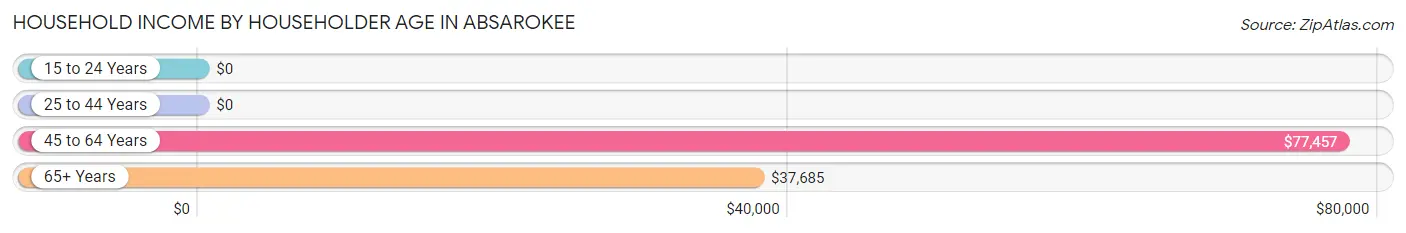
| Income Bracket | # Households | Median Income |
| 15 to 24 Years | 43 (10.1%) | $0 |
| 25 to 44 Years | 60 (14.1%) | $0 |
| 45 to 64 Years | 147 (34.7%) | $77,457 |
| 65+ Years | 174 (41.0%) | $37,685 |
| Total | 424 (100.0%) | $56,786 |
Poverty in Absarokee
Income Below Poverty by Sex and Age in Absarokee
With 4.9% poverty level for males and 15.0% for females among the residents of Absarokee, under 5 year old males and 6 to 11 year old females are the most vulnerable to poverty, with 8 males (18.2%) and 12 females (34.3%) in their respective age groups living below the poverty level.
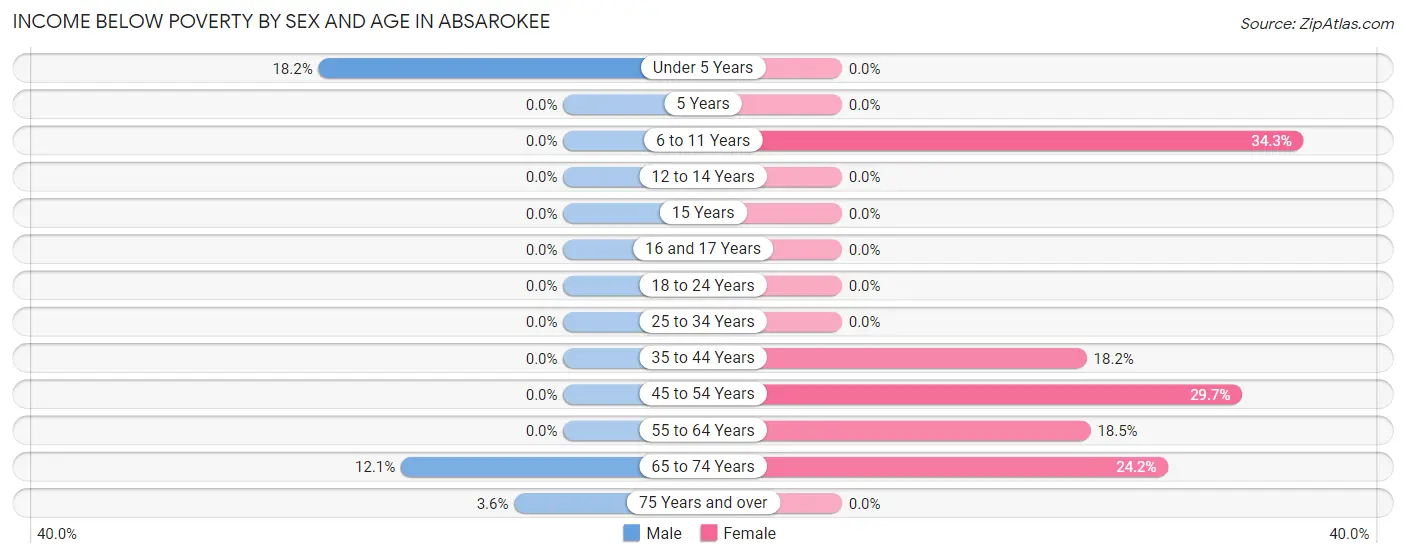
| Age Bracket | Male | Female |
| Under 5 Years | 8 (18.2%) | 0 (0.0%) |
| 5 Years | 0 (0.0%) | 0 (0.0%) |
| 6 to 11 Years | 0 (0.0%) | 12 (34.3%) |
| 12 to 14 Years | 0 (0.0%) | 0 (0.0%) |
| 15 Years | 0 (0.0%) | 0 (0.0%) |
| 16 and 17 Years | 0 (0.0%) | 0 (0.0%) |
| 18 to 24 Years | 0 (0.0%) | 0 (0.0%) |
| 25 to 34 Years | 0 (0.0%) | 0 (0.0%) |
| 35 to 44 Years | 0 (0.0%) | 8 (18.2%) |
| 45 to 54 Years | 0 (0.0%) | 11 (29.7%) |
| 55 to 64 Years | 0 (0.0%) | 12 (18.5%) |
| 65 to 74 Years | 10 (12.0%) | 24 (24.2%) |
| 75 Years and over | 2 (3.6%) | 0 (0.0%) |
| Total | 20 (4.9%) | 67 (15.0%) |
Income Above Poverty by Sex and Age in Absarokee
According to the poverty statistics in Absarokee, males aged 6 to 11 years and females aged under 5 years are the age groups that are most secure financially, with 100.0% of males and 100.0% of females in these age groups living above the poverty line.
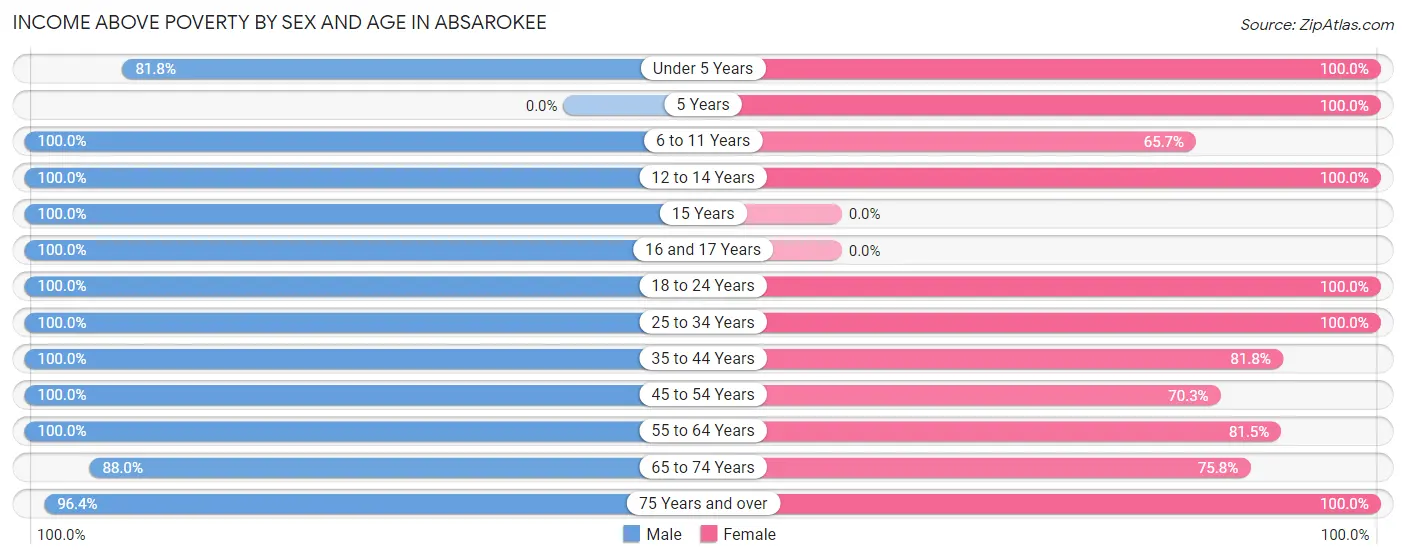
| Age Bracket | Male | Female |
| Under 5 Years | 36 (81.8%) | 2 (100.0%) |
| 5 Years | 0 (0.0%) | 5 (100.0%) |
| 6 to 11 Years | 4 (100.0%) | 23 (65.7%) |
| 12 to 14 Years | 5 (100.0%) | 28 (100.0%) |
| 15 Years | 15 (100.0%) | 0 (0.0%) |
| 16 and 17 Years | 7 (100.0%) | 0 (0.0%) |
| 18 to 24 Years | 16 (100.0%) | 68 (100.0%) |
| 25 to 34 Years | 26 (100.0%) | 31 (100.0%) |
| 35 to 44 Years | 51 (100.0%) | 36 (81.8%) |
| 45 to 54 Years | 34 (100.0%) | 26 (70.3%) |
| 55 to 64 Years | 71 (100.0%) | 53 (81.5%) |
| 65 to 74 Years | 73 (87.9%) | 75 (75.8%) |
| 75 Years and over | 53 (96.4%) | 32 (100.0%) |
| Total | 391 (95.1%) | 379 (85.0%) |
Income Below Poverty Among Married-Couple Families in Absarokee
The poverty statistics for married-couple families in Absarokee show that 5.4% or 12 of the total 223 families live below the poverty line. Families with no children have the highest poverty rate of 6.9%, comprising of 12 families. On the other hand, families with 1 or 2 children have the lowest poverty rate of 0.0%, which includes 0 families.
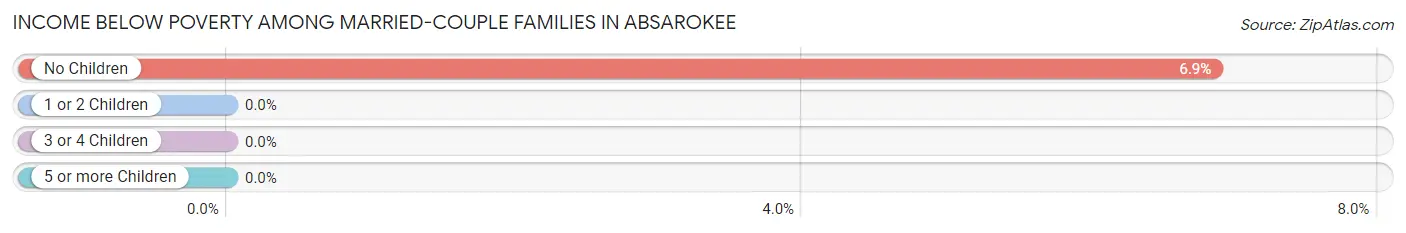
| Children | Above Poverty | Below Poverty |
| No Children | 163 (93.1%) | 12 (6.9%) |
| 1 or 2 Children | 34 (100.0%) | 0 (0.0%) |
| 3 or 4 Children | 14 (100.0%) | 0 (0.0%) |
| 5 or more Children | 0 (0.0%) | 0 (0.0%) |
| Total | 211 (94.6%) | 12 (5.4%) |
Income Below Poverty Among Single-Parent Households in Absarokee
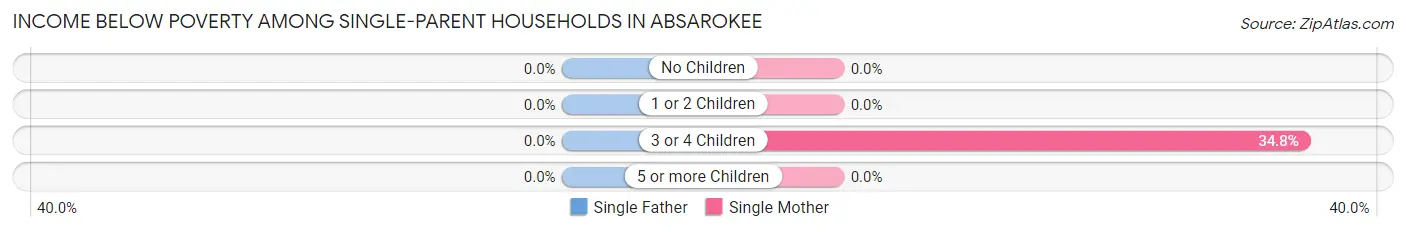
| Children | Single Father | Single Mother |
| No Children | 0 (0.0%) | 0 (0.0%) |
| 1 or 2 Children | 0 (0.0%) | 0 (0.0%) |
| 3 or 4 Children | 0 (0.0%) | 8 (34.8%) |
| 5 or more Children | 0 (0.0%) | 0 (0.0%) |
| Total | 0 (0.0%) | 8 (20.0%) |
Income Below Poverty Among Married-Couple vs Single-Parent Households in Absarokee
The poverty data for Absarokee shows that 12 of the married-couple family households (5.4%) and 8 of the single-parent households (20.0%) are living below the poverty level. Within the married-couple family households, those with no children have the highest poverty rate, with 12 households (6.9%) falling below the poverty line. Among the single-parent households, those with 3 or 4 children have the highest poverty rate, with 8 household (34.8%) living below poverty.
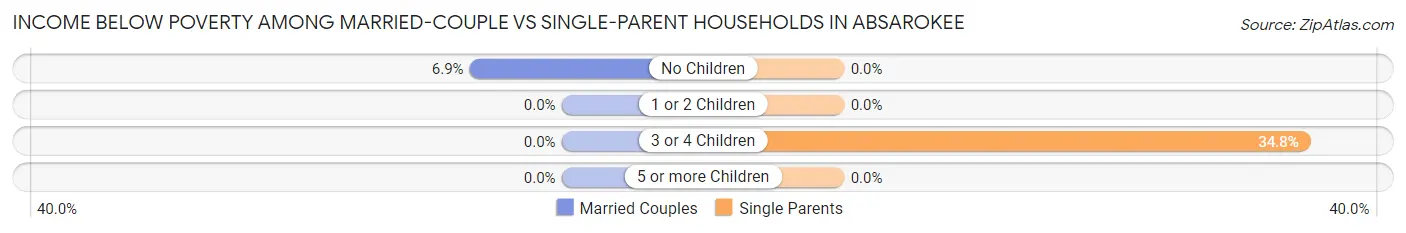
| Children | Married-Couple Families | Single-Parent Households |
| No Children | 12 (6.9%) | 0 (0.0%) |
| 1 or 2 Children | 0 (0.0%) | 0 (0.0%) |
| 3 or 4 Children | 0 (0.0%) | 8 (34.8%) |
| 5 or more Children | 0 (0.0%) | 0 (0.0%) |
| Total | 12 (5.4%) | 8 (20.0%) |
Race in Absarokee
The most populous races in Absarokee are White / Caucasian (793 | 91.2%), Two or more Races (76 | 8.7%), and Hispanic or Latino (3 | 0.4%).
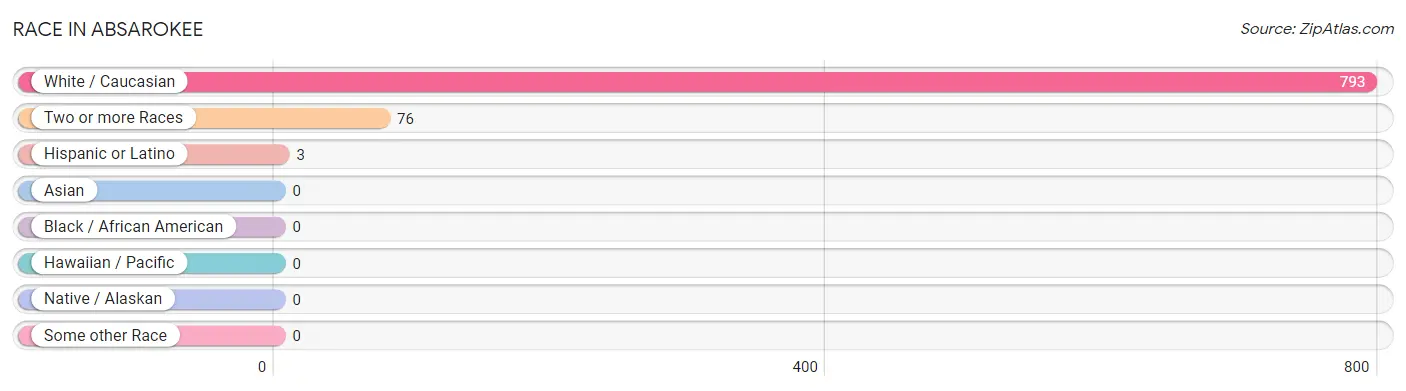
| Race | # Population | % Population |
| Asian | 0 | 0.0% |
| Black / African American | 0 | 0.0% |
| Hawaiian / Pacific | 0 | 0.0% |
| Hispanic or Latino | 3 | 0.4% |
| Native / Alaskan | 0 | 0.0% |
| White / Caucasian | 793 | 91.2% |
| Two or more Races | 76 | 8.7% |
| Some other Race | 0 | 0.0% |
| Total | 869 | 100.0% |
Ancestry in Absarokee
The most populous ancestries reported in Absarokee are German (314 | 36.1%), Irish (172 | 19.8%), English (122 | 14.0%), Norwegian (92 | 10.6%), and Dutch (90 | 10.4%), together accounting for 90.9% of all Absarokee residents.
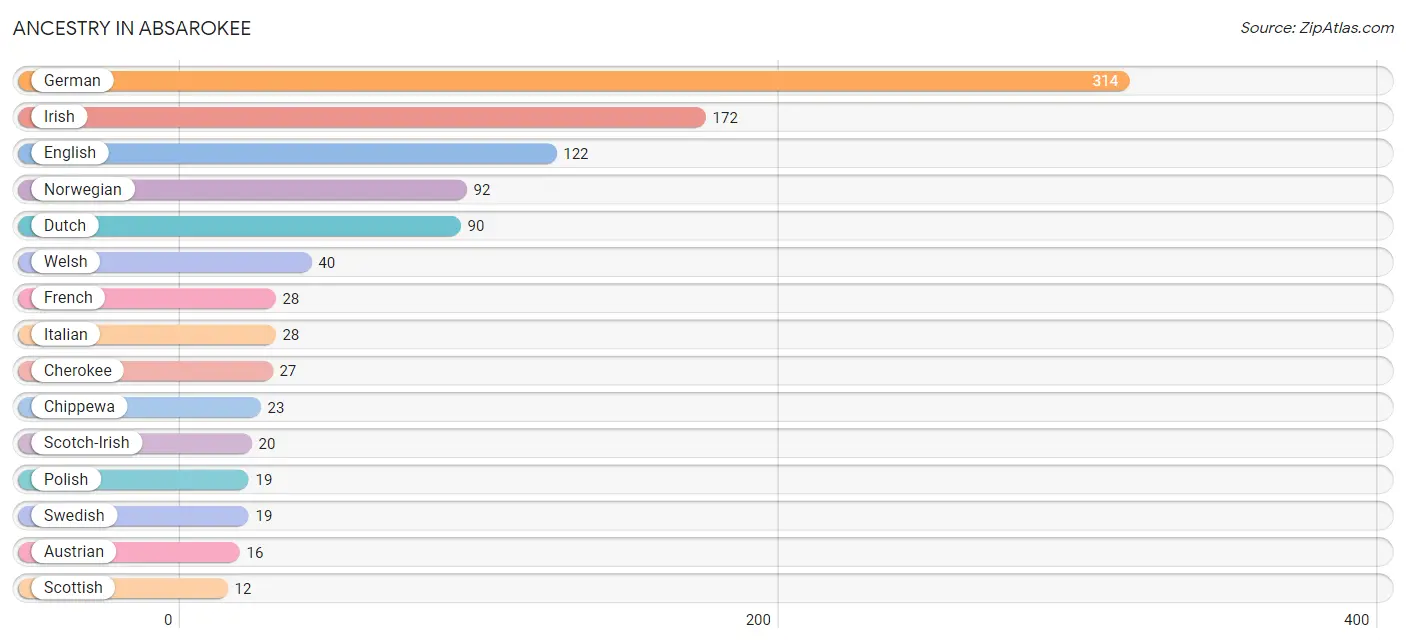
| Ancestry | # Population | % Population |
| Austrian | 16 | 1.8% |
| Cherokee | 27 | 3.1% |
| Chippewa | 23 | 2.6% |
| Dutch | 90 | 10.4% |
| English | 122 | 14.0% |
| Finnish | 4 | 0.5% |
| French | 28 | 3.2% |
| French Canadian | 6 | 0.7% |
| German | 314 | 36.1% |
| Irish | 172 | 19.8% |
| Italian | 28 | 3.2% |
| Mexican | 3 | 0.4% |
| Norwegian | 92 | 10.6% |
| Polish | 19 | 2.2% |
| Scotch-Irish | 20 | 2.3% |
| Scottish | 12 | 1.4% |
| Shoshone | 3 | 0.4% |
| Swedish | 19 | 2.2% |
| Welsh | 40 | 4.6% |
| Yugoslavian | 8 | 0.9% | View All 20 Rows |
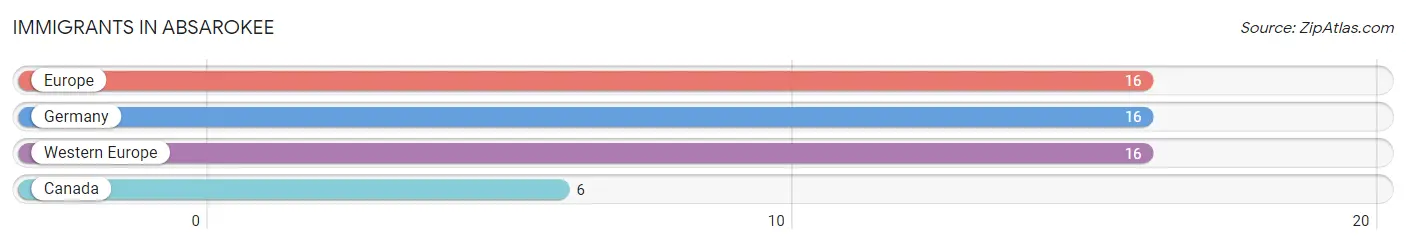
Immigrants in Absarokee
The most numerous immigrant groups reported in Absarokee came from Europe (16 | 1.8%), Germany (16 | 1.8%), Western Europe (16 | 1.8%), and Canada (6 | 0.7%), together accounting for 6.2% of all Absarokee residents.
| Immigration Origin | # Population | % Population |
| Canada | 6 | 0.7% |
| Europe | 16 | 1.8% |
| Germany | 16 | 1.8% |
| Western Europe | 16 | 1.8% | View All 4 Rows |
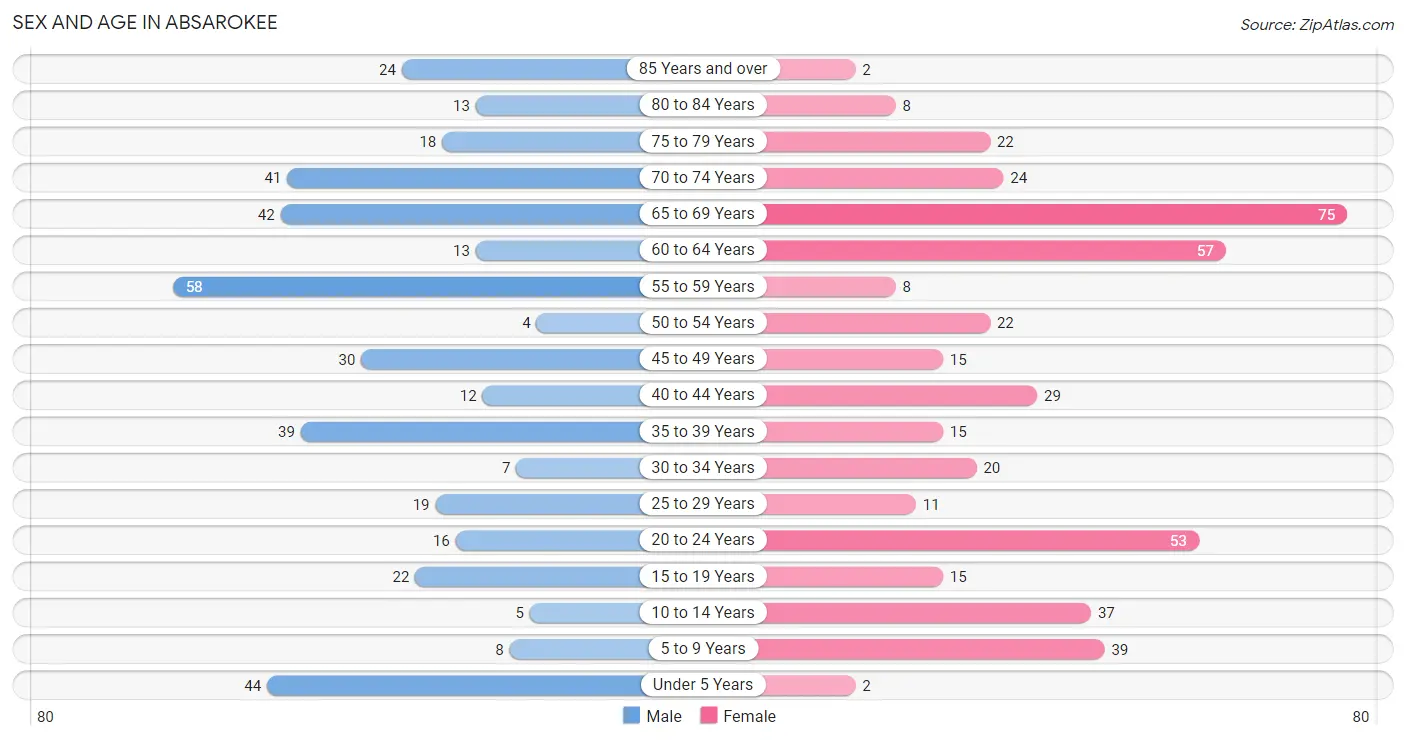
Sex and Age in Absarokee
Sex and Age in Absarokee
The most populous age groups in Absarokee are 55 to 59 Years (58 | 14.0%) for men and 65 to 69 Years (75 | 16.5%) for women.
| Age Bracket | Male | Female |
| Under 5 Years | 44 (10.6%) | 2 (0.4%) |
| 5 to 9 Years | 8 (1.9%) | 39 (8.6%) |
| 10 to 14 Years | 5 (1.2%) | 37 (8.2%) |
| 15 to 19 Years | 22 (5.3%) | 15 (3.3%) |
| 20 to 24 Years | 16 (3.9%) | 53 (11.7%) |
| 25 to 29 Years | 19 (4.6%) | 11 (2.4%) |
| 30 to 34 Years | 7 (1.7%) | 20 (4.4%) |
| 35 to 39 Years | 39 (9.4%) | 15 (3.3%) |
| 40 to 44 Years | 12 (2.9%) | 29 (6.4%) |
| 45 to 49 Years | 30 (7.2%) | 15 (3.3%) |
| 50 to 54 Years | 4 (1.0%) | 22 (4.9%) |
| 55 to 59 Years | 58 (14.0%) | 8 (1.8%) |
| 60 to 64 Years | 13 (3.1%) | 57 (12.6%) |
| 65 to 69 Years | 42 (10.1%) | 75 (16.5%) |
| 70 to 74 Years | 41 (9.9%) | 24 (5.3%) |
| 75 to 79 Years | 18 (4.3%) | 22 (4.9%) |
| 80 to 84 Years | 13 (3.1%) | 8 (1.8%) |
| 85 Years and over | 24 (5.8%) | 2 (0.4%) |
| Total | 415 (100.0%) | 454 (100.0%) |
Families and Households in Absarokee
Median Family Size in Absarokee
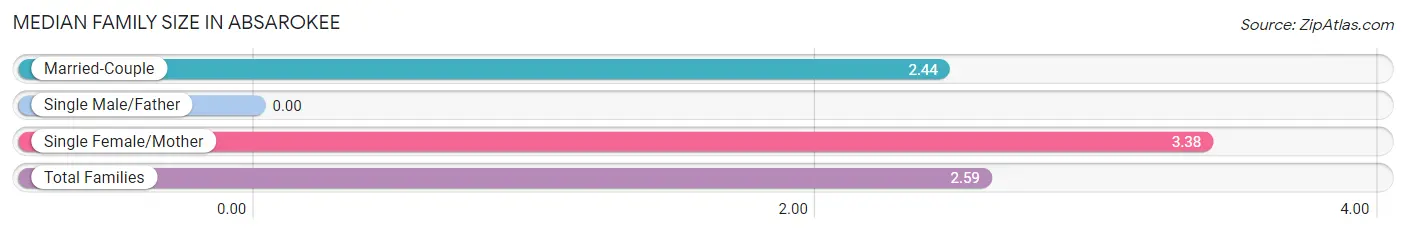
| Family Type | # Families | Family Size |
| Married-Couple | 223 (84.8%) | 2.44 |
| Single Male/Father | 0 (0.0%) | - |
| Single Female/Mother | 40 (15.2%) | 3.38 |
| Total Families | 263 (100.0%) | 2.59 |
Median Household Size in Absarokee
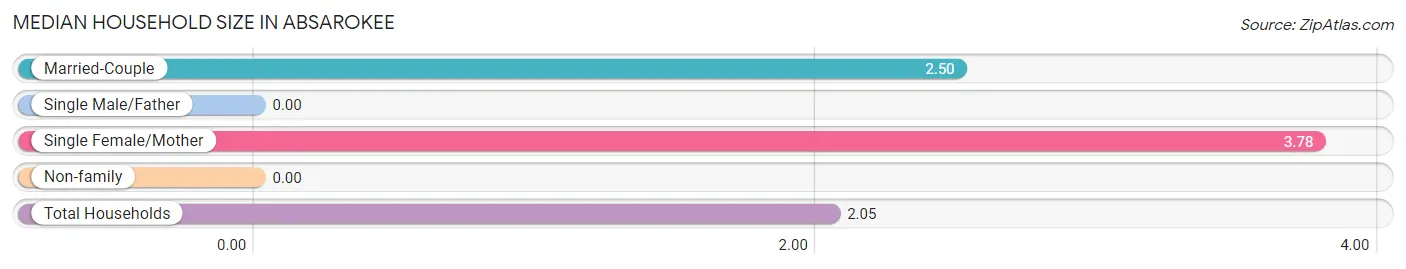
| Household Type | # Households | Household Size |
| Married-Couple | 223 (52.6%) | 2.50 |
| Single Male/Father | 0 (0.0%) | - |
| Single Female/Mother | 40 (9.4%) | 3.78 |
| Non-family | 161 (38.0%) | - |
| Total Households | 424 (100.0%) | 2.05 |
Household Size by Marriage Status in Absarokee
Out of a total of 424 households in Absarokee, 263 (62.0%) are family households, while 161 (38.0%) are nonfamily households. The most numerous type of family households are 2-person households, comprising 157, and the most common type of nonfamily households are 1-person households, comprising 161.
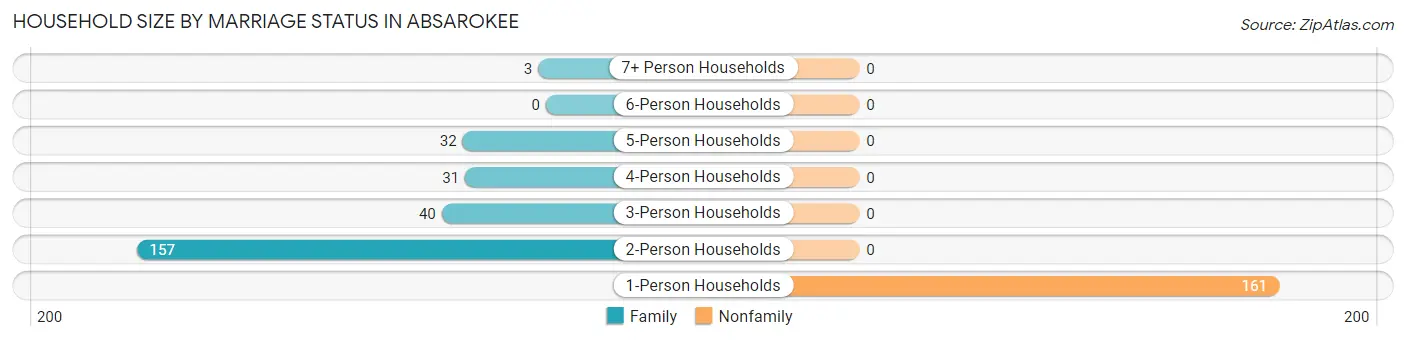
| Household Size | Family Households | Nonfamily Households |
| 1-Person Households | - | 161 (38.0%) |
| 2-Person Households | 157 (37.0%) | 0 (0.0%) |
| 3-Person Households | 40 (9.4%) | 0 (0.0%) |
| 4-Person Households | 31 (7.3%) | 0 (0.0%) |
| 5-Person Households | 32 (7.5%) | 0 (0.0%) |
| 6-Person Households | 0 (0.0%) | 0 (0.0%) |
| 7+ Person Households | 3 (0.7%) | 0 (0.0%) |
| Total | 263 (62.0%) | 161 (38.0%) |
Female Fertility in Absarokee
Fertility by Age in Absarokee
Average fertility rate in Absarokee is 165.0 births per 1,000 women. Women in the age bracket of 20 to 34 years have the highest fertility rate with 310.0 births per 1,000 women. Women in the age bracket of 20 to 34 years acount for 100.0% of all women with births.
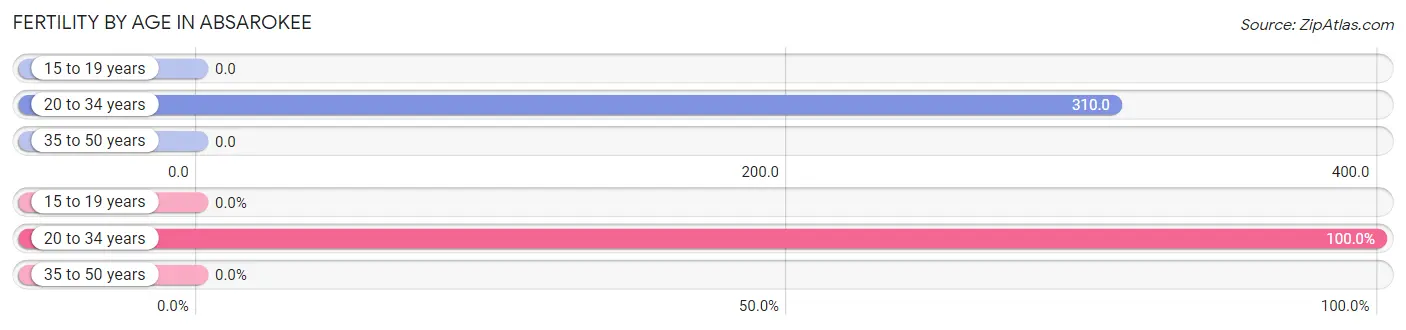
| Age Bracket | Women with Births | Births / 1,000 Women |
| 15 to 19 years | 0 (0.0%) | 0.0 |
| 20 to 34 years | 26 (100.0%) | 310.0 |
| 35 to 50 years | 0 (0.0%) | 0.0 |
| Total | 26 (100.0%) | 165.0 |
Fertility by Age by Marriage Status in Absarokee
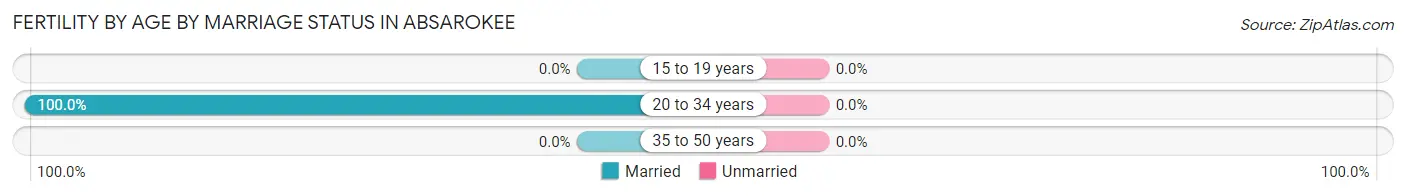
| Age Bracket | Married | Unmarried |
| 15 to 19 years | 0 (0.0%) | 0 (0.0%) |
| 20 to 34 years | 26 (100.0%) | 0 (0.0%) |
| 35 to 50 years | 0 (0.0%) | 0 (0.0%) |
| Total | 26 (100.0%) | 0 (0.0%) |
Fertility by Education in Absarokee
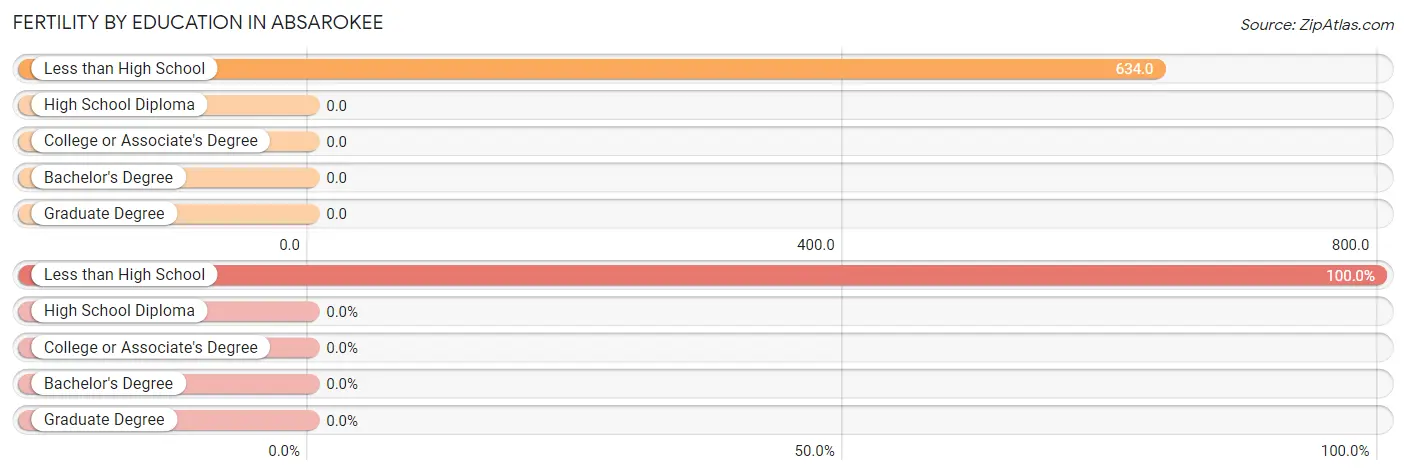
| Educational Attainment | Women with Births | Births / 1,000 Women |
| Less than High School | 26 (100.0%) | 634.0 |
| High School Diploma | 0 (0.0%) | 0.0 |
| College or Associate's Degree | 0 (0.0%) | 0.0 |
| Bachelor's Degree | 0 (0.0%) | 0.0 |
| Graduate Degree | 0 (0.0%) | 0.0 |
| Total | 26 (100.0%) | 165.0 |
Fertility by Education by Marriage Status in Absarokee
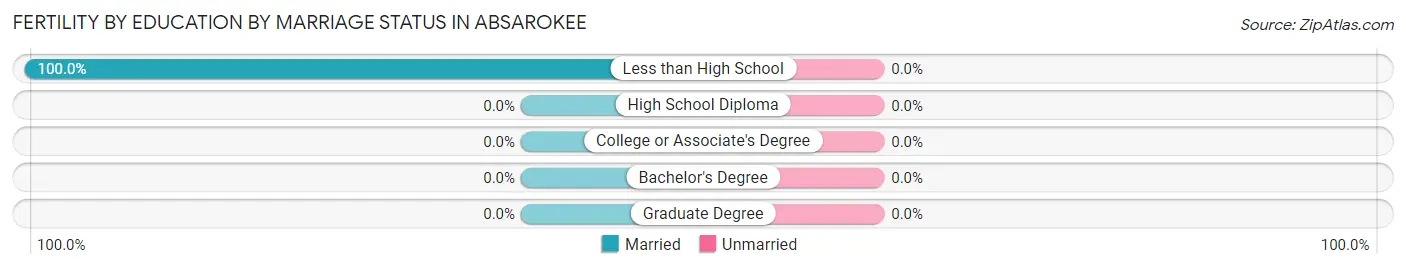
| Educational Attainment | Married | Unmarried |
| Less than High School | 26 (100.0%) | 0 (0.0%) |
| High School Diploma | 0 (0.0%) | 0 (0.0%) |
| College or Associate's Degree | 0 (0.0%) | 0 (0.0%) |
| Bachelor's Degree | 0 (0.0%) | 0 (0.0%) |
| Graduate Degree | 0 (0.0%) | 0 (0.0%) |
| Total | 26 (100.0%) | 0 (0.0%) |
Employment Characteristics in Absarokee
Employment by Class of Employer in Absarokee
Among the 413 employed individuals in Absarokee, private company employees (284 | 68.8%), local government employees (39 | 9.4%), and self-employed (not incorporated) (37 | 9.0%) make up the most common classes of employment.
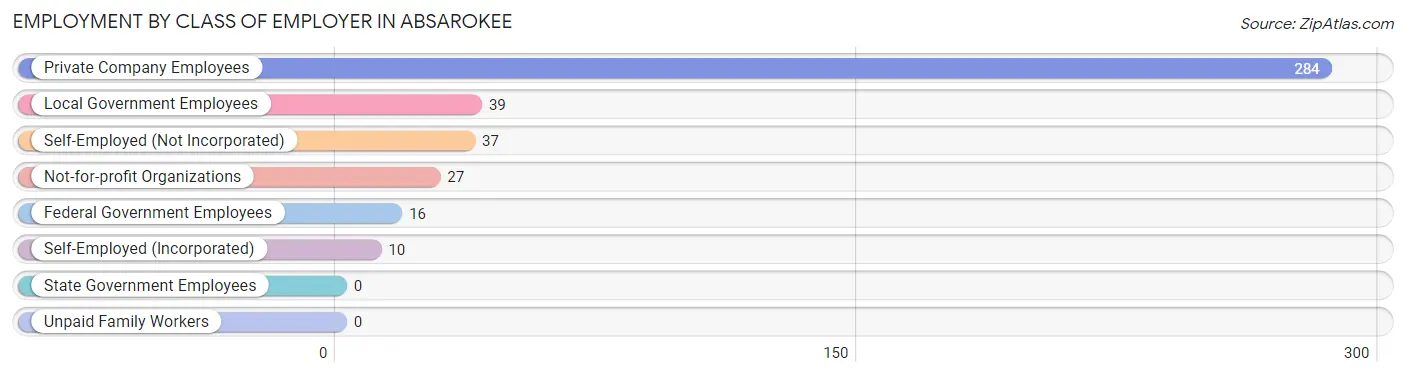
| Employer Class | # Employees | % Employees |
| Private Company Employees | 284 | 68.8% |
| Self-Employed (Incorporated) | 10 | 2.4% |
| Self-Employed (Not Incorporated) | 37 | 9.0% |
| Not-for-profit Organizations | 27 | 6.5% |
| Local Government Employees | 39 | 9.4% |
| State Government Employees | 0 | 0.0% |
| Federal Government Employees | 16 | 3.9% |
| Unpaid Family Workers | 0 | 0.0% |
| Total | 413 | 100.0% |
Employment Status by Age in Absarokee
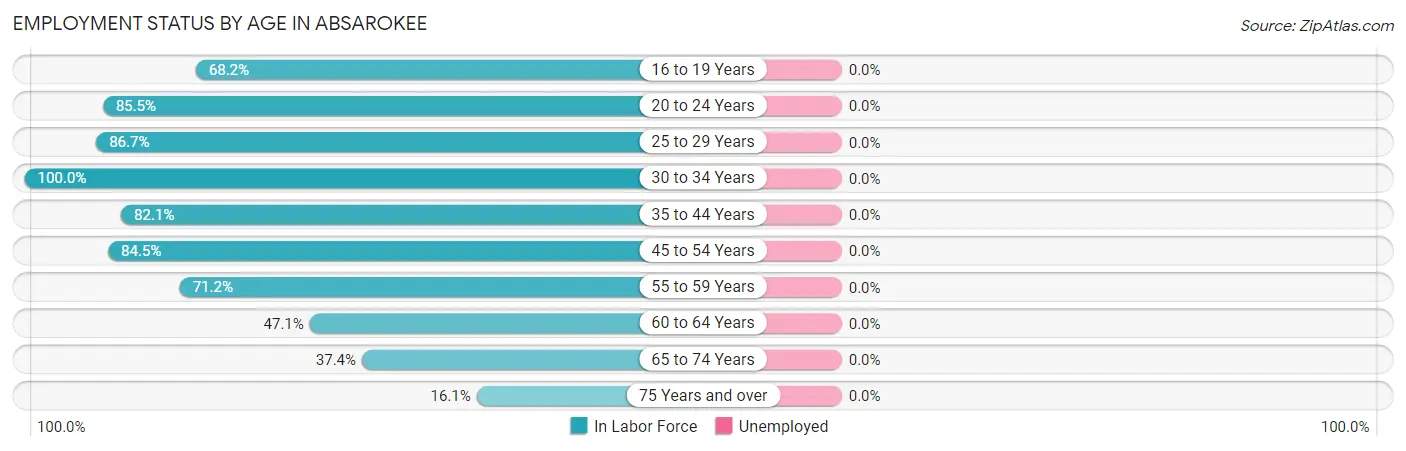
| Age Bracket | In Labor Force | Unemployed |
| 16 to 19 Years | 15 (68.2%) | 0 (0.0%) |
| 20 to 24 Years | 59 (85.5%) | 0 (0.0%) |
| 25 to 29 Years | 26 (86.7%) | 0 (0.0%) |
| 30 to 34 Years | 27 (100.0%) | 0 (0.0%) |
| 35 to 44 Years | 78 (82.1%) | 0 (0.0%) |
| 45 to 54 Years | 60 (84.5%) | 0 (0.0%) |
| 55 to 59 Years | 47 (71.2%) | 0 (0.0%) |
| 60 to 64 Years | 33 (47.1%) | 0 (0.0%) |
| 65 to 74 Years | 68 (37.4%) | 0 (0.0%) |
| 75 Years and over | 14 (16.1%) | 0 (0.0%) |
| Total | 427 (59.4%) | 0 (0.0%) |
Employment Status by Educational Attainment in Absarokee
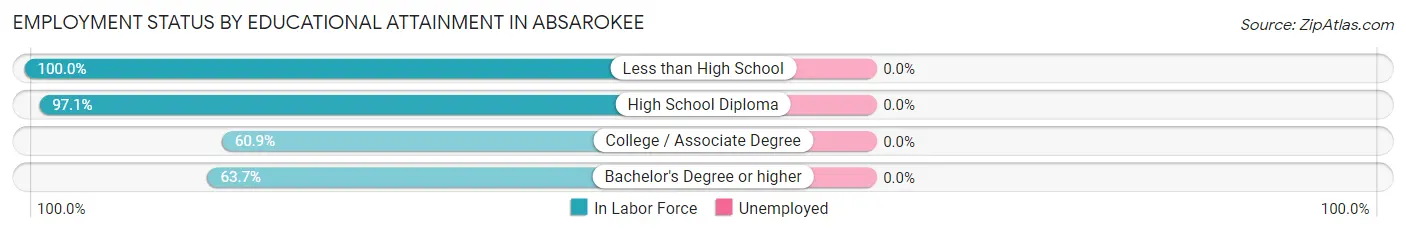
| Educational Attainment | In Labor Force | Unemployed |
| Less than High School | 28 (100.0%) | 0 (0.0%) |
| High School Diploma | 101 (97.1%) | 0 (0.0%) |
| College / Associate Degree | 56 (60.9%) | 0 (0.0%) |
| Bachelor's Degree or higher | 86 (63.7%) | 0 (0.0%) |
| Total | 271 (75.5%) | 0 (0.0%) |
Employment Occupations by Sex in Absarokee
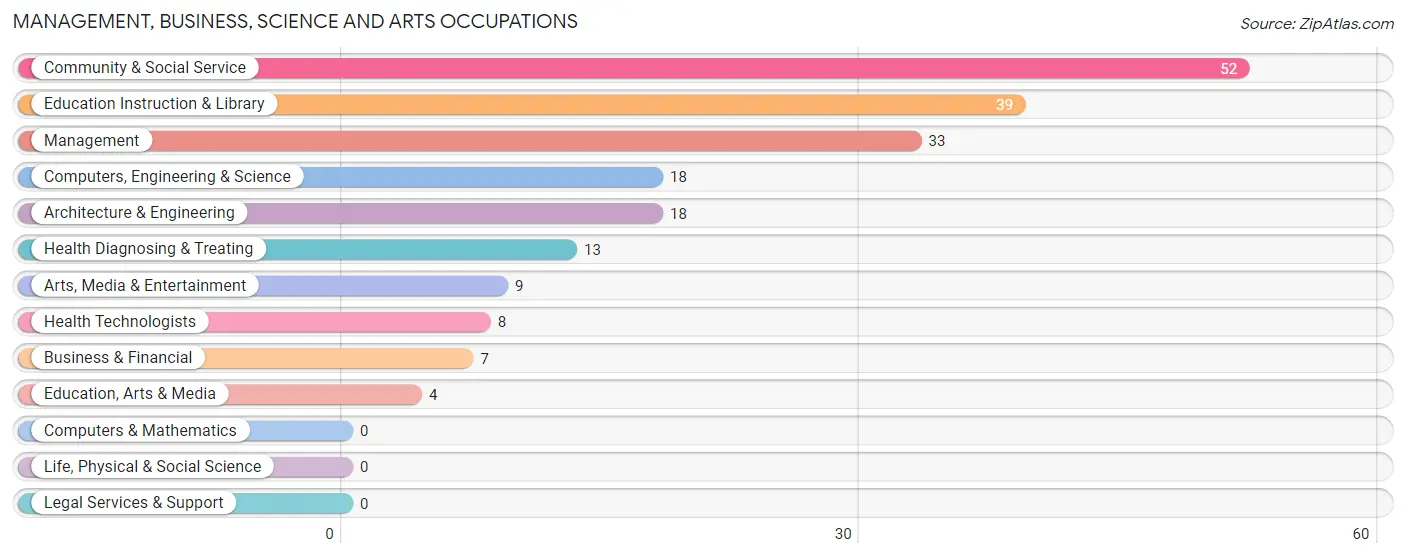
Management, Business, Science and Arts Occupations
The most common Management, Business, Science and Arts occupations in Absarokee are Community & Social Service (52 | 12.2%), Education Instruction & Library (39 | 9.1%), Management (33 | 7.7%), Computers, Engineering & Science (18 | 4.2%), and Architecture & Engineering (18 | 4.2%).
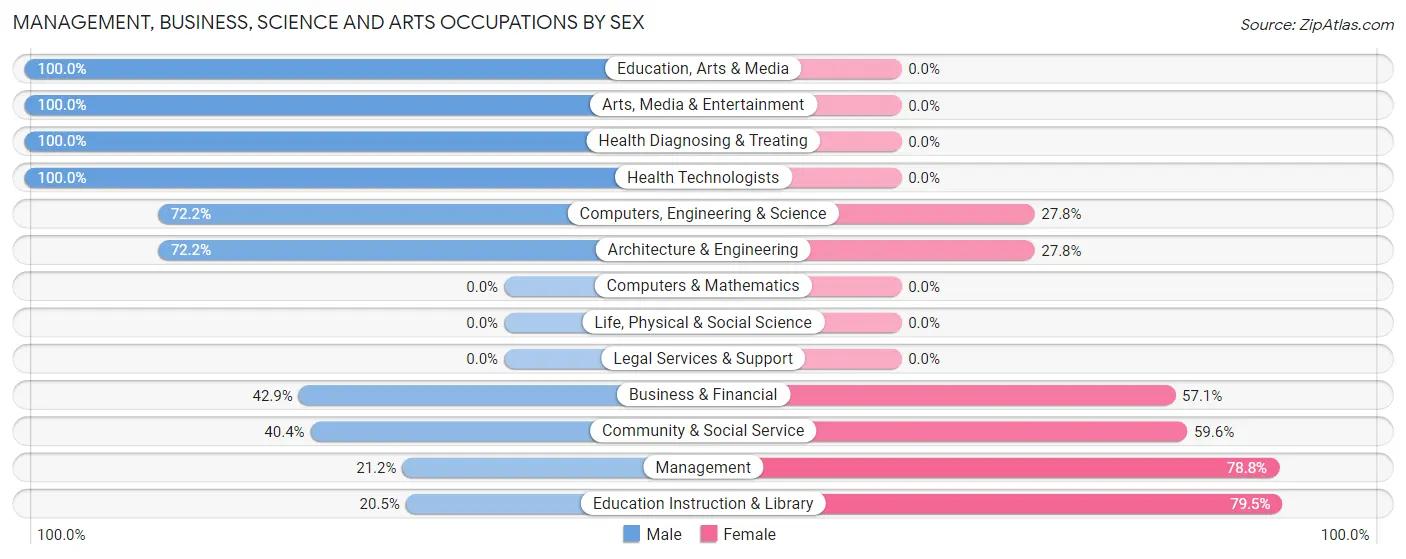
Management, Business, Science and Arts Occupations by Sex
Within the Management, Business, Science and Arts occupations in Absarokee, the most male-oriented occupations are Education, Arts & Media (100.0%), Arts, Media & Entertainment (100.0%), and Health Diagnosing & Treating (100.0%), while the most female-oriented occupations are Education Instruction & Library (79.5%), Management (78.8%), and Community & Social Service (59.6%).
| Occupation | Male | Female |
| Management | 7 (21.2%) | 26 (78.8%) |
| Business & Financial | 3 (42.9%) | 4 (57.1%) |
| Computers, Engineering & Science | 13 (72.2%) | 5 (27.8%) |
| Computers & Mathematics | 0 (0.0%) | 0 (0.0%) |
| Architecture & Engineering | 13 (72.2%) | 5 (27.8%) |
| Life, Physical & Social Science | 0 (0.0%) | 0 (0.0%) |
| Community & Social Service | 21 (40.4%) | 31 (59.6%) |
| Education, Arts & Media | 4 (100.0%) | 0 (0.0%) |
| Legal Services & Support | 0 (0.0%) | 0 (0.0%) |
| Education Instruction & Library | 8 (20.5%) | 31 (79.5%) |
| Arts, Media & Entertainment | 9 (100.0%) | 0 (0.0%) |
| Health Diagnosing & Treating | 13 (100.0%) | 0 (0.0%) |
| Health Technologists | 8 (100.0%) | 0 (0.0%) |
| Total (Category) | 57 (46.3%) | 66 (53.7%) |
| Total (Overall) | 214 (50.1%) | 213 (49.9%) |
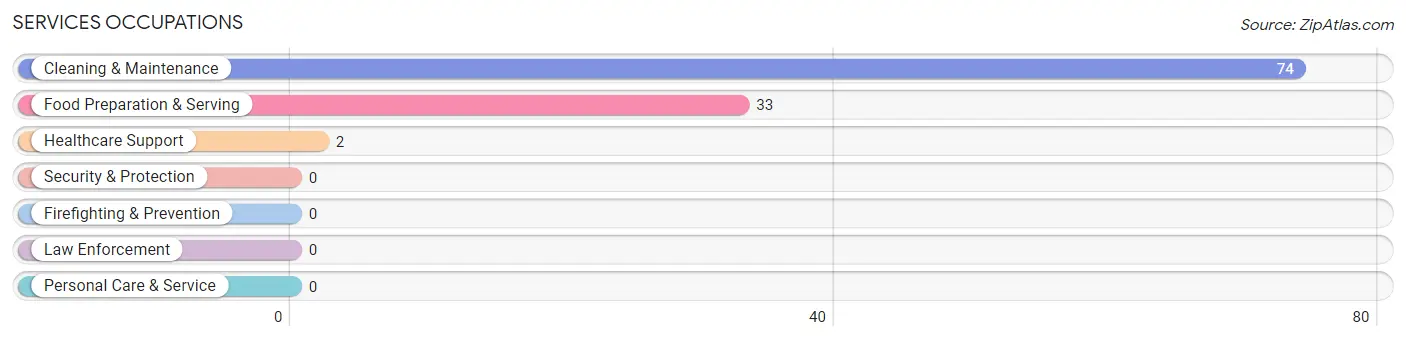
Services Occupations
The most common Services occupations in Absarokee are Cleaning & Maintenance (74 | 17.3%), Food Preparation & Serving (33 | 7.7%), and Healthcare Support (2 | 0.5%).
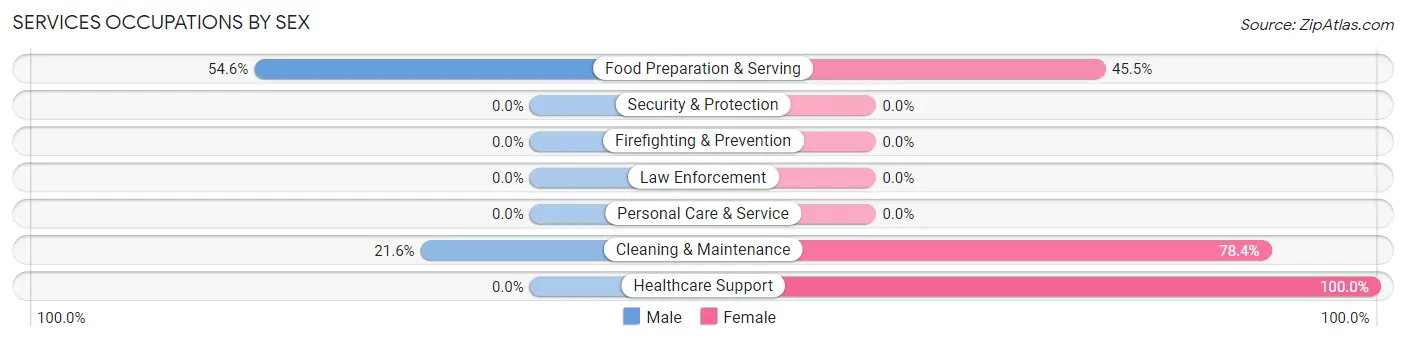
Services Occupations by Sex
Within the Services occupations in Absarokee, the most male-oriented occupations are Food Preparation & Serving (54.5%), and Cleaning & Maintenance (21.6%), while the most female-oriented occupations are Healthcare Support (100.0%), Cleaning & Maintenance (78.4%), and Food Preparation & Serving (45.5%).
| Occupation | Male | Female |
| Healthcare Support | 0 (0.0%) | 2 (100.0%) |
| Security & Protection | 0 (0.0%) | 0 (0.0%) |
| Firefighting & Prevention | 0 (0.0%) | 0 (0.0%) |
| Law Enforcement | 0 (0.0%) | 0 (0.0%) |
| Food Preparation & Serving | 18 (54.5%) | 15 (45.5%) |
| Cleaning & Maintenance | 16 (21.6%) | 58 (78.4%) |
| Personal Care & Service | 0 (0.0%) | 0 (0.0%) |
| Total (Category) | 34 (31.2%) | 75 (68.8%) |
| Total (Overall) | 214 (50.1%) | 213 (49.9%) |
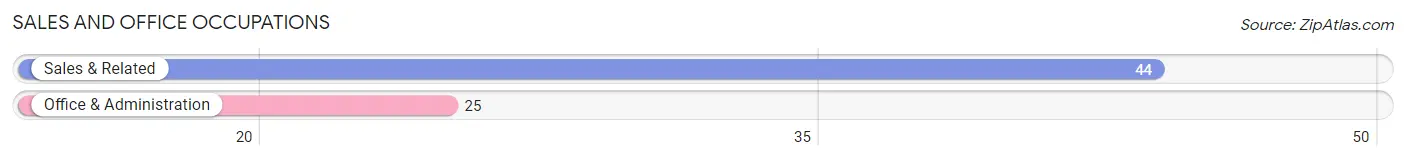
Sales and Office Occupations
The most common Sales and Office occupations in Absarokee are Sales & Related (44 | 10.3%), and Office & Administration (25 | 5.9%).
Sales and Office Occupations by Sex
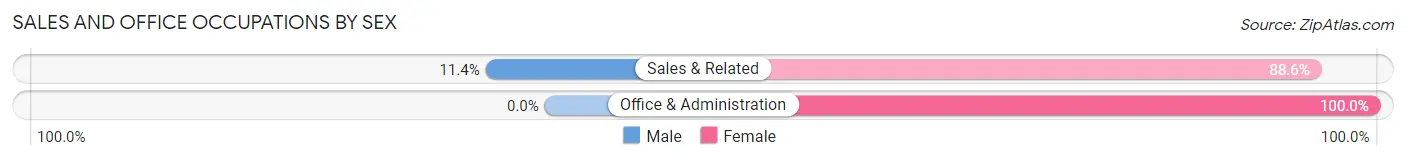
| Occupation | Male | Female |
| Sales & Related | 5 (11.4%) | 39 (88.6%) |
| Office & Administration | 0 (0.0%) | 25 (100.0%) |
| Total (Category) | 5 (7.2%) | 64 (92.7%) |
| Total (Overall) | 214 (50.1%) | 213 (49.9%) |
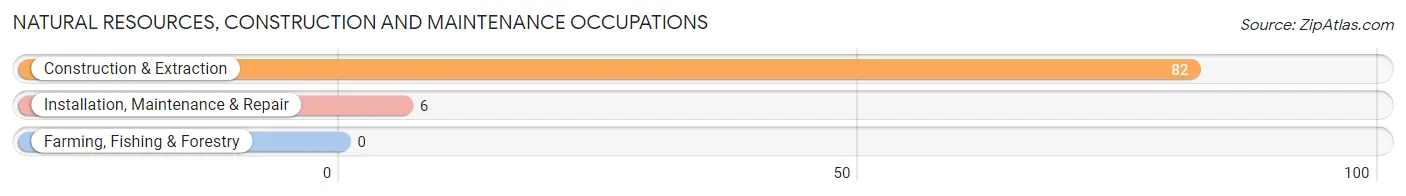
Natural Resources, Construction and Maintenance Occupations
The most common Natural Resources, Construction and Maintenance occupations in Absarokee are Construction & Extraction (82 | 19.2%), and Installation, Maintenance & Repair (6 | 1.4%).
Natural Resources, Construction and Maintenance Occupations by Sex
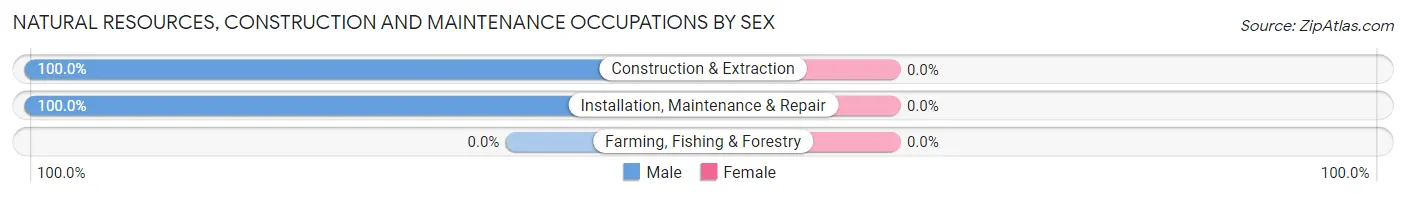
| Occupation | Male | Female |
| Farming, Fishing & Forestry | 0 (0.0%) | 0 (0.0%) |
| Construction & Extraction | 82 (100.0%) | 0 (0.0%) |
| Installation, Maintenance & Repair | 6 (100.0%) | 0 (0.0%) |
| Total (Category) | 88 (100.0%) | 0 (0.0%) |
| Total (Overall) | 214 (50.1%) | 213 (49.9%) |
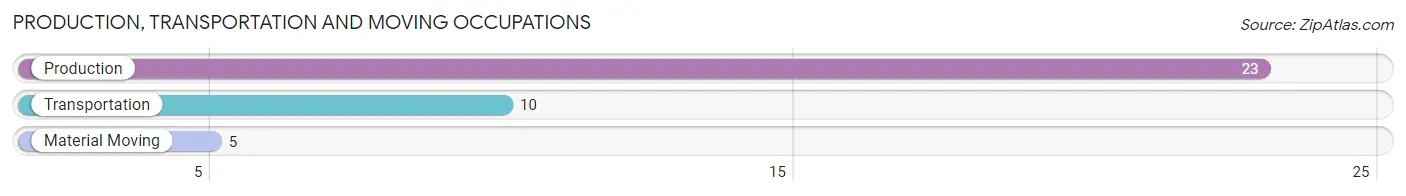
Production, Transportation and Moving Occupations
The most common Production, Transportation and Moving occupations in Absarokee are Production (23 | 5.4%), Transportation (10 | 2.3%), and Material Moving (5 | 1.2%).
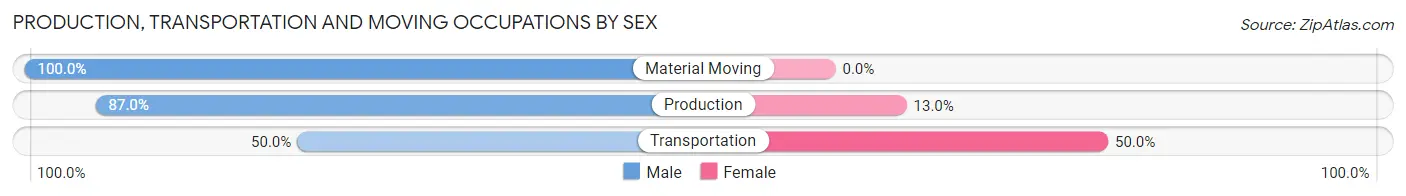
Production, Transportation and Moving Occupations by Sex
| Occupation | Male | Female |
| Production | 20 (87.0%) | 3 (13.0%) |
| Transportation | 5 (50.0%) | 5 (50.0%) |
| Material Moving | 5 (100.0%) | 0 (0.0%) |
| Total (Category) | 30 (78.9%) | 8 (21.0%) |
| Total (Overall) | 214 (50.1%) | 213 (49.9%) |
Employment Industries by Sex in Absarokee
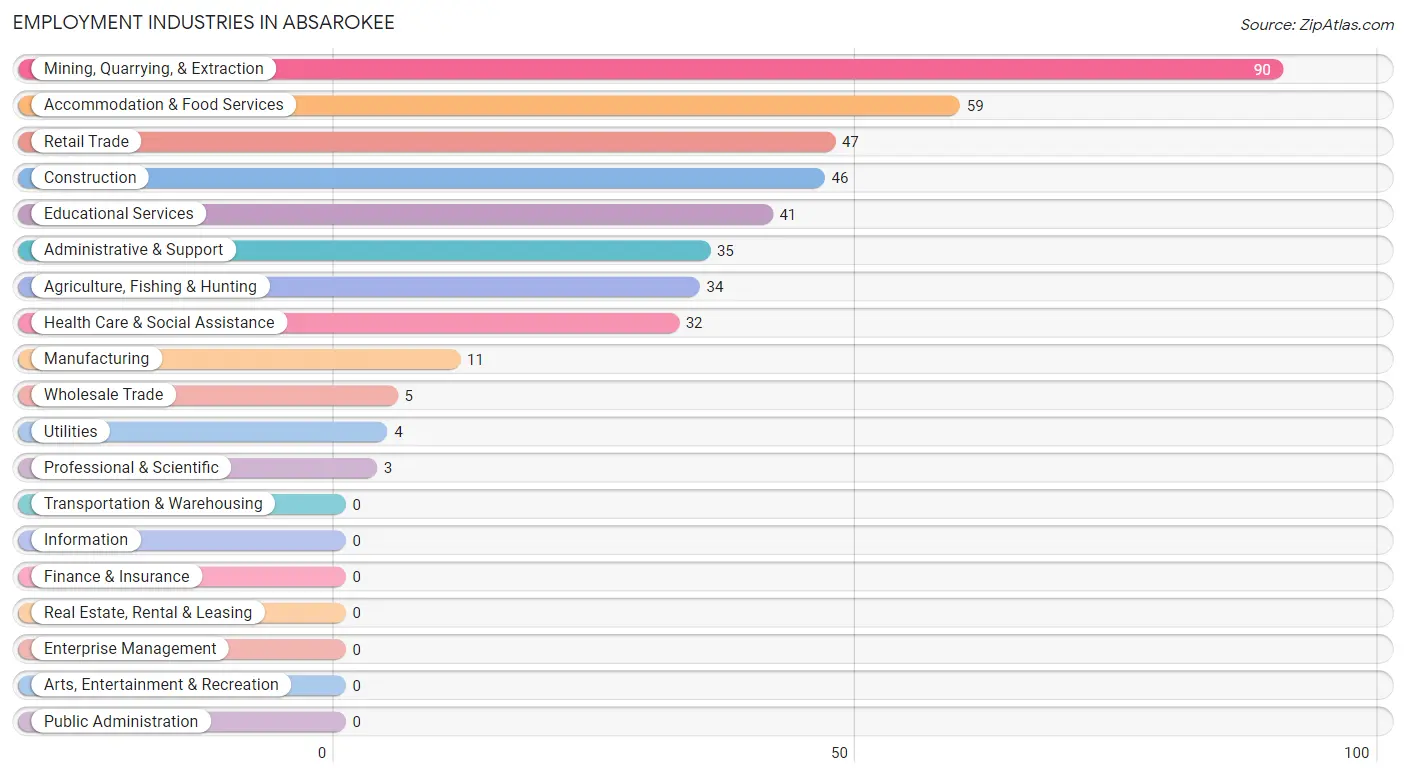
Employment Industries in Absarokee
The major employment industries in Absarokee include Mining, Quarrying, & Extraction (90 | 21.1%), Accommodation & Food Services (59 | 13.8%), Retail Trade (47 | 11.0%), Construction (46 | 10.8%), and Educational Services (41 | 9.6%).
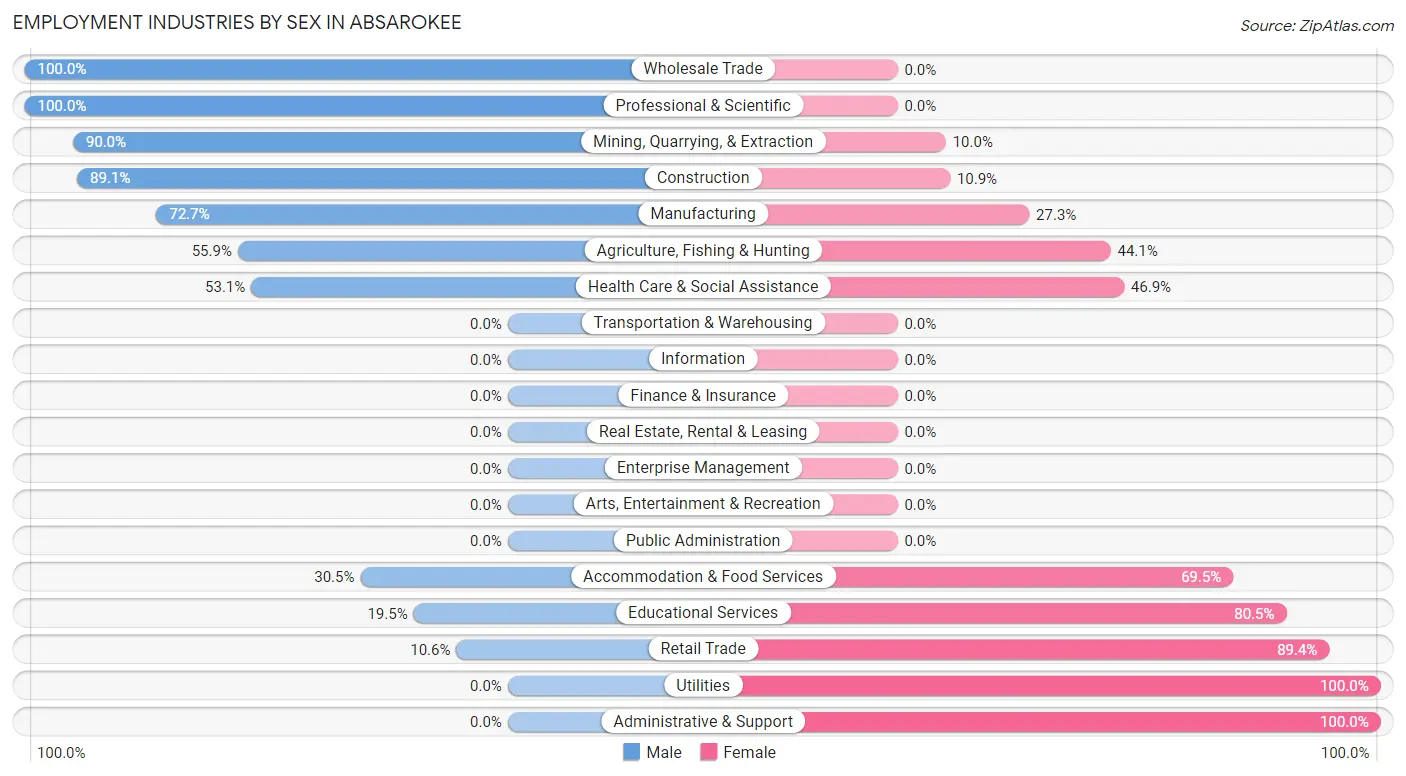
Employment Industries by Sex in Absarokee
The Absarokee industries that see more men than women are Wholesale Trade (100.0%), Professional & Scientific (100.0%), and Mining, Quarrying, & Extraction (90.0%), whereas the industries that tend to have a higher number of women are Utilities (100.0%), Administrative & Support (100.0%), and Retail Trade (89.4%).
| Industry | Male | Female |
| Agriculture, Fishing & Hunting | 19 (55.9%) | 15 (44.1%) |
| Mining, Quarrying, & Extraction | 81 (90.0%) | 9 (10.0%) |
| Construction | 41 (89.1%) | 5 (10.9%) |
| Manufacturing | 8 (72.7%) | 3 (27.3%) |
| Wholesale Trade | 5 (100.0%) | 0 (0.0%) |
| Retail Trade | 5 (10.6%) | 42 (89.4%) |
| Transportation & Warehousing | 0 (0.0%) | 0 (0.0%) |
| Utilities | 0 (0.0%) | 4 (100.0%) |
| Information | 0 (0.0%) | 0 (0.0%) |
| Finance & Insurance | 0 (0.0%) | 0 (0.0%) |
| Real Estate, Rental & Leasing | 0 (0.0%) | 0 (0.0%) |
| Professional & Scientific | 3 (100.0%) | 0 (0.0%) |
| Enterprise Management | 0 (0.0%) | 0 (0.0%) |
| Administrative & Support | 0 (0.0%) | 35 (100.0%) |
| Educational Services | 8 (19.5%) | 33 (80.5%) |
| Health Care & Social Assistance | 17 (53.1%) | 15 (46.9%) |
| Arts, Entertainment & Recreation | 0 (0.0%) | 0 (0.0%) |
| Accommodation & Food Services | 18 (30.5%) | 41 (69.5%) |
| Public Administration | 0 (0.0%) | 0 (0.0%) |
| Total | 214 (50.1%) | 213 (49.9%) |
Education in Absarokee
School Enrollment in Absarokee
The most common levels of schooling among the 153 students in Absarokee are elementary school (41 | 26.8%), high school (32 | 20.9%), and middle school (25 | 16.3%).
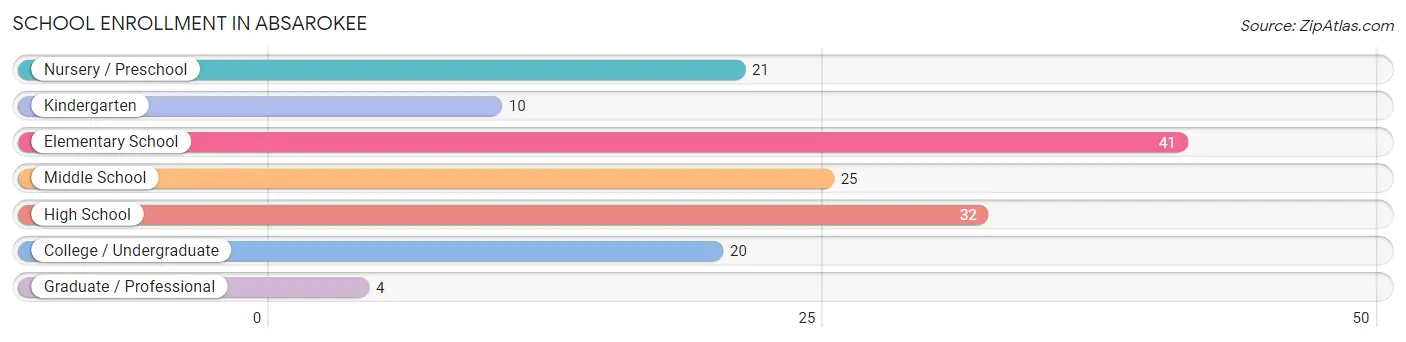
| School Level | # Students | % Students |
| Nursery / Preschool | 21 | 13.7% |
| Kindergarten | 10 | 6.5% |
| Elementary School | 41 | 26.8% |
| Middle School | 25 | 16.3% |
| High School | 32 | 20.9% |
| College / Undergraduate | 20 | 13.1% |
| Graduate / Professional | 4 | 2.6% |
| Total | 153 | 100.0% |
School Enrollment by Age by Funding Source in Absarokee
Out of a total of 153 students who are enrolled in schools in Absarokee, 27 (17.6%) attend a private institution, while the remaining 126 (82.4%) are enrolled in public schools. The age group of 3 to 4 year olds has the highest likelihood of being enrolled in private schools, with 10 (47.6% in the age bracket) enrolled. Conversely, the age group of 15 to 17 year olds has the lowest likelihood of being enrolled in a private school, with 22 (100.0% in the age bracket) attending a public institution.
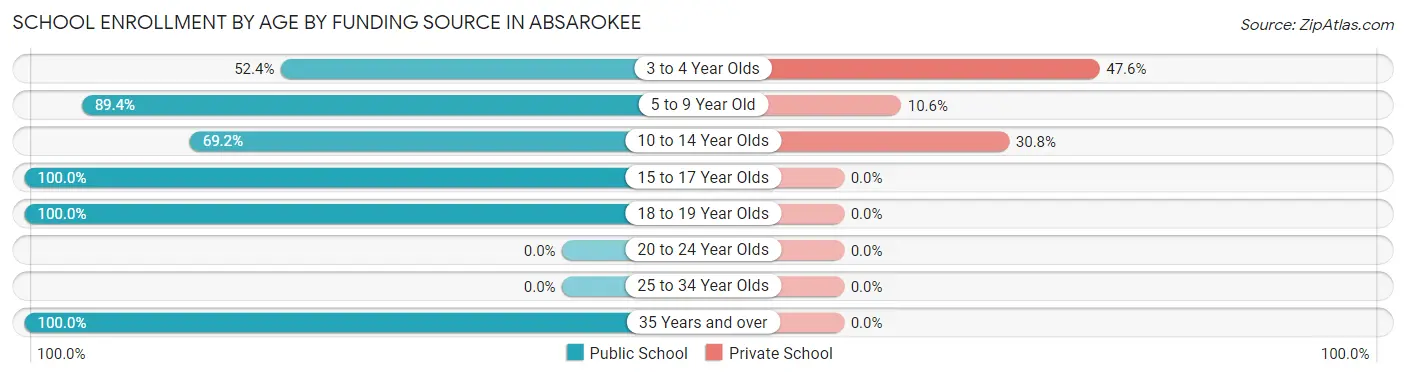
| Age Bracket | Public School | Private School |
| 3 to 4 Year Olds | 11 (52.4%) | 10 (47.6%) |
| 5 to 9 Year Old | 42 (89.4%) | 5 (10.6%) |
| 10 to 14 Year Olds | 27 (69.2%) | 12 (30.8%) |
| 15 to 17 Year Olds | 22 (100.0%) | 0 (0.0%) |
| 18 to 19 Year Olds | 15 (100.0%) | 0 (0.0%) |
| 20 to 24 Year Olds | 0 (0.0%) | 0 (0.0%) |
| 25 to 34 Year Olds | 0 (0.0%) | 0 (0.0%) |
| 35 Years and over | 9 (100.0%) | 0 (0.0%) |
| Total | 126 (82.4%) | 27 (17.6%) |
Educational Attainment by Field of Study in Absarokee
Business (76 | 33.0%), education (59 | 25.7%), liberal arts & history (24 | 10.4%), engineering (20 | 8.7%), and arts & humanities (18 | 7.8%) are the most common fields of study among 230 individuals in Absarokee who have obtained a bachelor's degree or higher.
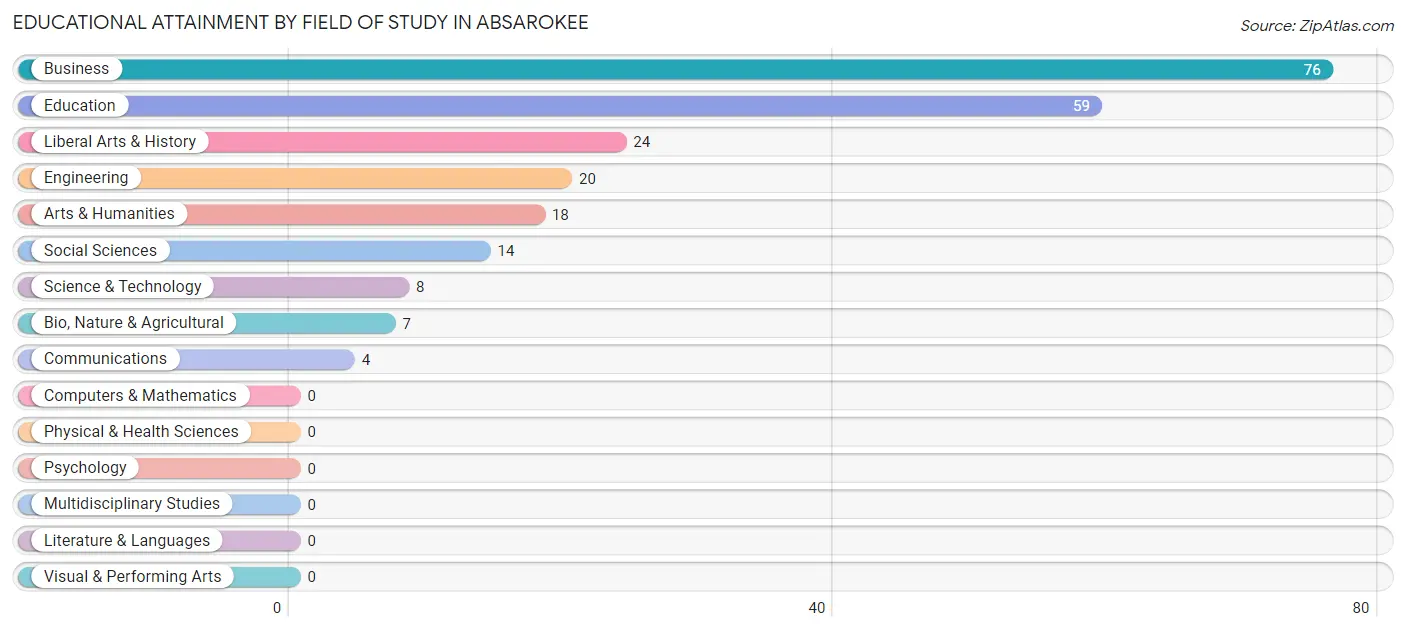
| Field of Study | # Graduates | % Graduates |
| Computers & Mathematics | 0 | 0.0% |
| Bio, Nature & Agricultural | 7 | 3.0% |
| Physical & Health Sciences | 0 | 0.0% |
| Psychology | 0 | 0.0% |
| Social Sciences | 14 | 6.1% |
| Engineering | 20 | 8.7% |
| Multidisciplinary Studies | 0 | 0.0% |
| Science & Technology | 8 | 3.5% |
| Business | 76 | 33.0% |
| Education | 59 | 25.7% |
| Literature & Languages | 0 | 0.0% |
| Liberal Arts & History | 24 | 10.4% |
| Visual & Performing Arts | 0 | 0.0% |
| Communications | 4 | 1.7% |
| Arts & Humanities | 18 | 7.8% |
| Total | 230 | 100.0% |
Transportation & Commute in Absarokee
Vehicle Availability by Sex in Absarokee
The most prevalent vehicle ownership categories in Absarokee are males with 2 vehicles (95, accounting for 44.4%) and females with 2 vehicles (86, making up 47.7%).
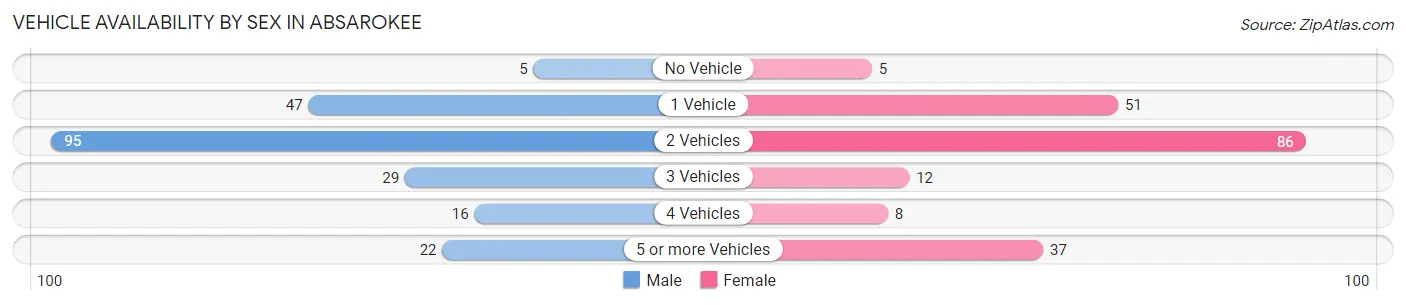
| Vehicles Available | Male | Female |
| No Vehicle | 5 (2.3%) | 5 (2.5%) |
| 1 Vehicle | 47 (22.0%) | 51 (25.6%) |
| 2 Vehicles | 95 (44.4%) | 86 (43.2%) |
| 3 Vehicles | 29 (13.6%) | 12 (6.0%) |
| 4 Vehicles | 16 (7.5%) | 8 (4.0%) |
| 5 or more Vehicles | 22 (10.3%) | 37 (18.6%) |
| Total | 214 (100.0%) | 199 (100.0%) |
Commute Time in Absarokee
The most frequently occuring commute durations in Absarokee are less than 5 minutes (76 commuters, 20.5%), 40 to 44 minutes (59 commuters, 16.0%), and 5 to 9 minutes (57 commuters, 15.4%).
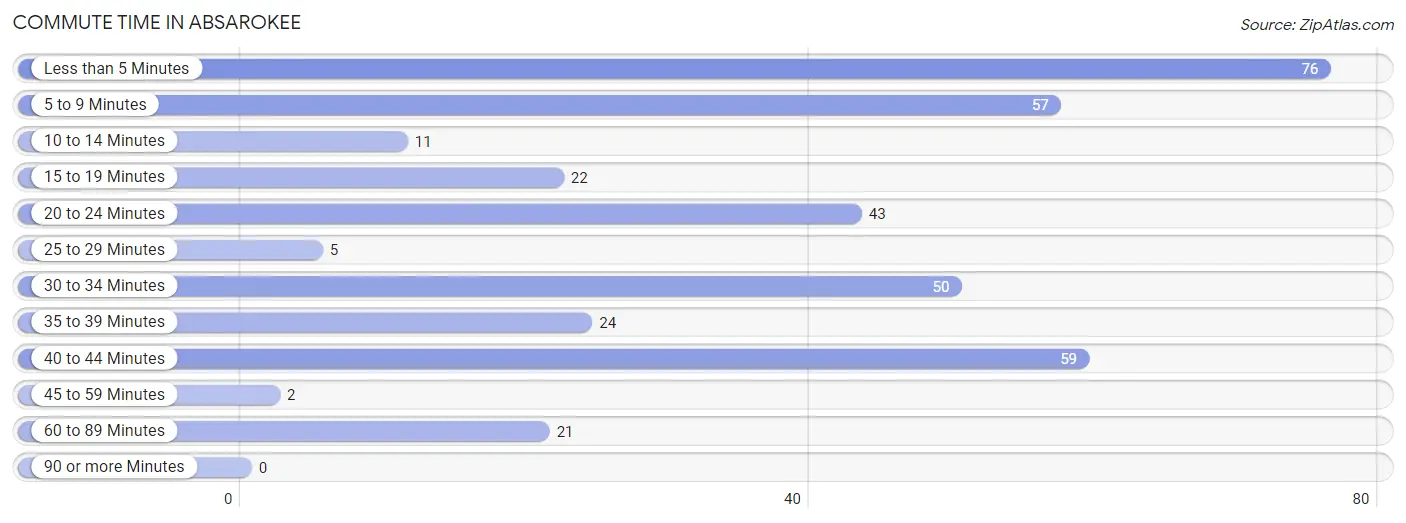
| Commute Time | # Commuters | % Commuters |
| Less than 5 Minutes | 76 | 20.5% |
| 5 to 9 Minutes | 57 | 15.4% |
| 10 to 14 Minutes | 11 | 3.0% |
| 15 to 19 Minutes | 22 | 5.9% |
| 20 to 24 Minutes | 43 | 11.6% |
| 25 to 29 Minutes | 5 | 1.3% |
| 30 to 34 Minutes | 50 | 13.5% |
| 35 to 39 Minutes | 24 | 6.5% |
| 40 to 44 Minutes | 59 | 16.0% |
| 45 to 59 Minutes | 2 | 0.5% |
| 60 to 89 Minutes | 21 | 5.7% |
| 90 or more Minutes | 0 | 0.0% |
Commute Time by Sex in Absarokee
The most common commute times in Absarokee are 40 to 44 minutes (59 commuters, 31.0%) for males and less than 5 minutes (65 commuters, 36.1%) for females.
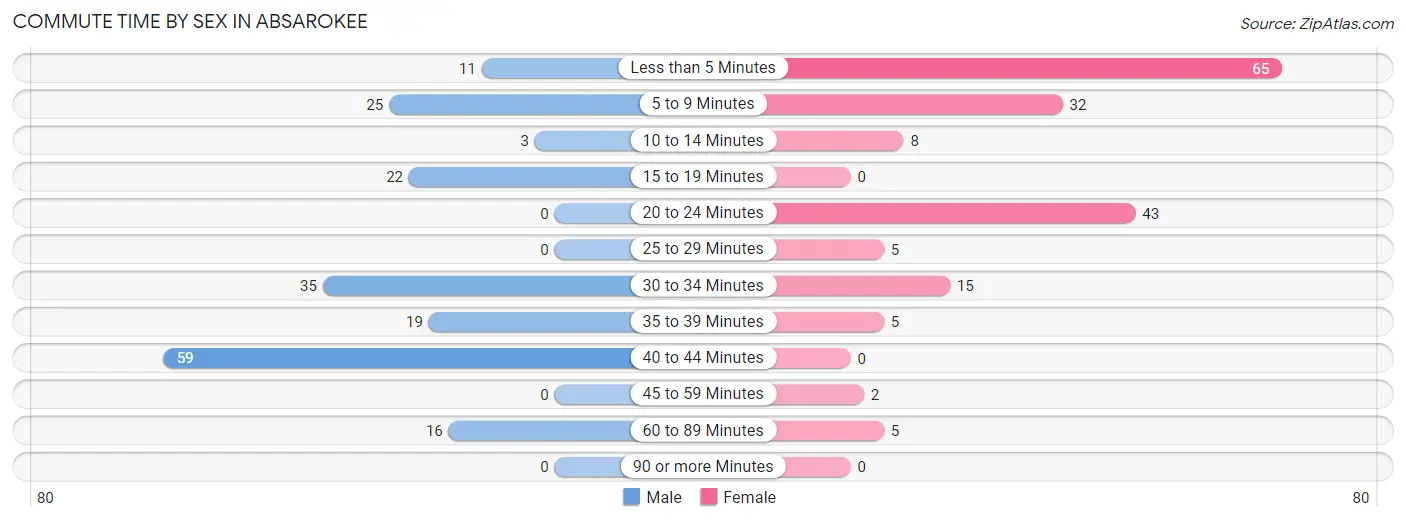
| Commute Time | Male | Female |
| Less than 5 Minutes | 11 (5.8%) | 65 (36.1%) |
| 5 to 9 Minutes | 25 (13.2%) | 32 (17.8%) |
| 10 to 14 Minutes | 3 (1.6%) | 8 (4.4%) |
| 15 to 19 Minutes | 22 (11.6%) | 0 (0.0%) |
| 20 to 24 Minutes | 0 (0.0%) | 43 (23.9%) |
| 25 to 29 Minutes | 0 (0.0%) | 5 (2.8%) |
| 30 to 34 Minutes | 35 (18.4%) | 15 (8.3%) |
| 35 to 39 Minutes | 19 (10.0%) | 5 (2.8%) |
| 40 to 44 Minutes | 59 (31.0%) | 0 (0.0%) |
| 45 to 59 Minutes | 0 (0.0%) | 2 (1.1%) |
| 60 to 89 Minutes | 16 (8.4%) | 5 (2.8%) |
| 90 or more Minutes | 0 (0.0%) | 0 (0.0%) |
Time of Departure to Work by Sex in Absarokee
The most frequent times of departure to work in Absarokee are 5:30 AM to 5:59 AM (70, 36.8%) for males and 10:00 AM to 10:59 AM (41, 22.8%) for females.
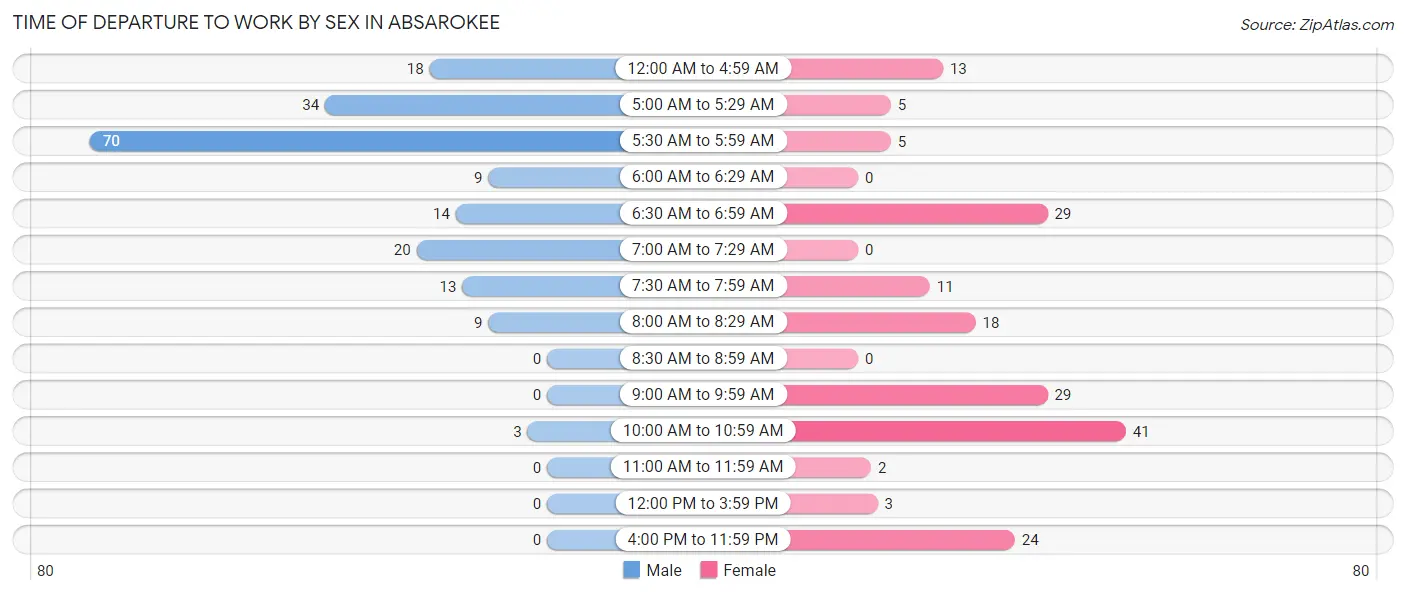
| Time of Departure | Male | Female |
| 12:00 AM to 4:59 AM | 18 (9.5%) | 13 (7.2%) |
| 5:00 AM to 5:29 AM | 34 (17.9%) | 5 (2.8%) |
| 5:30 AM to 5:59 AM | 70 (36.8%) | 5 (2.8%) |
| 6:00 AM to 6:29 AM | 9 (4.7%) | 0 (0.0%) |
| 6:30 AM to 6:59 AM | 14 (7.4%) | 29 (16.1%) |
| 7:00 AM to 7:29 AM | 20 (10.5%) | 0 (0.0%) |
| 7:30 AM to 7:59 AM | 13 (6.8%) | 11 (6.1%) |
| 8:00 AM to 8:29 AM | 9 (4.7%) | 18 (10.0%) |
| 8:30 AM to 8:59 AM | 0 (0.0%) | 0 (0.0%) |
| 9:00 AM to 9:59 AM | 0 (0.0%) | 29 (16.1%) |
| 10:00 AM to 10:59 AM | 3 (1.6%) | 41 (22.8%) |
| 11:00 AM to 11:59 AM | 0 (0.0%) | 2 (1.1%) |
| 12:00 PM to 3:59 PM | 0 (0.0%) | 3 (1.7%) |
| 4:00 PM to 11:59 PM | 0 (0.0%) | 24 (13.3%) |
| Total | 190 (100.0%) | 180 (100.0%) |
Housing Occupancy in Absarokee
Occupancy by Ownership in Absarokee
Of the total 424 dwellings in Absarokee, owner-occupied units account for 323 (76.2%), while renter-occupied units make up 101 (23.8%).
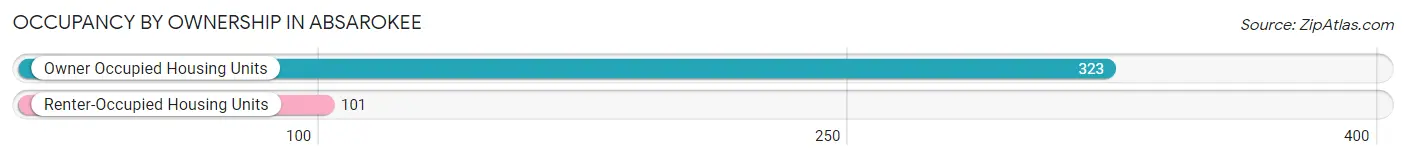
| Occupancy | # Housing Units | % Housing Units |
| Owner Occupied Housing Units | 323 | 76.2% |
| Renter-Occupied Housing Units | 101 | 23.8% |
| Total Occupied Housing Units | 424 | 100.0% |
Occupancy by Household Size in Absarokee
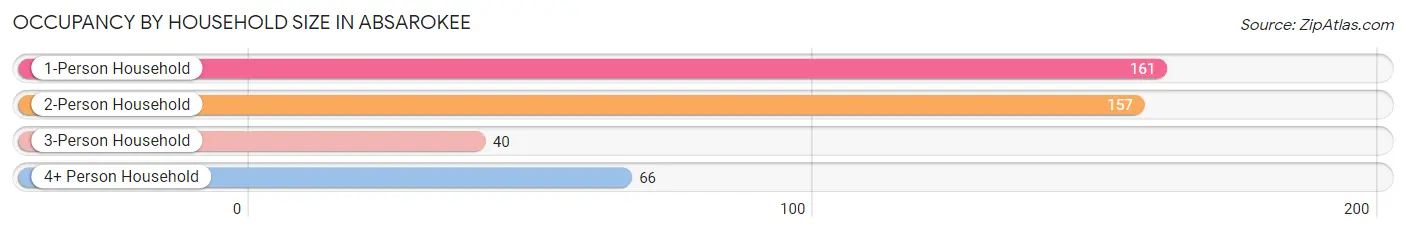
| Household Size | # Housing Units | % Housing Units |
| 1-Person Household | 161 | 38.0% |
| 2-Person Household | 157 | 37.0% |
| 3-Person Household | 40 | 9.4% |
| 4+ Person Household | 66 | 15.6% |
| Total Housing Units | 424 | 100.0% |
Occupancy by Ownership by Household Size in Absarokee
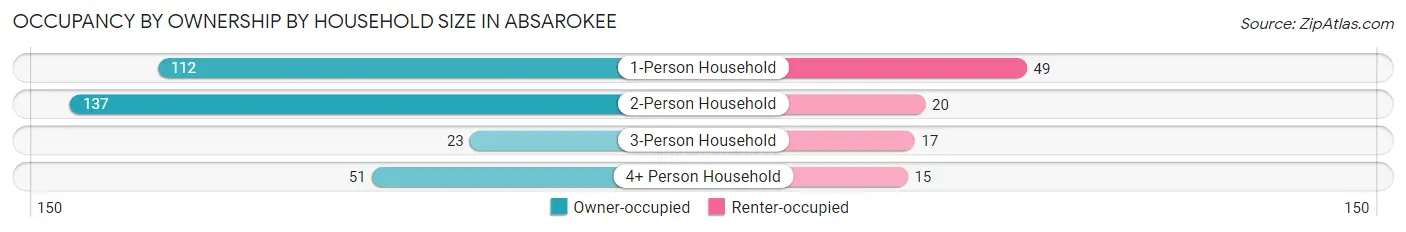
| Household Size | Owner-occupied | Renter-occupied |
| 1-Person Household | 112 (69.6%) | 49 (30.4%) |
| 2-Person Household | 137 (87.3%) | 20 (12.7%) |
| 3-Person Household | 23 (57.5%) | 17 (42.5%) |
| 4+ Person Household | 51 (77.3%) | 15 (22.7%) |
| Total Housing Units | 323 (76.2%) | 101 (23.8%) |
Occupancy by Educational Attainment in Absarokee
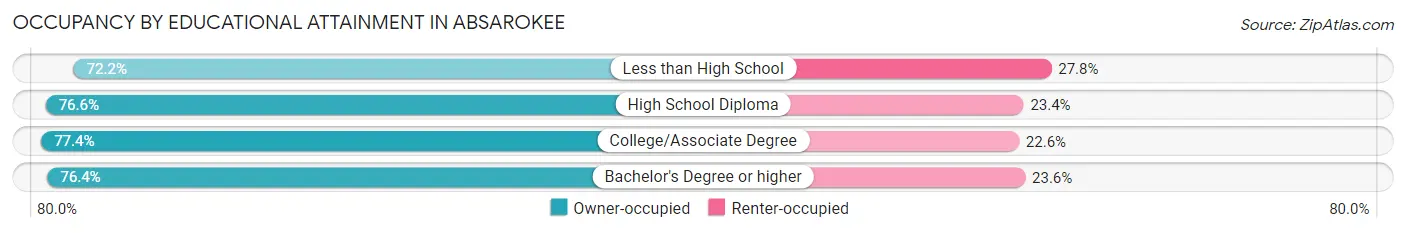
| Household Size | Owner-occupied | Renter-occupied |
| Less than High School | 39 (72.2%) | 15 (27.8%) |
| High School Diploma | 105 (76.6%) | 32 (23.4%) |
| College/Associate Degree | 82 (77.4%) | 24 (22.6%) |
| Bachelor's Degree or higher | 97 (76.4%) | 30 (23.6%) |
Occupancy by Age of Householder in Absarokee
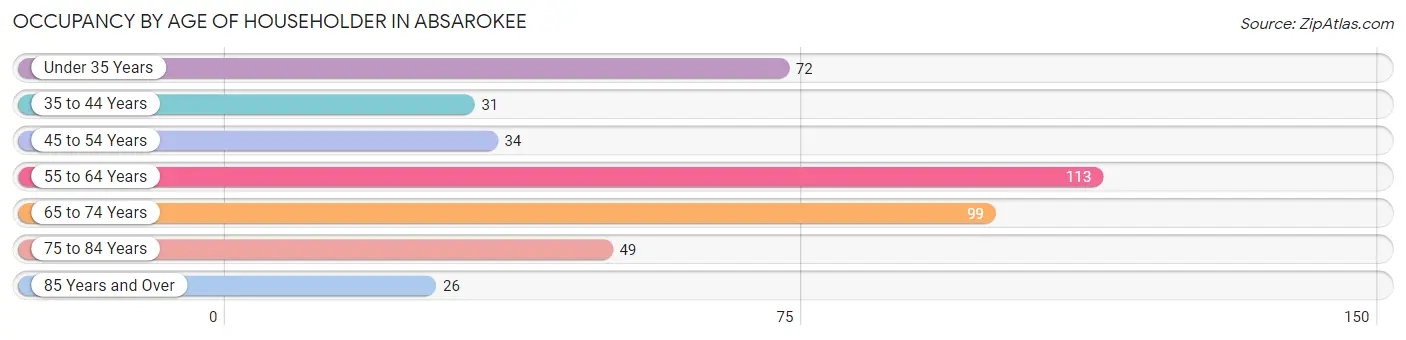
| Age Bracket | # Households | % Households |
| Under 35 Years | 72 | 17.0% |
| 35 to 44 Years | 31 | 7.3% |
| 45 to 54 Years | 34 | 8.0% |
| 55 to 64 Years | 113 | 26.7% |
| 65 to 74 Years | 99 | 23.4% |
| 75 to 84 Years | 49 | 11.6% |
| 85 Years and Over | 26 | 6.1% |
| Total | 424 | 100.0% |
Housing Finances in Absarokee
Median Income by Occupancy in Absarokee
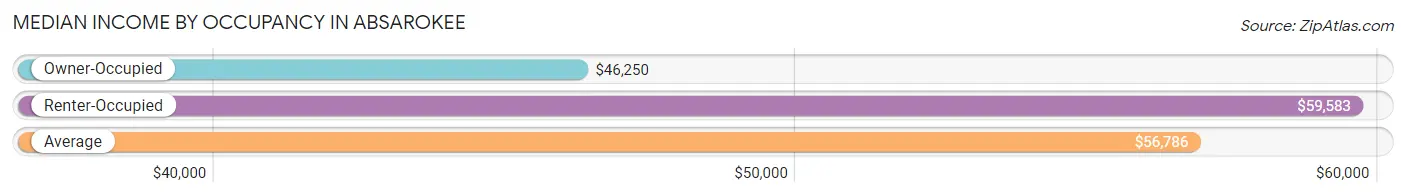
| Occupancy Type | # Households | Median Income |
| Owner-Occupied | 323 (76.2%) | $46,250 |
| Renter-Occupied | 101 (23.8%) | $59,583 |
| Average | 424 (100.0%) | $56,786 |
Occupancy by Householder Income Bracket in Absarokee
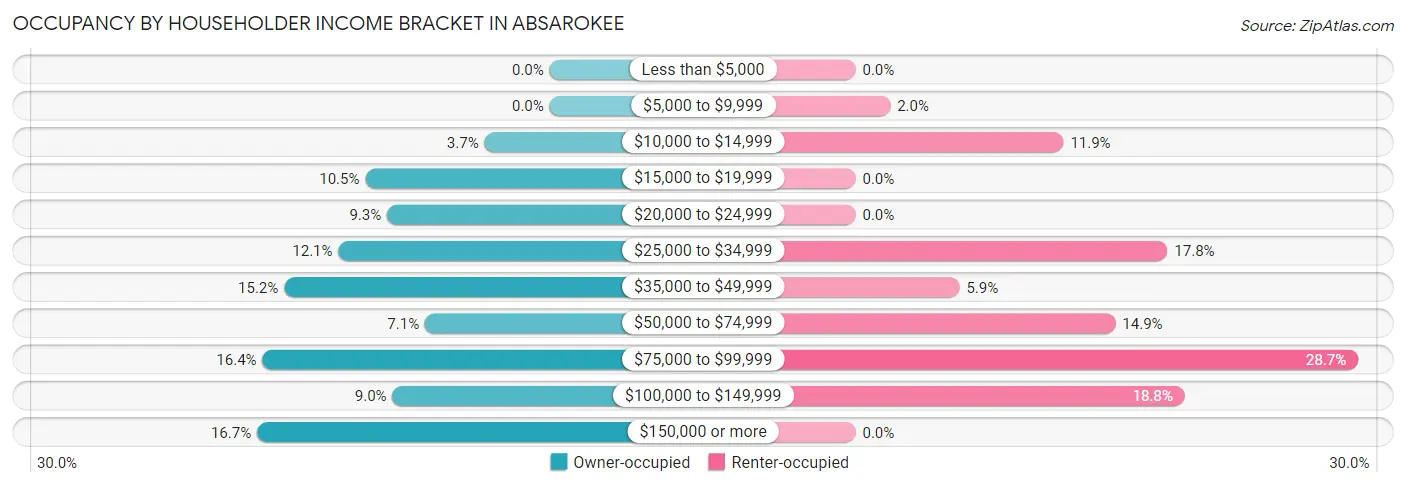
| Income Bracket | Owner-occupied | Renter-occupied |
| Less than $5,000 | 0 (0.0%) | 0 (0.0%) |
| $5,000 to $9,999 | 0 (0.0%) | 2 (2.0%) |
| $10,000 to $14,999 | 12 (3.7%) | 12 (11.9%) |
| $15,000 to $19,999 | 34 (10.5%) | 0 (0.0%) |
| $20,000 to $24,999 | 30 (9.3%) | 0 (0.0%) |
| $25,000 to $34,999 | 39 (12.1%) | 18 (17.8%) |
| $35,000 to $49,999 | 49 (15.2%) | 6 (5.9%) |
| $50,000 to $74,999 | 23 (7.1%) | 15 (14.8%) |
| $75,000 to $99,999 | 53 (16.4%) | 29 (28.7%) |
| $100,000 to $149,999 | 29 (9.0%) | 19 (18.8%) |
| $150,000 or more | 54 (16.7%) | 0 (0.0%) |
| Total | 323 (100.0%) | 101 (100.0%) |
Monthly Housing Cost Tiers in Absarokee
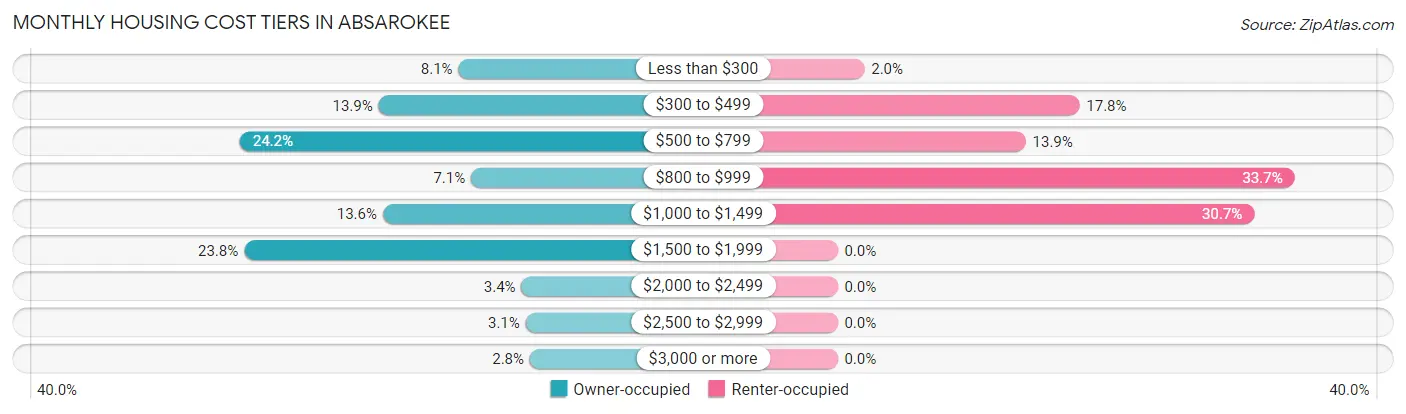
| Monthly Cost | Owner-occupied | Renter-occupied |
| Less than $300 | 26 (8.1%) | 2 (2.0%) |
| $300 to $499 | 45 (13.9%) | 18 (17.8%) |
| $500 to $799 | 78 (24.1%) | 14 (13.9%) |
| $800 to $999 | 23 (7.1%) | 34 (33.7%) |
| $1,000 to $1,499 | 44 (13.6%) | 31 (30.7%) |
| $1,500 to $1,999 | 77 (23.8%) | 0 (0.0%) |
| $2,000 to $2,499 | 11 (3.4%) | 0 (0.0%) |
| $2,500 to $2,999 | 10 (3.1%) | 0 (0.0%) |
| $3,000 or more | 9 (2.8%) | 0 (0.0%) |
| Total | 323 (100.0%) | 101 (100.0%) |
Physical Housing Characteristics in Absarokee
Housing Structures in Absarokee
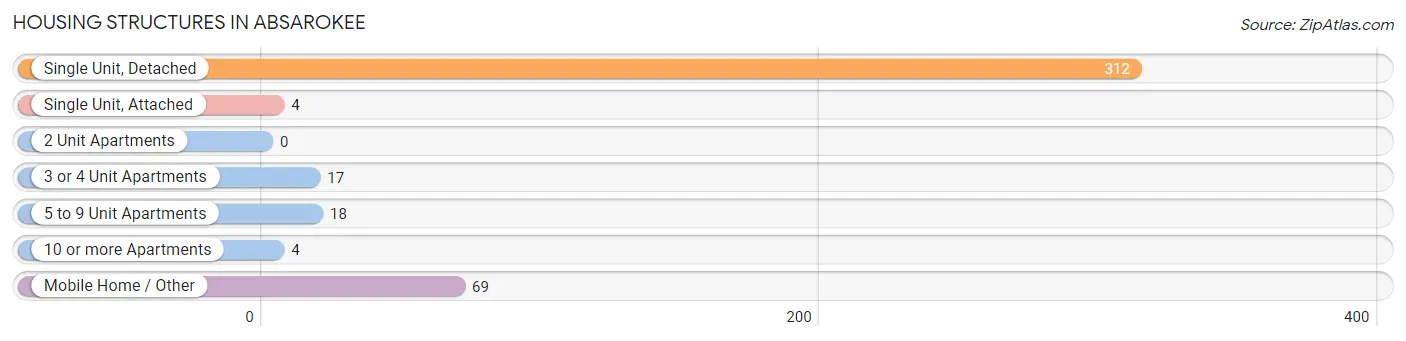
| Structure Type | # Housing Units | % Housing Units |
| Single Unit, Detached | 312 | 73.6% |
| Single Unit, Attached | 4 | 0.9% |
| 2 Unit Apartments | 0 | 0.0% |
| 3 or 4 Unit Apartments | 17 | 4.0% |
| 5 to 9 Unit Apartments | 18 | 4.3% |
| 10 or more Apartments | 4 | 0.9% |
| Mobile Home / Other | 69 | 16.3% |
| Total | 424 | 100.0% |
Housing Structures by Occupancy in Absarokee
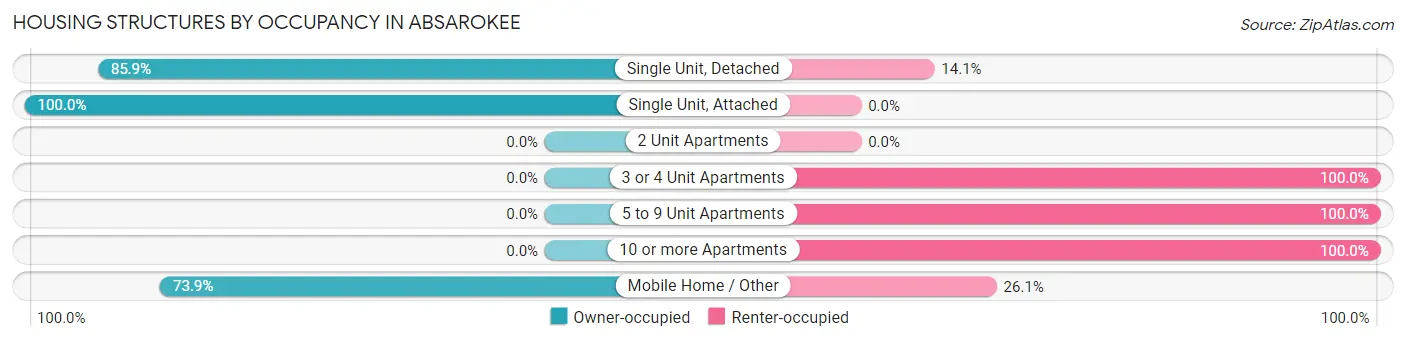
| Structure Type | Owner-occupied | Renter-occupied |
| Single Unit, Detached | 268 (85.9%) | 44 (14.1%) |
| Single Unit, Attached | 4 (100.0%) | 0 (0.0%) |
| 2 Unit Apartments | 0 (0.0%) | 0 (0.0%) |
| 3 or 4 Unit Apartments | 0 (0.0%) | 17 (100.0%) |
| 5 to 9 Unit Apartments | 0 (0.0%) | 18 (100.0%) |
| 10 or more Apartments | 0 (0.0%) | 4 (100.0%) |
| Mobile Home / Other | 51 (73.9%) | 18 (26.1%) |
| Total | 323 (76.2%) | 101 (23.8%) |
Housing Structures by Number of Rooms in Absarokee
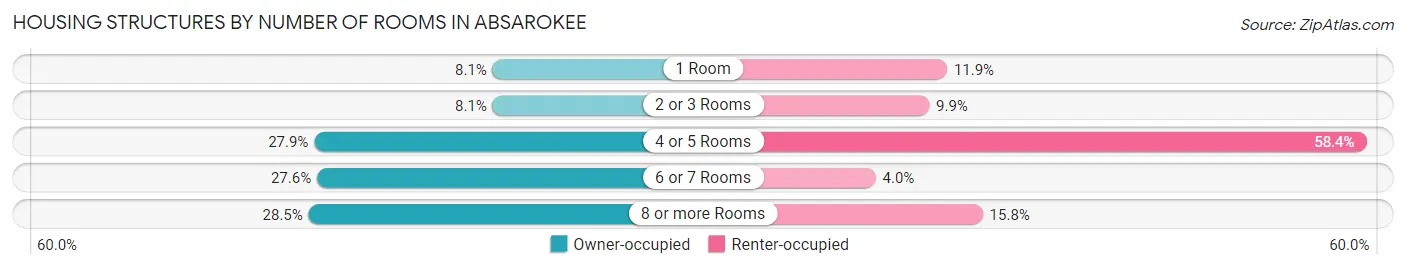
| Number of Rooms | Owner-occupied | Renter-occupied |
| 1 Room | 26 (8.1%) | 12 (11.9%) |
| 2 or 3 Rooms | 26 (8.1%) | 10 (9.9%) |
| 4 or 5 Rooms | 90 (27.9%) | 59 (58.4%) |
| 6 or 7 Rooms | 89 (27.6%) | 4 (4.0%) |
| 8 or more Rooms | 92 (28.5%) | 16 (15.8%) |
| Total | 323 (100.0%) | 101 (100.0%) |
Housing Structure by Heating Type in Absarokee
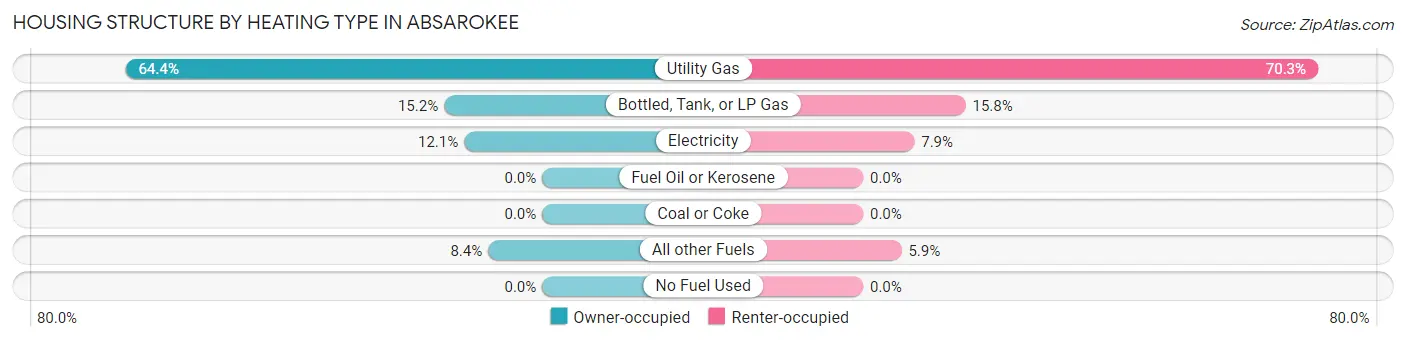
| Heating Type | Owner-occupied | Renter-occupied |
| Utility Gas | 208 (64.4%) | 71 (70.3%) |
| Bottled, Tank, or LP Gas | 49 (15.2%) | 16 (15.8%) |
| Electricity | 39 (12.1%) | 8 (7.9%) |
| Fuel Oil or Kerosene | 0 (0.0%) | 0 (0.0%) |
| Coal or Coke | 0 (0.0%) | 0 (0.0%) |
| All other Fuels | 27 (8.4%) | 6 (5.9%) |
| No Fuel Used | 0 (0.0%) | 0 (0.0%) |
| Total | 323 (100.0%) | 101 (100.0%) |
Household Vehicle Usage in Absarokee
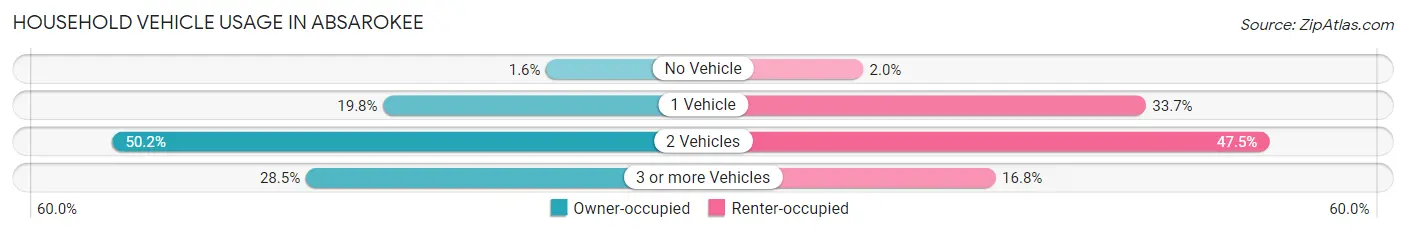
| Vehicles per Household | Owner-occupied | Renter-occupied |
| No Vehicle | 5 (1.5%) | 2 (2.0%) |
| 1 Vehicle | 64 (19.8%) | 34 (33.7%) |
| 2 Vehicles | 162 (50.1%) | 48 (47.5%) |
| 3 or more Vehicles | 92 (28.5%) | 17 (16.8%) |
| Total | 323 (100.0%) | 101 (100.0%) |
Real Estate & Mortgages in Absarokee
Real Estate and Mortgage Overview in Absarokee
| Characteristic | Without Mortgage | With Mortgage |
| Housing Units | 152 | 171 |
| Median Property Value | $216,700 | $266,300 |
| Median Household Income | $32,212 | $41 |
| Monthly Housing Costs | $512 | $9 |
| Real Estate Taxes | $1,694 | $0 |
Property Value by Mortgage Status in Absarokee
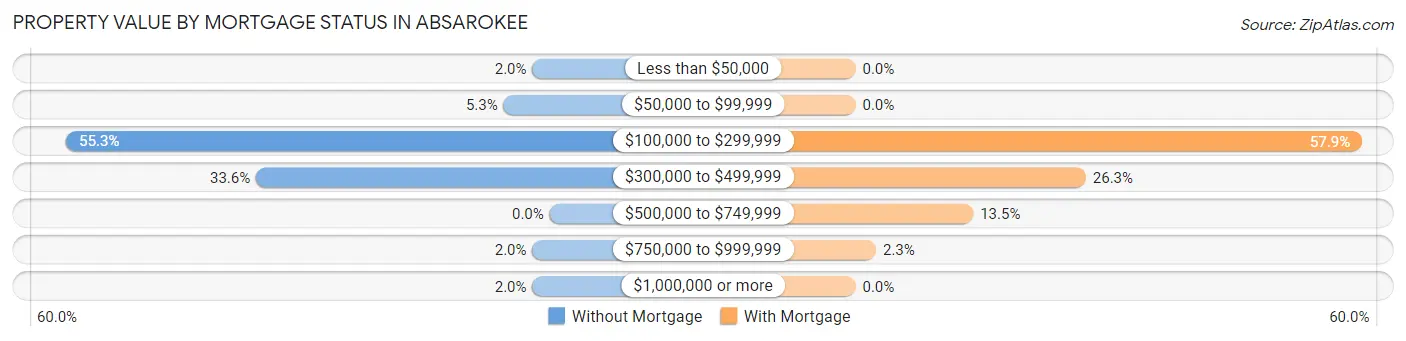
| Property Value | Without Mortgage | With Mortgage |
| Less than $50,000 | 3 (2.0%) | 0 (0.0%) |
| $50,000 to $99,999 | 8 (5.3%) | 0 (0.0%) |
| $100,000 to $299,999 | 84 (55.3%) | 99 (57.9%) |
| $300,000 to $499,999 | 51 (33.6%) | 45 (26.3%) |
| $500,000 to $749,999 | 0 (0.0%) | 23 (13.5%) |
| $750,000 to $999,999 | 3 (2.0%) | 4 (2.3%) |
| $1,000,000 or more | 3 (2.0%) | 0 (0.0%) |
| Total | 152 (100.0%) | 171 (100.0%) |
Household Income by Mortgage Status in Absarokee
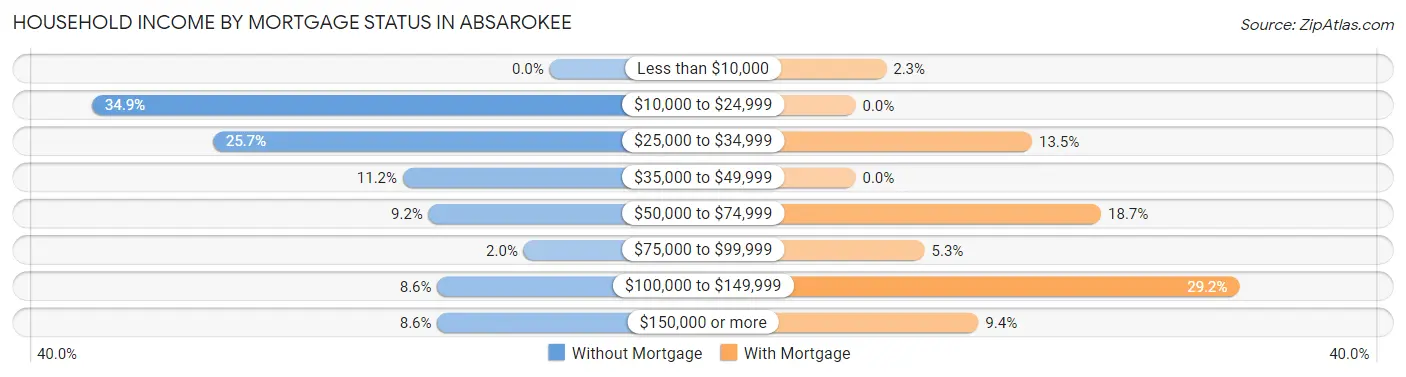
| Household Income | Without Mortgage | With Mortgage |
| Less than $10,000 | 0 (0.0%) | 4 (2.3%) |
| $10,000 to $24,999 | 53 (34.9%) | 0 (0.0%) |
| $25,000 to $34,999 | 39 (25.7%) | 23 (13.5%) |
| $35,000 to $49,999 | 17 (11.2%) | 0 (0.0%) |
| $50,000 to $74,999 | 14 (9.2%) | 32 (18.7%) |
| $75,000 to $99,999 | 3 (2.0%) | 9 (5.3%) |
| $100,000 to $149,999 | 13 (8.6%) | 50 (29.2%) |
| $150,000 or more | 13 (8.6%) | 16 (9.4%) |
| Total | 152 (100.0%) | 171 (100.0%) |
Property Value to Household Income Ratio in Absarokee
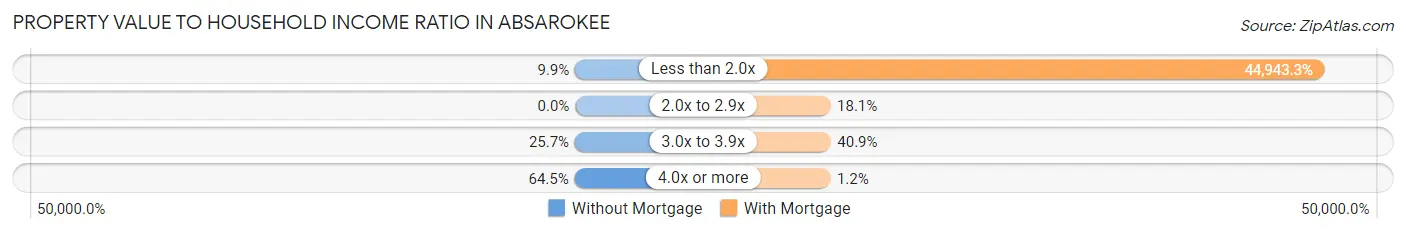
| Value-to-Income Ratio | Without Mortgage | With Mortgage |
| Less than 2.0x | 15 (9.9%) | 76,853 (44,943.3%) |
| 2.0x to 2.9x | 0 (0.0%) | 31 (18.1%) |
| 3.0x to 3.9x | 39 (25.7%) | 70 (40.9%) |
| 4.0x or more | 98 (64.5%) | 2 (1.2%) |
| Total | 152 (100.0%) | 171 (100.0%) |
Real Estate Taxes by Mortgage Status in Absarokee
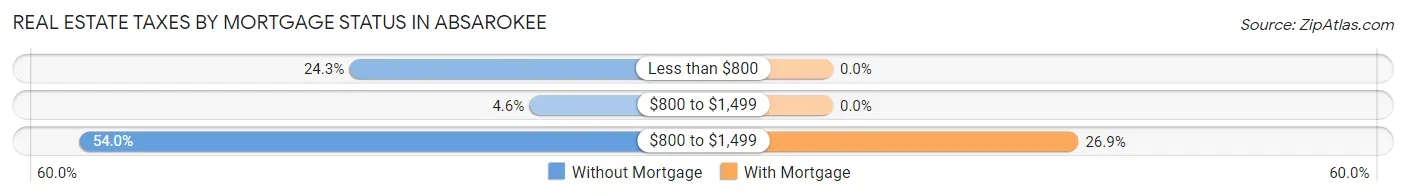
| Property Taxes | Without Mortgage | With Mortgage |
| Less than $800 | 37 (24.3%) | 0 (0.0%) |
| $800 to $1,499 | 7 (4.6%) | 0 (0.0%) |
| $800 to $1,499 | 82 (53.9%) | 46 (26.9%) |
| Total | 152 (100.0%) | 171 (100.0%) |
Health & Disability in Absarokee
Health Insurance Coverage by Age in Absarokee
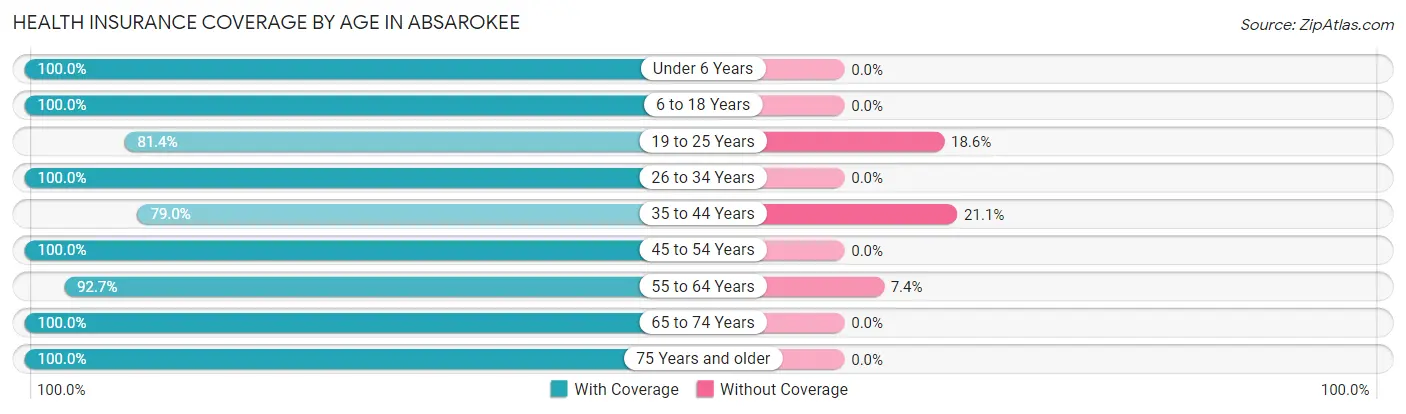
| Age Bracket | With Coverage | Without Coverage |
| Under 6 Years | 51 (100.0%) | 0 (0.0%) |
| 6 to 18 Years | 106 (100.0%) | 0 (0.0%) |
| 19 to 25 Years | 70 (81.4%) | 16 (18.6%) |
| 26 to 34 Years | 55 (100.0%) | 0 (0.0%) |
| 35 to 44 Years | 75 (78.9%) | 20 (21.0%) |
| 45 to 54 Years | 71 (100.0%) | 0 (0.0%) |
| 55 to 64 Years | 126 (92.6%) | 10 (7.3%) |
| 65 to 74 Years | 182 (100.0%) | 0 (0.0%) |
| 75 Years and older | 87 (100.0%) | 0 (0.0%) |
| Total | 823 (94.7%) | 46 (5.3%) |
Health Insurance Coverage by Citizenship Status in Absarokee
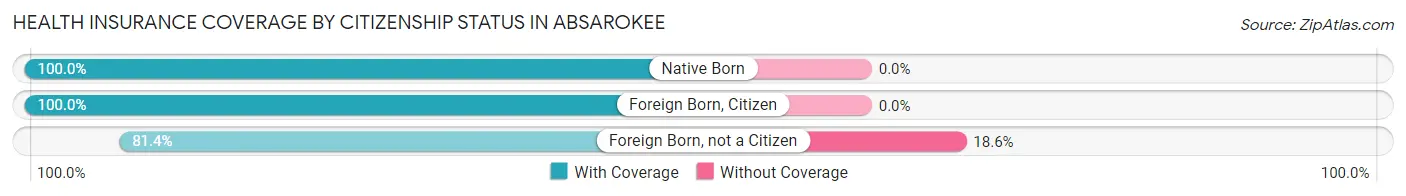
| Citizenship Status | With Coverage | Without Coverage |
| Native Born | 51 (100.0%) | 0 (0.0%) |
| Foreign Born, Citizen | 106 (100.0%) | 0 (0.0%) |
| Foreign Born, not a Citizen | 70 (81.4%) | 16 (18.6%) |
Health Insurance Coverage by Household Income in Absarokee
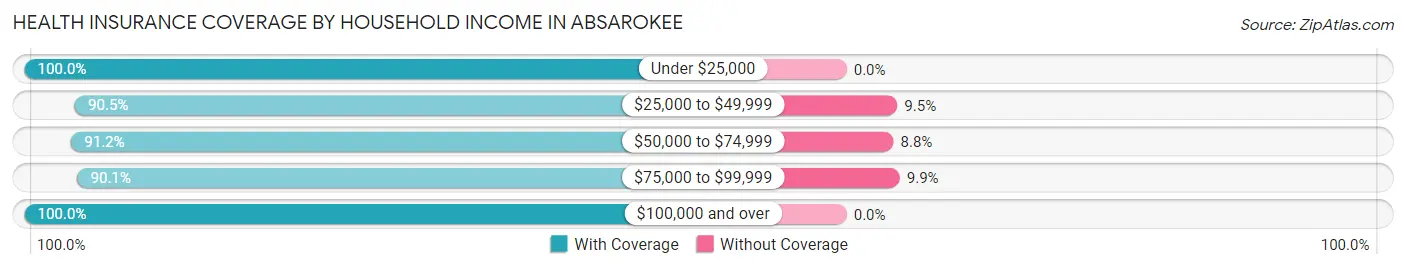
| Household Income | With Coverage | Without Coverage |
| Under $25,000 | 131 (100.0%) | 0 (0.0%) |
| $25,000 to $49,999 | 191 (90.5%) | 20 (9.5%) |
| $50,000 to $74,999 | 104 (91.2%) | 10 (8.8%) |
| $75,000 to $99,999 | 145 (90.1%) | 16 (9.9%) |
| $100,000 and over | 252 (100.0%) | 0 (0.0%) |
Public vs Private Health Insurance Coverage by Age in Absarokee
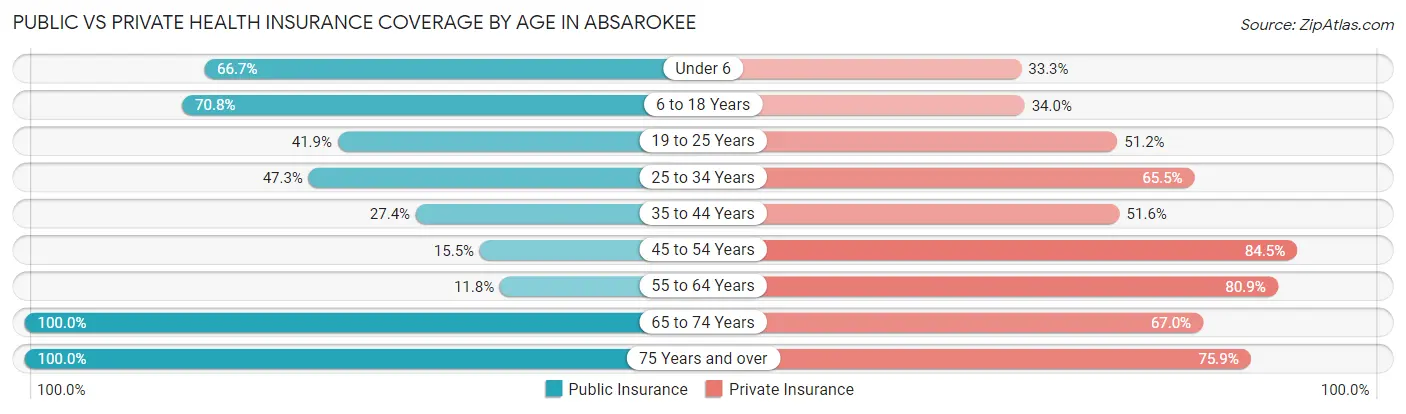
| Age Bracket | Public Insurance | Private Insurance |
| Under 6 | 34 (66.7%) | 17 (33.3%) |
| 6 to 18 Years | 75 (70.8%) | 36 (34.0%) |
| 19 to 25 Years | 36 (41.9%) | 44 (51.2%) |
| 25 to 34 Years | 26 (47.3%) | 36 (65.4%) |
| 35 to 44 Years | 26 (27.4%) | 49 (51.6%) |
| 45 to 54 Years | 11 (15.5%) | 60 (84.5%) |
| 55 to 64 Years | 16 (11.8%) | 110 (80.9%) |
| 65 to 74 Years | 182 (100.0%) | 122 (67.0%) |
| 75 Years and over | 87 (100.0%) | 66 (75.9%) |
| Total | 493 (56.7%) | 540 (62.1%) |
Disability Status by Sex by Age in Absarokee
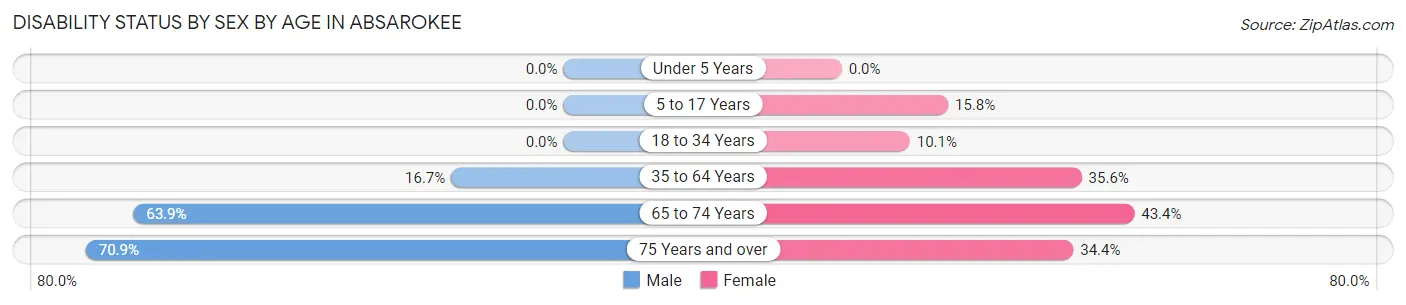
| Age Bracket | Male | Female |
| Under 5 Years | 0 (0.0%) | 0 (0.0%) |
| 5 to 17 Years | 0 (0.0%) | 12 (15.8%) |
| 18 to 34 Years | 0 (0.0%) | 10 (10.1%) |
| 35 to 64 Years | 26 (16.7%) | 52 (35.6%) |
| 65 to 74 Years | 53 (63.9%) | 43 (43.4%) |
| 75 Years and over | 39 (70.9%) | 11 (34.4%) |
Disability Class by Sex by Age in Absarokee
Disability Class: Hearing Difficulty
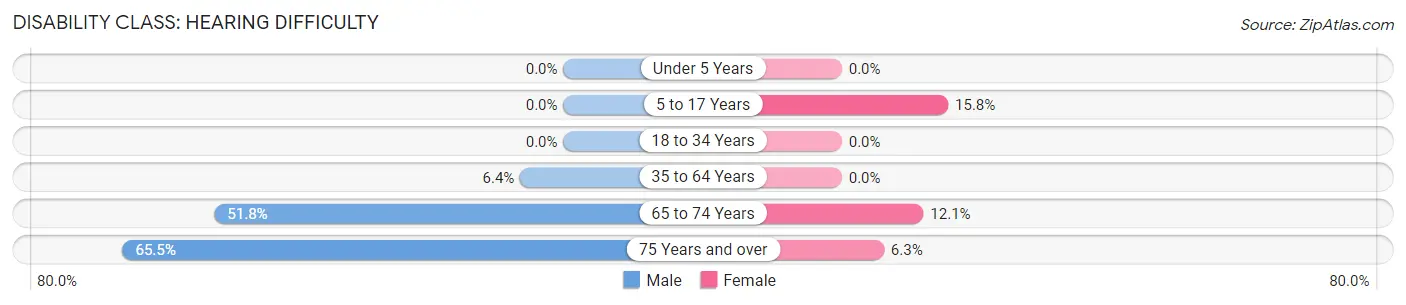
| Age Bracket | Male | Female |
| Under 5 Years | 0 (0.0%) | 0 (0.0%) |
| 5 to 17 Years | 0 (0.0%) | 12 (15.8%) |
| 18 to 34 Years | 0 (0.0%) | 0 (0.0%) |
| 35 to 64 Years | 10 (6.4%) | 0 (0.0%) |
| 65 to 74 Years | 43 (51.8%) | 12 (12.1%) |
| 75 Years and over | 36 (65.4%) | 2 (6.2%) |
Disability Class: Vision Difficulty
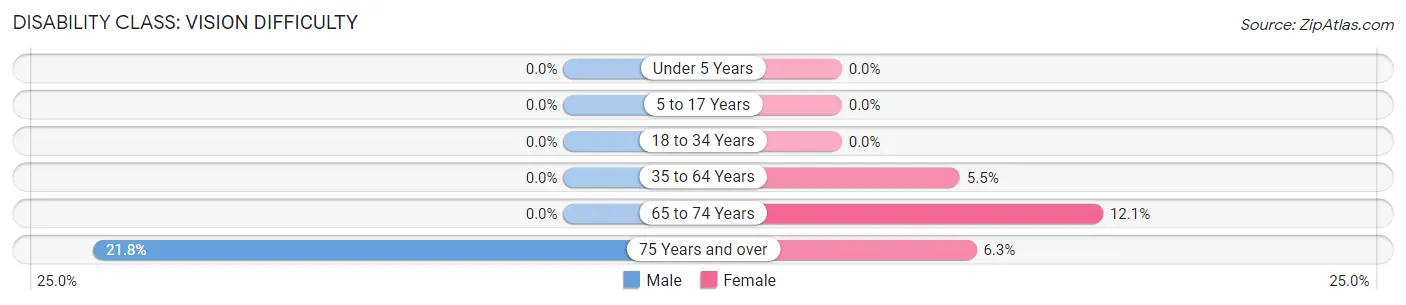
| Age Bracket | Male | Female |
| Under 5 Years | 0 (0.0%) | 0 (0.0%) |
| 5 to 17 Years | 0 (0.0%) | 0 (0.0%) |
| 18 to 34 Years | 0 (0.0%) | 0 (0.0%) |
| 35 to 64 Years | 0 (0.0%) | 8 (5.5%) |
| 65 to 74 Years | 0 (0.0%) | 12 (12.1%) |
| 75 Years and over | 12 (21.8%) | 2 (6.2%) |
Disability Class: Cognitive Difficulty
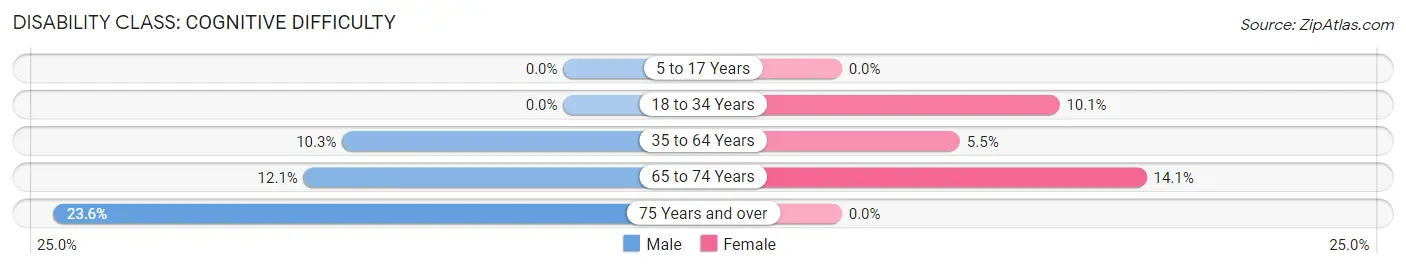
| Age Bracket | Male | Female |
| 5 to 17 Years | 0 (0.0%) | 0 (0.0%) |
| 18 to 34 Years | 0 (0.0%) | 10 (10.1%) |
| 35 to 64 Years | 16 (10.3%) | 8 (5.5%) |
| 65 to 74 Years | 10 (12.0%) | 14 (14.1%) |
| 75 Years and over | 13 (23.6%) | 0 (0.0%) |
Disability Class: Ambulatory Difficulty
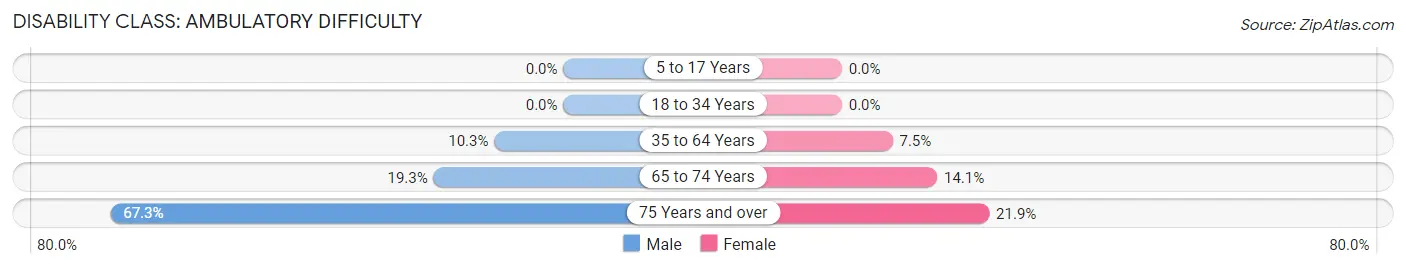
| Age Bracket | Male | Female |
| 5 to 17 Years | 0 (0.0%) | 0 (0.0%) |
| 18 to 34 Years | 0 (0.0%) | 0 (0.0%) |
| 35 to 64 Years | 16 (10.3%) | 11 (7.5%) |
| 65 to 74 Years | 16 (19.3%) | 14 (14.1%) |
| 75 Years and over | 37 (67.3%) | 7 (21.9%) |
Disability Class: Self-Care Difficulty
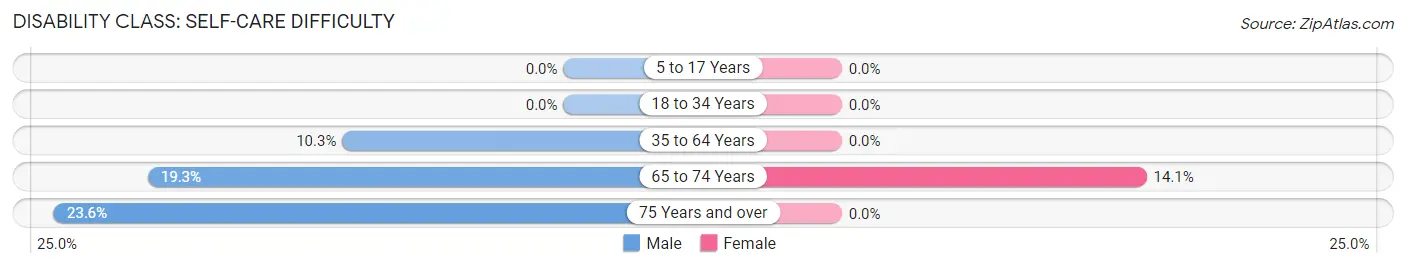
| Age Bracket | Male | Female |
| 5 to 17 Years | 0 (0.0%) | 0 (0.0%) |
| 18 to 34 Years | 0 (0.0%) | 0 (0.0%) |
| 35 to 64 Years | 16 (10.3%) | 0 (0.0%) |
| 65 to 74 Years | 16 (19.3%) | 14 (14.1%) |
| 75 Years and over | 13 (23.6%) | 0 (0.0%) |
Technology Access in Absarokee
Computing Device Access in Absarokee
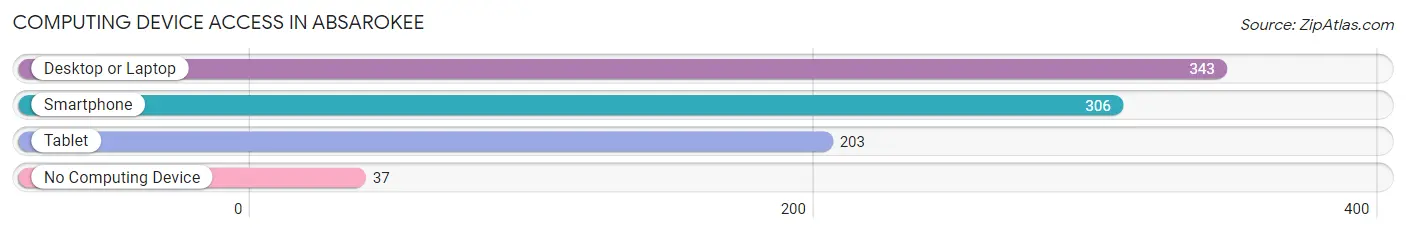
| Device Type | # Households | % Households |
| Desktop or Laptop | 343 | 80.9% |
| Smartphone | 306 | 72.2% |
| Tablet | 203 | 47.9% |
| No Computing Device | 37 | 8.7% |
| Total | 424 | 100.0% |
Internet Access in Absarokee
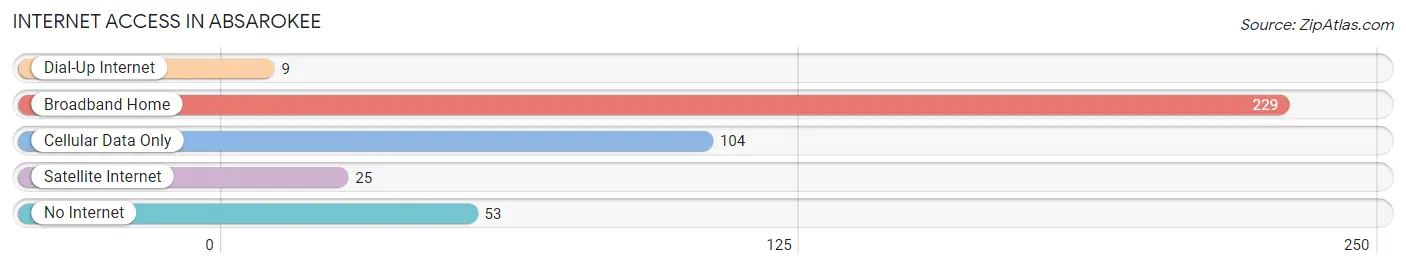
| Internet Type | # Households | % Households |
| Dial-Up Internet | 9 | 2.1% |
| Broadband Home | 229 | 54.0% |
| Cellular Data Only | 104 | 24.5% |
| Satellite Internet | 25 | 5.9% |
| No Internet | 53 | 12.5% |
| Total | 424 | 100.0% |
Absarokee Summary
Absarokee, Montana is a small town located in the Stillwater County of the state of Montana. It is situated in the foothills of the Beartooth Mountains, and is surrounded by the Custer National Forest. The town has a population of approximately 1,000 people, and is located about 25 miles south of Billings, Montana.
History
Absarokee was founded in 1883 by a group of settlers from the Crow Indian Tribe. The town was named after the Crow word for “children of the large-beaked bird”, which is a reference to the large number of hawks that inhabit the area. The town was originally a trading post for the Crow Indians, and was also used as a stopover for travelers heading to the gold fields of Montana.
In the early 1900s, the town began to grow and develop. The first school was built in 1906, and the first post office was established in 1907. The town also had a newspaper, the Absarokee Herald, which was published from 1908 to 1912.
In the 1920s, the town experienced a period of growth and prosperity. The population increased from 500 to 1,000, and the town was home to several businesses, including a bank, a hotel, a movie theater, and a variety of stores.
Geography
Absarokee is located in the Stillwater Valley, which is part of the Yellowstone River drainage basin. The town is situated at an elevation of 4,000 feet, and is surrounded by the Beartooth Mountains to the east and the Pryor Mountains to the west. The town is located about 25 miles south of Billings, Montana, and is about 50 miles north of Cody, Wyoming.
The climate in Absarokee is semi-arid, with hot summers and cold winters. The average annual temperature is around 45 degrees Fahrenheit, and the average annual precipitation is around 12 inches.
Economy
The economy of Absarokee is largely based on agriculture and tourism. The town is home to several farms, which produce a variety of crops, including wheat, barley, oats, and hay. The town is also home to several tourist attractions, including the Absarokee Museum, the Absarokee Golf Course, and the Absarokee Ski Resort.
Demographics
As of the 2010 census, the population of Absarokee was 1,037. The racial makeup of the town was 97.2% White, 0.7% Native American, 0.3% Asian, 0.2% from other races, and 1.6% from two or more races. The median household income was $41,250, and the median family income was $50,000. The per capita income was $20,945.
Conclusion
Absarokee, Montana is a small town located in the Stillwater County of the state of Montana. It was founded in 1883 by a group of settlers from the Crow Indian Tribe, and has a population of approximately 1,000 people. The town is situated in the foothills of the Beartooth Mountains, and is surrounded by the Custer National Forest. The economy of Absarokee is largely based on agriculture and tourism, and the town is home to several tourist attractions. The population of Absarokee is 97.2% White, 0.7% Native American, 0.3% Asian, 0.2% from other races, and 1.6% from two or more races. The median household income was $41,250, and the median family income was $50,000.
Common Questions
What is Per Capita Income in Absarokee?
Per Capita income in Absarokee is $46,624.
What is the Median Family Income in Absarokee?
Median Family Income in Absarokee is $58,576.
What is the Median Household income in Absarokee?
Median Household Income in Absarokee is $56,786.
What is Inequality or Gini Index in Absarokee?
Inequality or Gini Index in Absarokee is 0.53.
What is the Total Population of Absarokee?
Total Population of Absarokee is 869.
What is the Total Male Population of Absarokee?
Total Male Population of Absarokee is 415.
What is the Total Female Population of Absarokee?
Total Female Population of Absarokee is 454.
What is the Ratio of Males per 100 Females in Absarokee?
There are 91.41 Males per 100 Females in Absarokee.
What is the Ratio of Females per 100 Males in Absarokee?
There are 109.40 Females per 100 Males in Absarokee.
What is the Median Population Age in Absarokee?
Median Population Age in Absarokee is 49.7 Years.
What is the Average Family Size in Absarokee
Average Family Size in Absarokee is 2.6 People.
What is the Average Household Size in Absarokee
Average Household Size in Absarokee is 2.0 People.
How Large is the Labor Force in Absarokee?
There are 427 People in the Labor Forcein in Absarokee.
What is the Percentage of People in the Labor Force in Absarokee?
59.4% of People are in the Labor Force in Absarokee.