Sidney, MT Map & Demographics
Sidney Map
Sidney Overview
$34,381
PER CAPITA INCOME
$88,750
AVG FAMILY INCOME
$56,696
AVG HOUSEHOLD INCOME
46.2%
WAGE / INCOME GAP [ % ]
53.8¢/ $1
WAGE / INCOME GAP [ $ ]
0.49
INEQUALITY / GINI INDEX
6,257
TOTAL POPULATION
3,010
MALE POPULATION
3,247
FEMALE POPULATION
92.70
MALES / 100 FEMALES
107.87
FEMALES / 100 MALES
39.4
MEDIAN AGE
3.5
AVG FAMILY SIZE
2.5
AVG HOUSEHOLD SIZE
3,290
LABOR FORCE [ PEOPLE ]
67.7%
PERCENT IN LABOR FORCE
5.1%
UNEMPLOYMENT RATE
Sidney Zip Codes
Sidney Area Codes
Income in Sidney
Income Overview in Sidney
Per Capita Income in Sidney is $34,381, while median incomes of families and households are $88,750 and $56,696 respectively.
| Characteristic | Number | Measure |
| Per Capita Income | 6,257 | $34,381 |
| Median Family Income | 1,329 | $88,750 |
| Mean Family Income | 1,329 | $107,457 |
| Median Household Income | 2,516 | $56,696 |
| Mean Household Income | 2,516 | $84,971 |
| Income Deficit | 1,329 | $0 |
| Wage / Income Gap (%) | 6,257 | 46.23% |
| Wage / Income Gap ($) | 6,257 | 53.77¢ per $1 |
| Gini / Inequality Index | 6,257 | 0.49 |
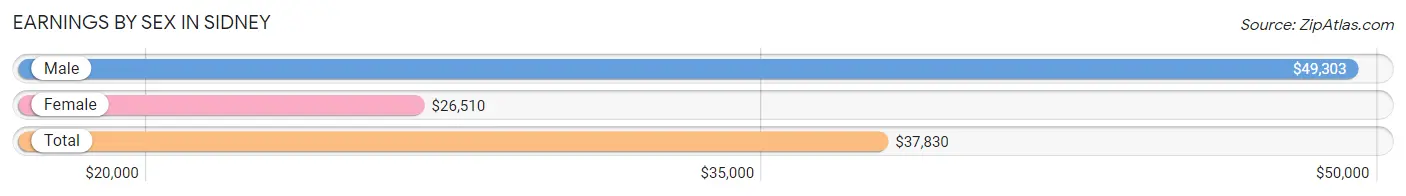
Earnings by Sex in Sidney
Average Earnings in Sidney are $37,830, $49,303 for men and $26,510 for women, a difference of 46.2%.
| Sex | Number | Average Earnings |
| Male | 1,748 (49.4%) | $49,303 |
| Female | 1,789 (50.6%) | $26,510 |
| Total | 3,537 (100.0%) | $37,830 |
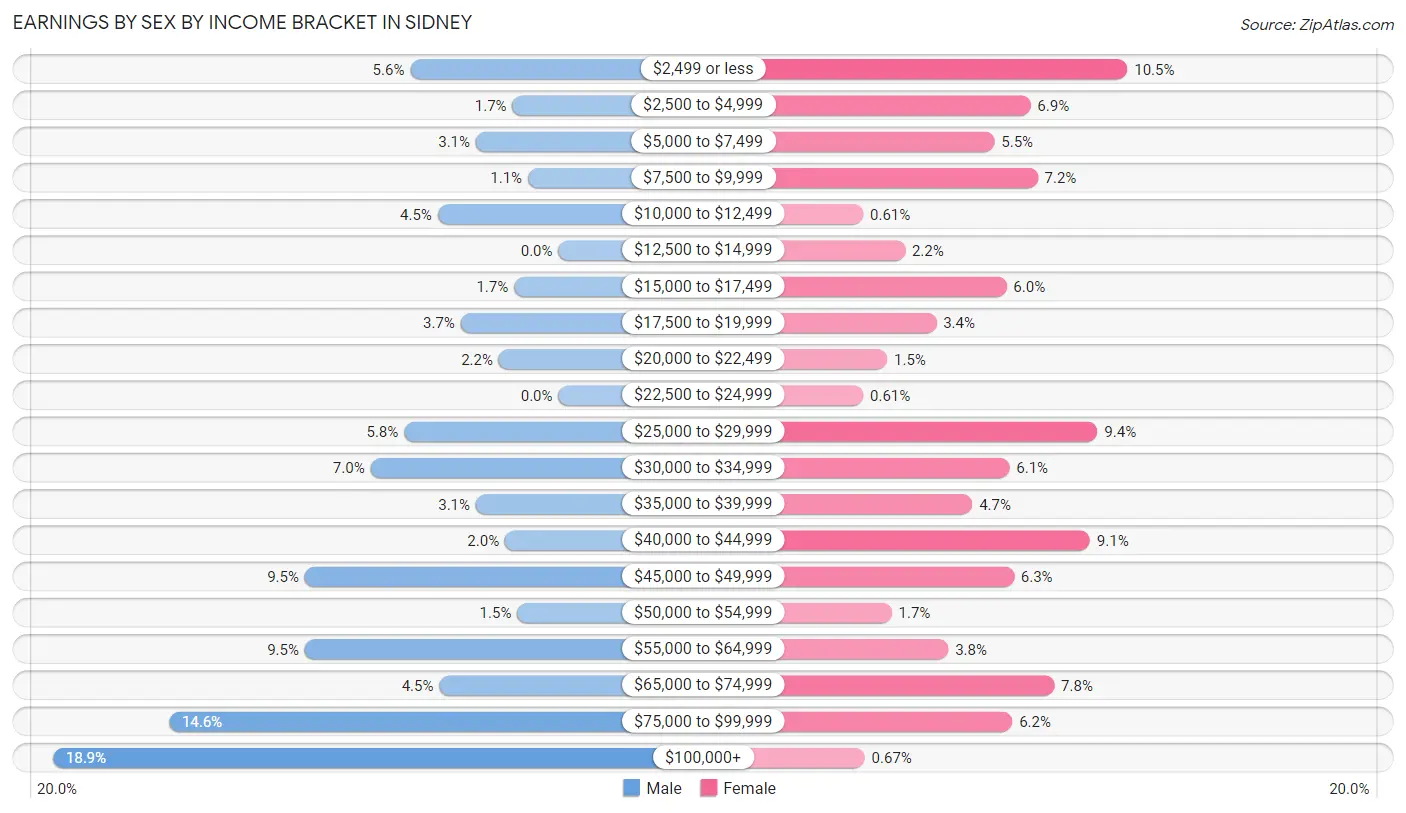
Earnings by Sex by Income Bracket in Sidney
The most common earnings brackets in Sidney are $100,000+ for men (331 | 18.9%) and $2,499 or less for women (188 | 10.5%).
| Income | Male | Female |
| $2,499 or less | 97 (5.6%) | 188 (10.5%) |
| $2,500 to $4,999 | 30 (1.7%) | 123 (6.9%) |
| $5,000 to $7,499 | 54 (3.1%) | 99 (5.5%) |
| $7,500 to $9,999 | 20 (1.1%) | 128 (7.1%) |
| $10,000 to $12,499 | 79 (4.5%) | 11 (0.6%) |
| $12,500 to $14,999 | 0 (0.0%) | 39 (2.2%) |
| $15,000 to $17,499 | 29 (1.7%) | 107 (6.0%) |
| $17,500 to $19,999 | 64 (3.7%) | 60 (3.4%) |
| $20,000 to $22,499 | 39 (2.2%) | 27 (1.5%) |
| $22,500 to $24,999 | 0 (0.0%) | 11 (0.6%) |
| $25,000 to $29,999 | 101 (5.8%) | 168 (9.4%) |
| $30,000 to $34,999 | 123 (7.0%) | 109 (6.1%) |
| $35,000 to $39,999 | 54 (3.1%) | 84 (4.7%) |
| $40,000 to $44,999 | 35 (2.0%) | 163 (9.1%) |
| $45,000 to $49,999 | 166 (9.5%) | 112 (6.3%) |
| $50,000 to $54,999 | 27 (1.5%) | 30 (1.7%) |
| $55,000 to $64,999 | 166 (9.5%) | 68 (3.8%) |
| $65,000 to $74,999 | 78 (4.5%) | 139 (7.8%) |
| $75,000 to $99,999 | 255 (14.6%) | 111 (6.2%) |
| $100,000+ | 331 (18.9%) | 12 (0.7%) |
| Total | 1,748 (100.0%) | 1,789 (100.0%) |
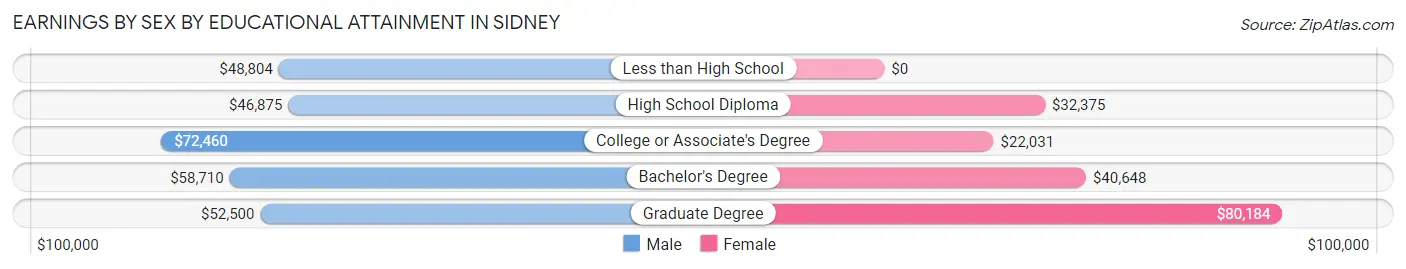
Earnings by Sex by Educational Attainment in Sidney
Average earnings in Sidney are $58,524 for men and $33,839 for women, a difference of 42.2%. Men with an educational attainment of college or associate's degree enjoy the highest average annual earnings of $72,460, while those with high school diploma education earn the least with $46,875. Women with an educational attainment of graduate degree earn the most with the average annual earnings of $80,184, while those with college or associate's degree education have the smallest earnings of $22,031.
| Educational Attainment | Male Income | Female Income |
| Less than High School | $48,804 | $0 |
| High School Diploma | $46,875 | $32,375 |
| College or Associate's Degree | $72,460 | $22,031 |
| Bachelor's Degree | $58,710 | $40,648 |
| Graduate Degree | $52,500 | $80,184 |
| Total | $58,524 | $33,839 |
Family Income in Sidney
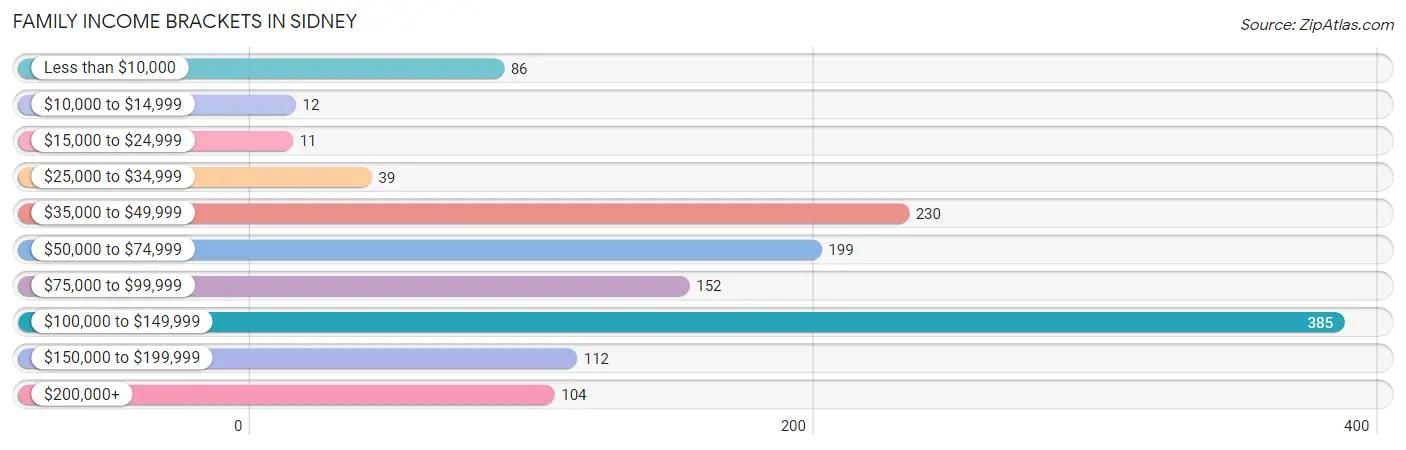
Family Income Brackets in Sidney
According to the Sidney family income data, there are 385 families falling into the $100,000 to $149,999 income range, which is the most common income bracket and makes up 29.0% of all families. Conversely, the $15,000 to $24,999 income bracket is the least frequent group with only 11 families (0.8%) belonging to this category.
| Income Bracket | # Families | % Families |
| Less than $10,000 | 86 | 6.5% |
| $10,000 to $14,999 | 12 | 0.9% |
| $15,000 to $24,999 | 11 | 0.8% |
| $25,000 to $34,999 | 39 | 2.9% |
| $35,000 to $49,999 | 230 | 17.3% |
| $50,000 to $74,999 | 199 | 15.0% |
| $75,000 to $99,999 | 152 | 11.4% |
| $100,000 to $149,999 | 385 | 29.0% |
| $150,000 to $199,999 | 112 | 8.4% |
| $200,000+ | 104 | 7.8% |
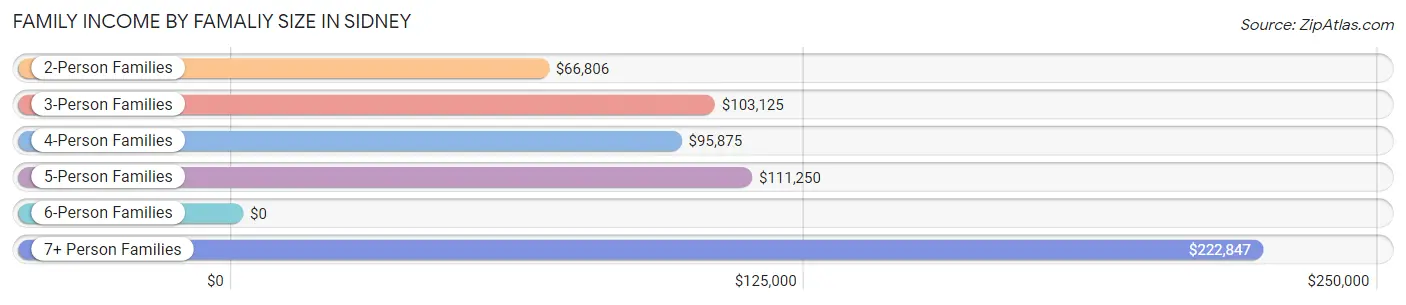
Family Income by Famaliy Size in Sidney
7+ person families (93 | 7.0%) account for the highest median family income in Sidney with $222,847 per family, while 3-person families (169 | 12.7%) have the highest median income of $34,375 per family member.
| Income Bracket | # Families | Median Income |
| 2-Person Families | 770 (57.9%) | $66,806 |
| 3-Person Families | 169 (12.7%) | $103,125 |
| 4-Person Families | 124 (9.3%) | $95,875 |
| 5-Person Families | 156 (11.7%) | $111,250 |
| 6-Person Families | 17 (1.3%) | $0 |
| 7+ Person Families | 93 (7.0%) | $222,847 |
| Total | 1,329 (100.0%) | $88,750 |
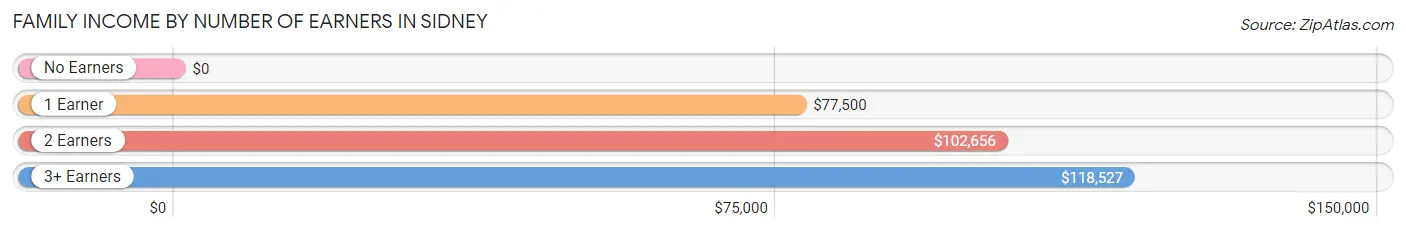
Family Income by Number of Earners in Sidney
| Number of Earners | # Families | Median Income |
| No Earners | 145 (10.9%) | $0 |
| 1 Earner | 396 (29.8%) | $77,500 |
| 2 Earners | 609 (45.8%) | $102,656 |
| 3+ Earners | 179 (13.5%) | $118,527 |
| Total | 1,329 (100.0%) | $88,750 |
Household Income in Sidney
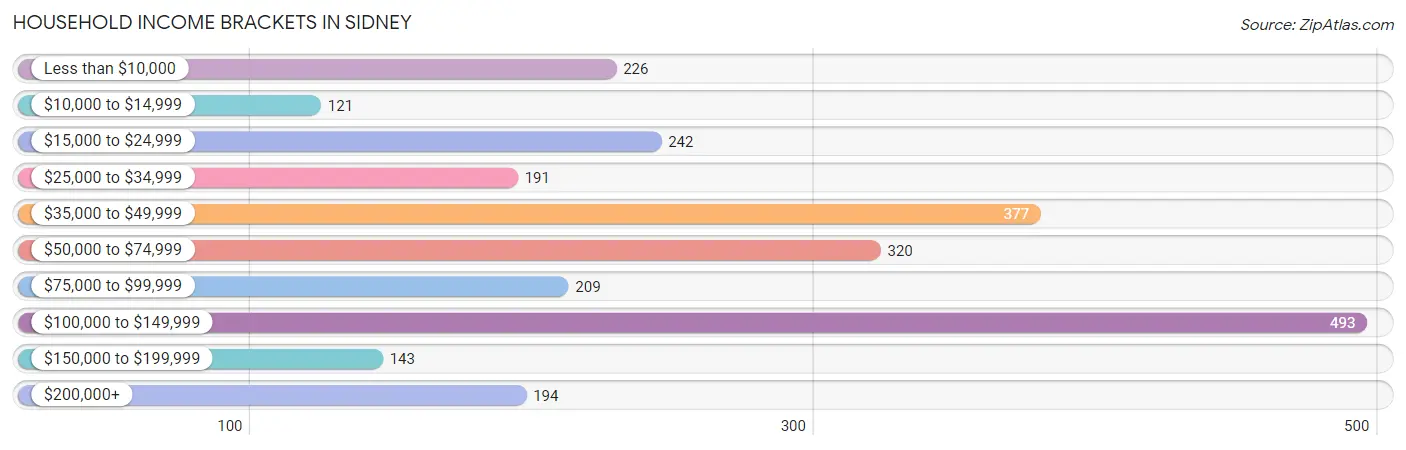
Household Income Brackets in Sidney
With 493 households falling in the category, the $100,000 to $149,999 income range is the most frequent in Sidney, accounting for 19.6% of all households. In contrast, only 121 households (4.8%) fall into the $10,000 to $14,999 income bracket, making it the least populous group.
| Income Bracket | # Households | % Households |
| Less than $10,000 | 226 | 9.0% |
| $10,000 to $14,999 | 121 | 4.8% |
| $15,000 to $24,999 | 242 | 9.6% |
| $25,000 to $34,999 | 191 | 7.6% |
| $35,000 to $49,999 | 377 | 15.0% |
| $50,000 to $74,999 | 320 | 12.7% |
| $75,000 to $99,999 | 209 | 8.3% |
| $100,000 to $149,999 | 493 | 19.6% |
| $150,000 to $199,999 | 143 | 5.7% |
| $200,000+ | 194 | 7.7% |
Household Income by Householder Age in Sidney
The median household income in Sidney is $56,696, with the highest median household income of $95,313 found in the 25 to 44 years age bracket for the primary householder. A total of 855 households (34.0%) fall into this category. Meanwhile, the 15 to 24 years age bracket for the primary householder has the lowest median household income of $0, with 169 households (6.7%) in this group.
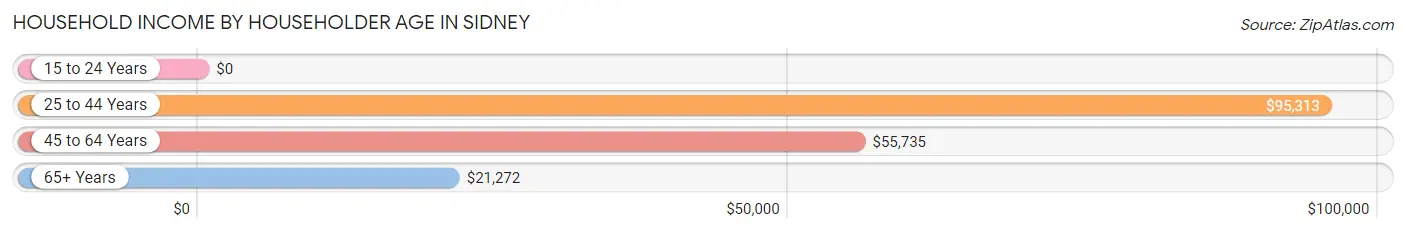
| Income Bracket | # Households | Median Income |
| 15 to 24 Years | 169 (6.7%) | $0 |
| 25 to 44 Years | 855 (34.0%) | $95,313 |
| 45 to 64 Years | 944 (37.5%) | $55,735 |
| 65+ Years | 548 (21.8%) | $21,272 |
| Total | 2,516 (100.0%) | $56,696 |
Poverty in Sidney
Income Below Poverty by Sex and Age in Sidney
With 8.0% poverty level for males and 11.2% for females among the residents of Sidney, 16 and 17 year old males and 65 to 74 year old females are the most vulnerable to poverty, with 35 males (27.1%) and 99 females (29.2%) in their respective age groups living below the poverty level.
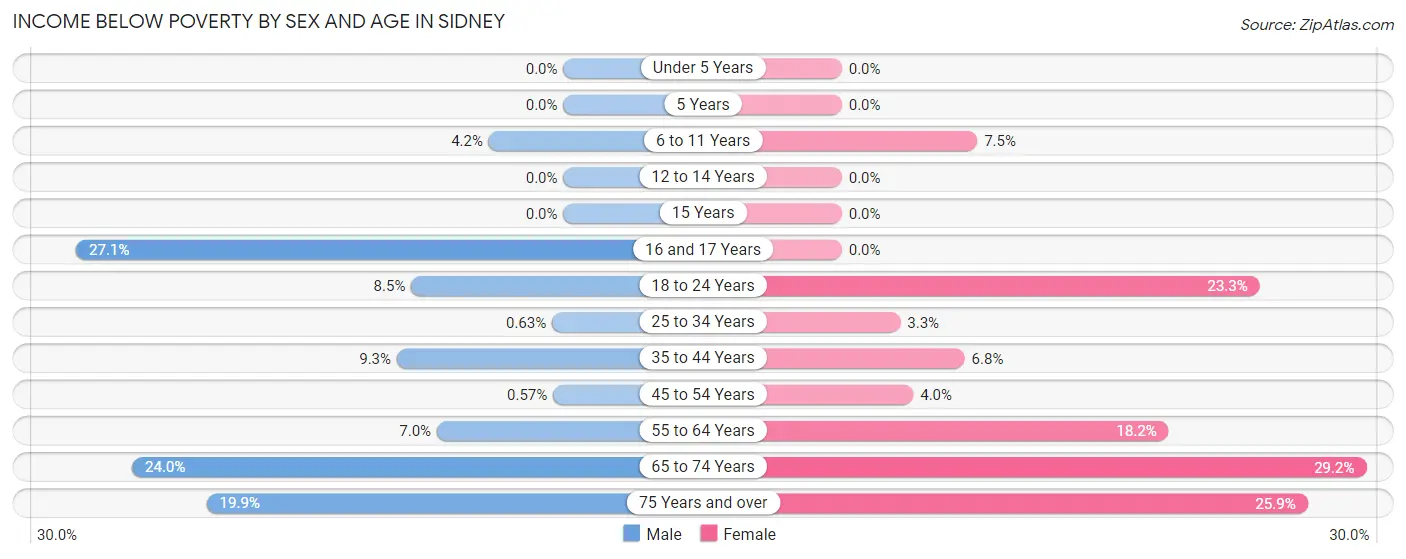
| Age Bracket | Male | Female |
| Under 5 Years | 0 (0.0%) | 0 (0.0%) |
| 5 Years | 0 (0.0%) | 0 (0.0%) |
| 6 to 11 Years | 11 (4.2%) | 23 (7.5%) |
| 12 to 14 Years | 0 (0.0%) | 0 (0.0%) |
| 15 Years | 0 (0.0%) | 0 (0.0%) |
| 16 and 17 Years | 35 (27.1%) | 0 (0.0%) |
| 18 to 24 Years | 21 (8.5%) | 60 (23.3%) |
| 25 to 34 Years | 2 (0.6%) | 12 (3.3%) |
| 35 to 44 Years | 42 (9.3%) | 34 (6.8%) |
| 45 to 54 Years | 2 (0.6%) | 15 (4.0%) |
| 55 to 64 Years | 30 (7.0%) | 81 (18.2%) |
| 65 to 74 Years | 67 (24.0%) | 99 (29.2%) |
| 75 Years and over | 29 (19.9%) | 35 (25.9%) |
| Total | 239 (8.0%) | 359 (11.2%) |
Income Above Poverty by Sex and Age in Sidney
According to the poverty statistics in Sidney, males aged under 5 years and females aged under 5 years are the age groups that are most secure financially, with 100.0% of males and 100.0% of females in these age groups living above the poverty line.
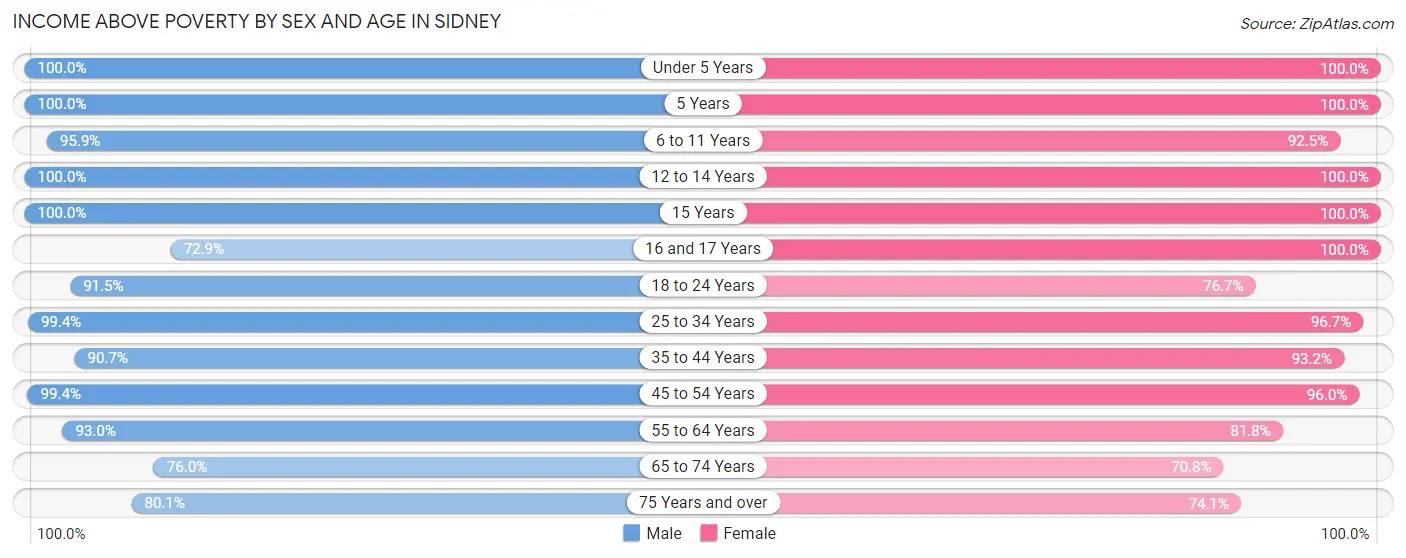
| Age Bracket | Male | Female |
| Under 5 Years | 186 (100.0%) | 138 (100.0%) |
| 5 Years | 34 (100.0%) | 37 (100.0%) |
| 6 to 11 Years | 254 (95.9%) | 282 (92.5%) |
| 12 to 14 Years | 137 (100.0%) | 141 (100.0%) |
| 15 Years | 28 (100.0%) | 80 (100.0%) |
| 16 and 17 Years | 94 (72.9%) | 86 (100.0%) |
| 18 to 24 Years | 227 (91.5%) | 198 (76.7%) |
| 25 to 34 Years | 314 (99.4%) | 356 (96.7%) |
| 35 to 44 Years | 411 (90.7%) | 463 (93.2%) |
| 45 to 54 Years | 346 (99.4%) | 362 (96.0%) |
| 55 to 64 Years | 396 (93.0%) | 364 (81.8%) |
| 65 to 74 Years | 212 (76.0%) | 240 (70.8%) |
| 75 Years and over | 117 (80.1%) | 100 (74.1%) |
| Total | 2,756 (92.0%) | 2,847 (88.8%) |
Income Below Poverty Among Married-Couple Families in Sidney
The poverty statistics for married-couple families in Sidney show that 6.1% or 66 of the total 1,076 families live below the poverty line. Families with no children have the highest poverty rate of 10.0%, comprising of 66 families. On the other hand, families with 1 or 2 children have the lowest poverty rate of 0.0%, which includes 0 families.
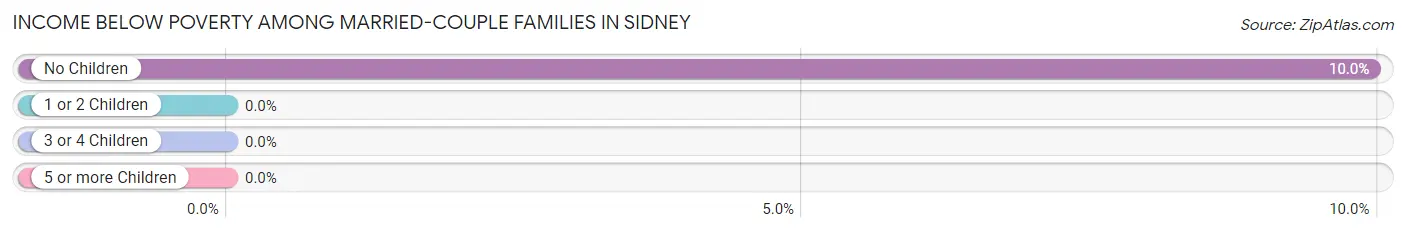
| Children | Above Poverty | Below Poverty |
| No Children | 597 (90.0%) | 66 (10.0%) |
| 1 or 2 Children | 225 (100.0%) | 0 (0.0%) |
| 3 or 4 Children | 149 (100.0%) | 0 (0.0%) |
| 5 or more Children | 39 (100.0%) | 0 (0.0%) |
| Total | 1,010 (93.9%) | 66 (6.1%) |
Income Below Poverty Among Single-Parent Households in Sidney
According to the poverty data in Sidney, 33.3% or 21 single-father households and 12.1% or 23 single-mother households are living below the poverty line. Among single-father households, those with 1 or 2 children have the highest poverty rate, with 15 households (45.5%) experiencing poverty. Likewise, among single-mother households, those with 3 or 4 children have the highest poverty rate, with 6 households (100.0%) falling below the poverty line.
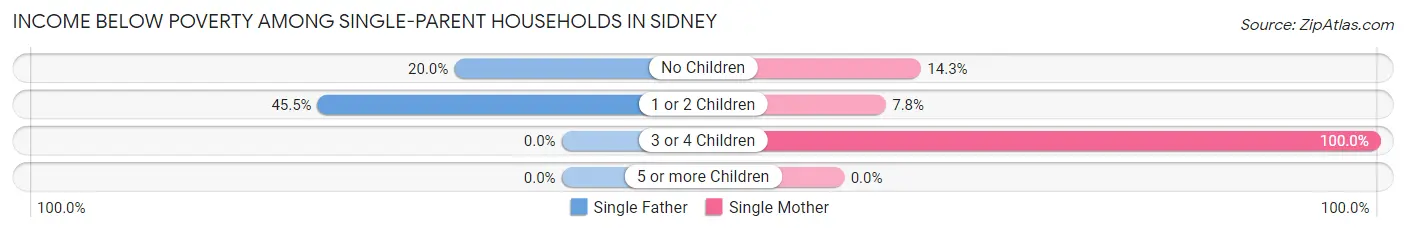
| Children | Single Father | Single Mother |
| No Children | 6 (20.0%) | 6 (14.3%) |
| 1 or 2 Children | 15 (45.5%) | 11 (7.7%) |
| 3 or 4 Children | 0 (0.0%) | 6 (100.0%) |
| 5 or more Children | 0 (0.0%) | 0 (0.0%) |
| Total | 21 (33.3%) | 23 (12.1%) |
Income Below Poverty Among Married-Couple vs Single-Parent Households in Sidney
The poverty data for Sidney shows that 66 of the married-couple family households (6.1%) and 44 of the single-parent households (17.4%) are living below the poverty level. Within the married-couple family households, those with no children have the highest poverty rate, with 66 households (10.0%) falling below the poverty line. Among the single-parent households, those with 3 or 4 children have the highest poverty rate, with 6 household (100.0%) living below poverty.
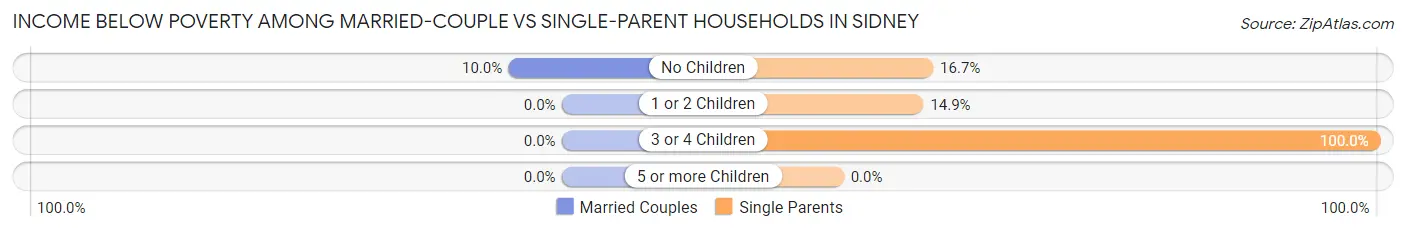
| Children | Married-Couple Families | Single-Parent Households |
| No Children | 66 (10.0%) | 12 (16.7%) |
| 1 or 2 Children | 0 (0.0%) | 26 (14.9%) |
| 3 or 4 Children | 0 (0.0%) | 6 (100.0%) |
| 5 or more Children | 0 (0.0%) | 0 (0.0%) |
| Total | 66 (6.1%) | 44 (17.4%) |
Race in Sidney
The most populous races in Sidney are White / Caucasian (5,379 | 86.0%), Two or more Races (477 | 7.6%), and Hispanic or Latino (441 | 7.0%).
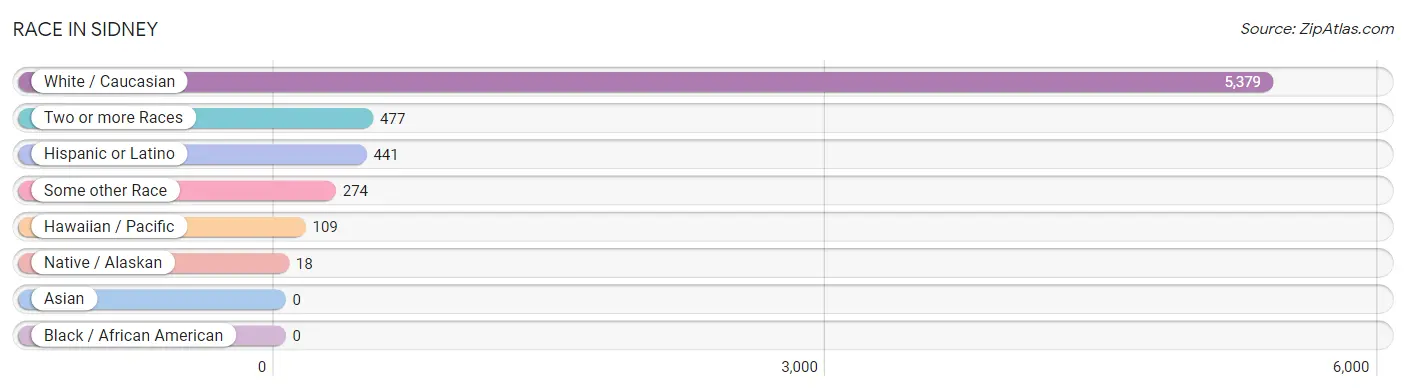
| Race | # Population | % Population |
| Asian | 0 | 0.0% |
| Black / African American | 0 | 0.0% |
| Hawaiian / Pacific | 109 | 1.7% |
| Hispanic or Latino | 441 | 7.0% |
| Native / Alaskan | 18 | 0.3% |
| White / Caucasian | 5,379 | 86.0% |
| Two or more Races | 477 | 7.6% |
| Some other Race | 274 | 4.4% |
| Total | 6,257 | 100.0% |
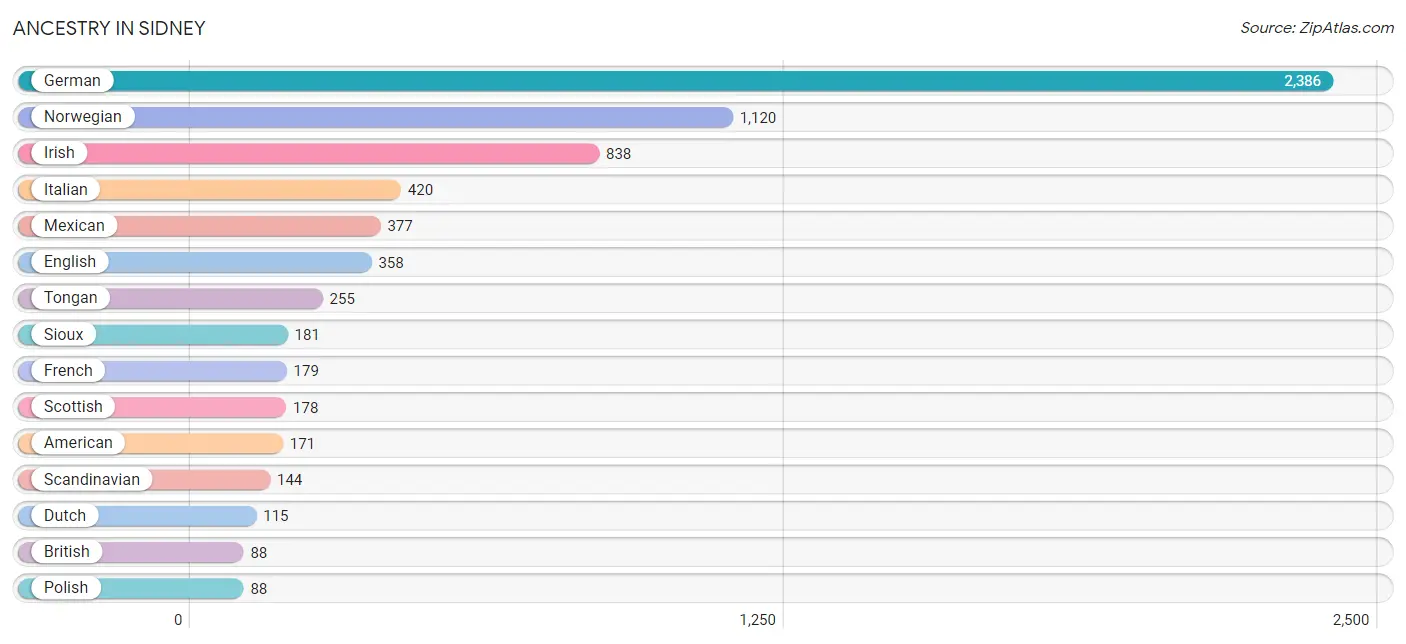
Ancestry in Sidney
The most populous ancestries reported in Sidney are German (2,386 | 38.1%), Norwegian (1,120 | 17.9%), Irish (838 | 13.4%), Italian (420 | 6.7%), and Mexican (377 | 6.0%), together accounting for 82.2% of all Sidney residents.
| Ancestry | # Population | % Population |
| American | 171 | 2.7% |
| Australian | 3 | 0.1% |
| Blackfeet | 16 | 0.3% |
| British | 88 | 1.4% |
| Chippewa | 2 | 0.0% |
| Colombian | 64 | 1.0% |
| Czech | 30 | 0.5% |
| Danish | 76 | 1.2% |
| Dutch | 115 | 1.8% |
| English | 358 | 5.7% |
| European | 20 | 0.3% |
| Finnish | 9 | 0.1% |
| French | 179 | 2.9% |
| French Canadian | 42 | 0.7% |
| German | 2,386 | 38.1% |
| Greek | 22 | 0.4% |
| Hungarian | 56 | 0.9% |
| Irish | 838 | 13.4% |
| Italian | 420 | 6.7% |
| Lithuanian | 4 | 0.1% |
| Mexican | 377 | 6.0% |
| Native Hawaiian | 16 | 0.3% |
| Norwegian | 1,120 | 17.9% |
| Pakistani | 34 | 0.5% |
| Pennsylvania German | 54 | 0.9% |
| Polish | 88 | 1.4% |
| Romanian | 40 | 0.6% |
| Russian | 57 | 0.9% |
| Scandinavian | 144 | 2.3% |
| Scotch-Irish | 3 | 0.1% |
| Scottish | 178 | 2.8% |
| Sioux | 181 | 2.9% |
| South American | 64 | 1.0% |
| Swedish | 32 | 0.5% |
| Tongan | 255 | 4.1% |
| Welsh | 26 | 0.4% | View All 36 Rows |
Immigrants in Sidney
The most numerous immigrant groups reported in Sidney came from Latin America (200 | 3.2%), Central America (160 | 2.6%), Mexico (146 | 2.3%), Colombia (40 | 0.6%), and South America (40 | 0.6%), together accounting for 9.4% of all Sidney residents.
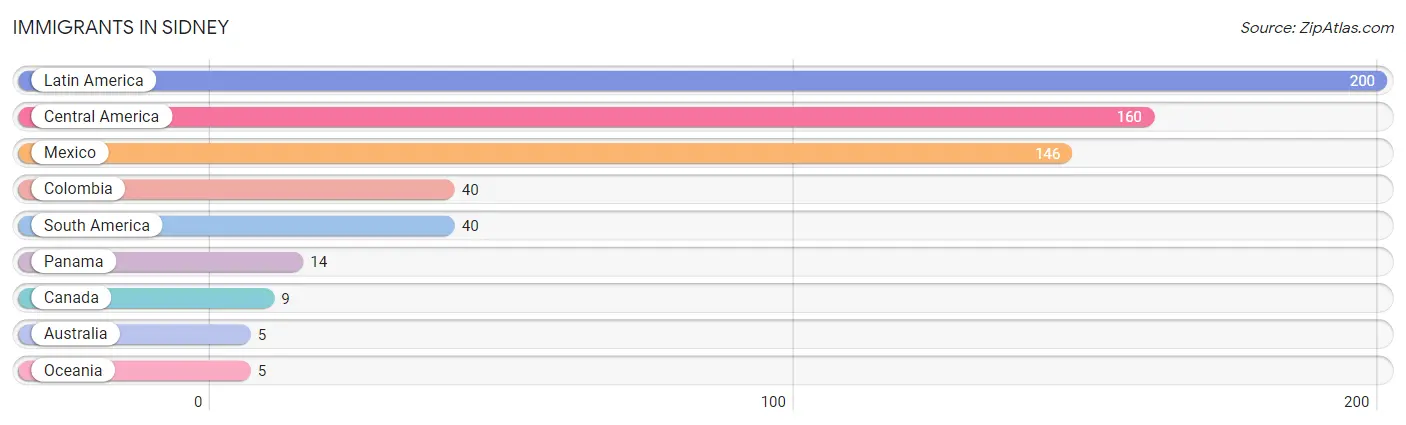
| Immigration Origin | # Population | % Population |
| Australia | 5 | 0.1% |
| Canada | 9 | 0.1% |
| Central America | 160 | 2.6% |
| Colombia | 40 | 0.6% |
| Latin America | 200 | 3.2% |
| Mexico | 146 | 2.3% |
| Oceania | 5 | 0.1% |
| Panama | 14 | 0.2% |
| South America | 40 | 0.6% | View All 9 Rows |
Sex and Age in Sidney
Sex and Age in Sidney
The most populous age groups in Sidney are 40 to 44 Years (310 | 10.3%) for men and 15 to 19 Years (347 | 10.7%) for women.
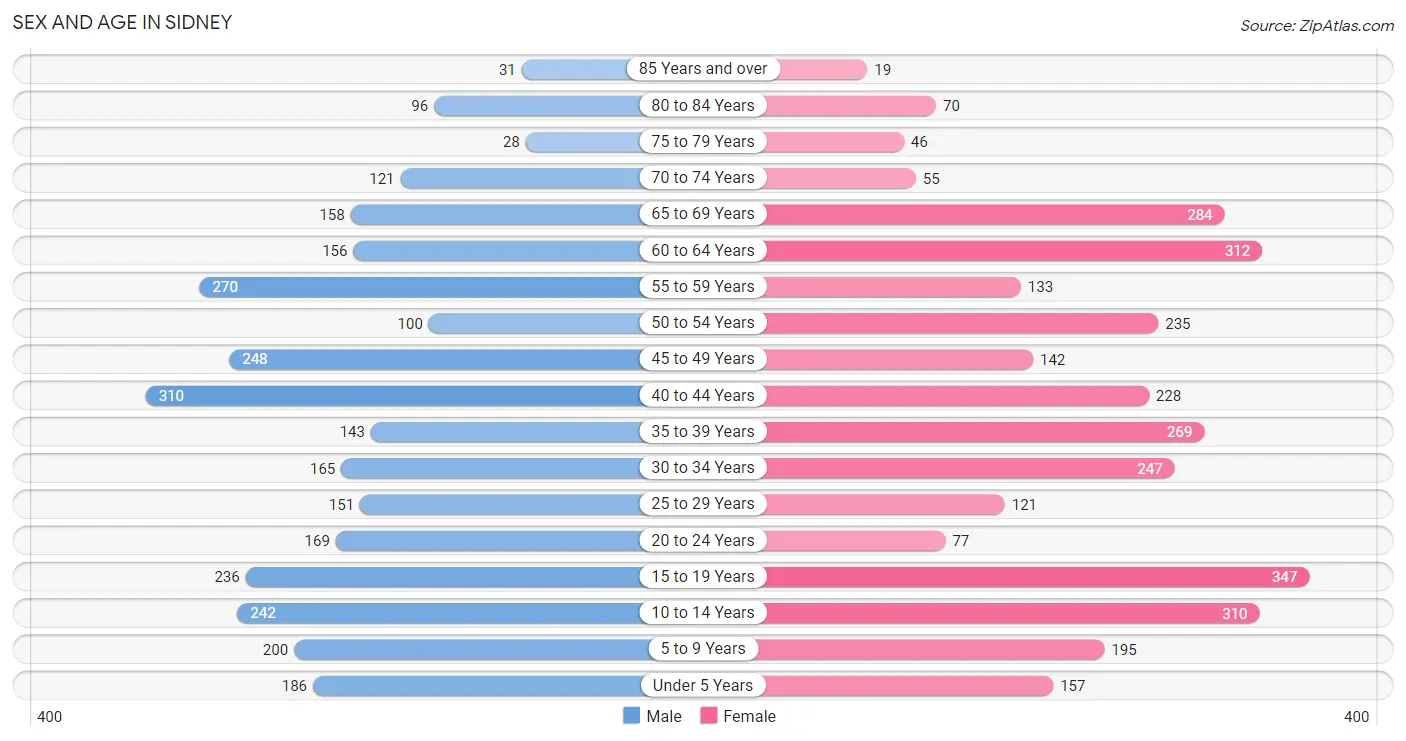
| Age Bracket | Male | Female |
| Under 5 Years | 186 (6.2%) | 157 (4.8%) |
| 5 to 9 Years | 200 (6.6%) | 195 (6.0%) |
| 10 to 14 Years | 242 (8.0%) | 310 (9.6%) |
| 15 to 19 Years | 236 (7.8%) | 347 (10.7%) |
| 20 to 24 Years | 169 (5.6%) | 77 (2.4%) |
| 25 to 29 Years | 151 (5.0%) | 121 (3.7%) |
| 30 to 34 Years | 165 (5.5%) | 247 (7.6%) |
| 35 to 39 Years | 143 (4.8%) | 269 (8.3%) |
| 40 to 44 Years | 310 (10.3%) | 228 (7.0%) |
| 45 to 49 Years | 248 (8.2%) | 142 (4.4%) |
| 50 to 54 Years | 100 (3.3%) | 235 (7.2%) |
| 55 to 59 Years | 270 (9.0%) | 133 (4.1%) |
| 60 to 64 Years | 156 (5.2%) | 312 (9.6%) |
| 65 to 69 Years | 158 (5.2%) | 284 (8.7%) |
| 70 to 74 Years | 121 (4.0%) | 55 (1.7%) |
| 75 to 79 Years | 28 (0.9%) | 46 (1.4%) |
| 80 to 84 Years | 96 (3.2%) | 70 (2.2%) |
| 85 Years and over | 31 (1.0%) | 19 (0.6%) |
| Total | 3,010 (100.0%) | 3,247 (100.0%) |
Families and Households in Sidney
Median Family Size in Sidney
The median family size in Sidney is 3.47 persons per family, with single female/mother families (190 | 14.3%) accounting for the largest median family size of 4.66 persons per family. On the other hand, married-couple families (1,076 | 81.0%) represent the smallest median family size with 3.27 persons per family.
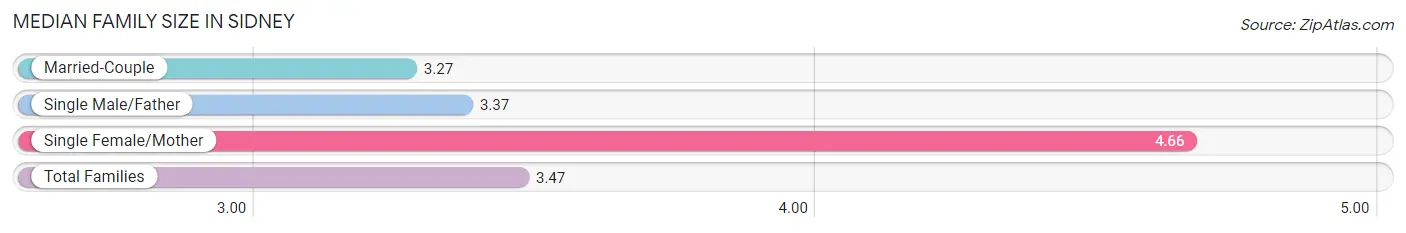
| Family Type | # Families | Family Size |
| Married-Couple | 1,076 (81.0%) | 3.27 |
| Single Male/Father | 63 (4.7%) | 3.37 |
| Single Female/Mother | 190 (14.3%) | 4.66 |
| Total Families | 1,329 (100.0%) | 3.47 |
Median Household Size in Sidney
The median household size in Sidney is 2.47 persons per household, with single female/mother households (190 | 7.5%) accounting for the largest median household size of 4.98 persons per household. non-family households (1,187 | 47.2%) represent the smallest median household size with 1.28 persons per household.
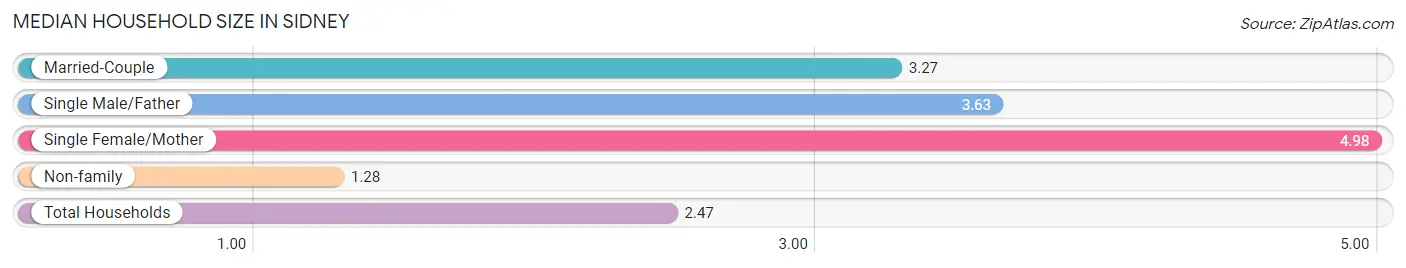
| Household Type | # Households | Household Size |
| Married-Couple | 1,076 (42.8%) | 3.27 |
| Single Male/Father | 63 (2.5%) | 3.63 |
| Single Female/Mother | 190 (7.5%) | 4.98 |
| Non-family | 1,187 (47.2%) | 1.28 |
| Total Households | 2,516 (100.0%) | 2.47 |
Household Size by Marriage Status in Sidney
Out of a total of 2,516 households in Sidney, 1,329 (52.8%) are family households, while 1,187 (47.2%) are nonfamily households. The most numerous type of family households are 2-person households, comprising 724, and the most common type of nonfamily households are 1-person households, comprising 997.
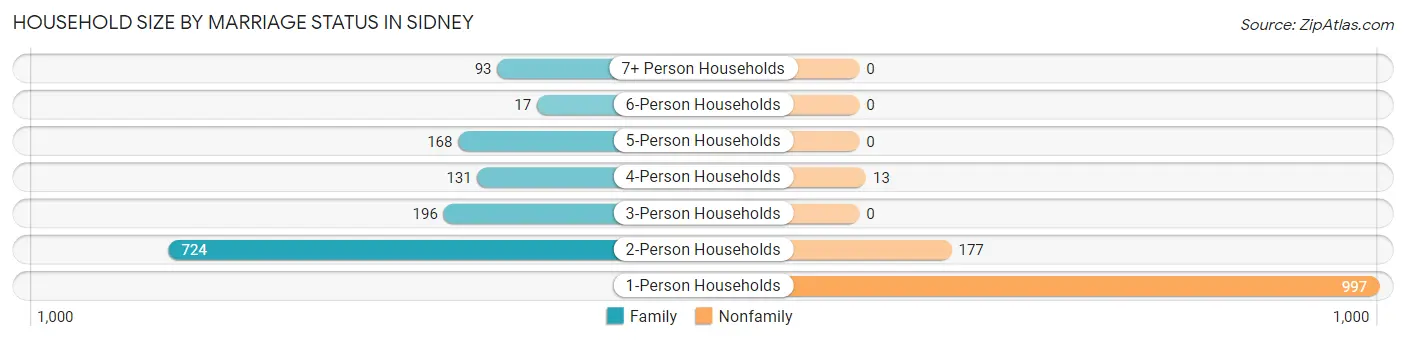
| Household Size | Family Households | Nonfamily Households |
| 1-Person Households | - | 997 (39.6%) |
| 2-Person Households | 724 (28.8%) | 177 (7.0%) |
| 3-Person Households | 196 (7.8%) | 0 (0.0%) |
| 4-Person Households | 131 (5.2%) | 13 (0.5%) |
| 5-Person Households | 168 (6.7%) | 0 (0.0%) |
| 6-Person Households | 17 (0.7%) | 0 (0.0%) |
| 7+ Person Households | 93 (3.7%) | 0 (0.0%) |
| Total | 1,329 (52.8%) | 1,187 (47.2%) |
Female Fertility in Sidney
Fertility by Age in Sidney
Average fertility rate in Sidney is 62.0 births per 1,000 women. Women in the age bracket of 20 to 34 years have the highest fertility rate with 146.0 births per 1,000 women. Women in the age bracket of 20 to 34 years acount for 70.7% of all women with births.
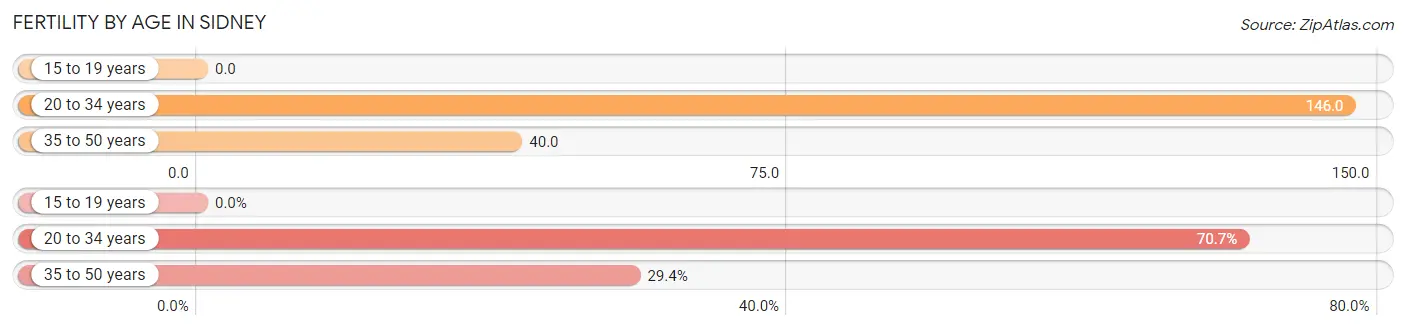
| Age Bracket | Women with Births | Births / 1,000 Women |
| 15 to 19 years | 0 (0.0%) | 0.0 |
| 20 to 34 years | 65 (70.7%) | 146.0 |
| 35 to 50 years | 27 (29.3%) | 40.0 |
| Total | 92 (100.0%) | 62.0 |
Fertility by Age by Marriage Status in Sidney
91.3% of women with births (92) in Sidney are married. The highest percentage of unmarried women with births falls into 35 to 50 years age bracket with 29.6% of them unmarried at the time of birth, while the lowest percentage of unmarried women with births belong to 20 to 34 years age bracket with 0.0% of them unmarried.
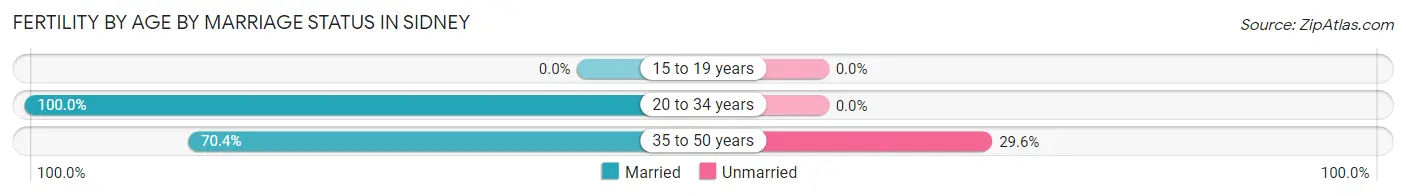
| Age Bracket | Married | Unmarried |
| 15 to 19 years | 0 (0.0%) | 0 (0.0%) |
| 20 to 34 years | 65 (100.0%) | 0 (0.0%) |
| 35 to 50 years | 19 (70.4%) | 8 (29.6%) |
| Total | 84 (91.3%) | 8 (8.7%) |
Fertility by Education in Sidney
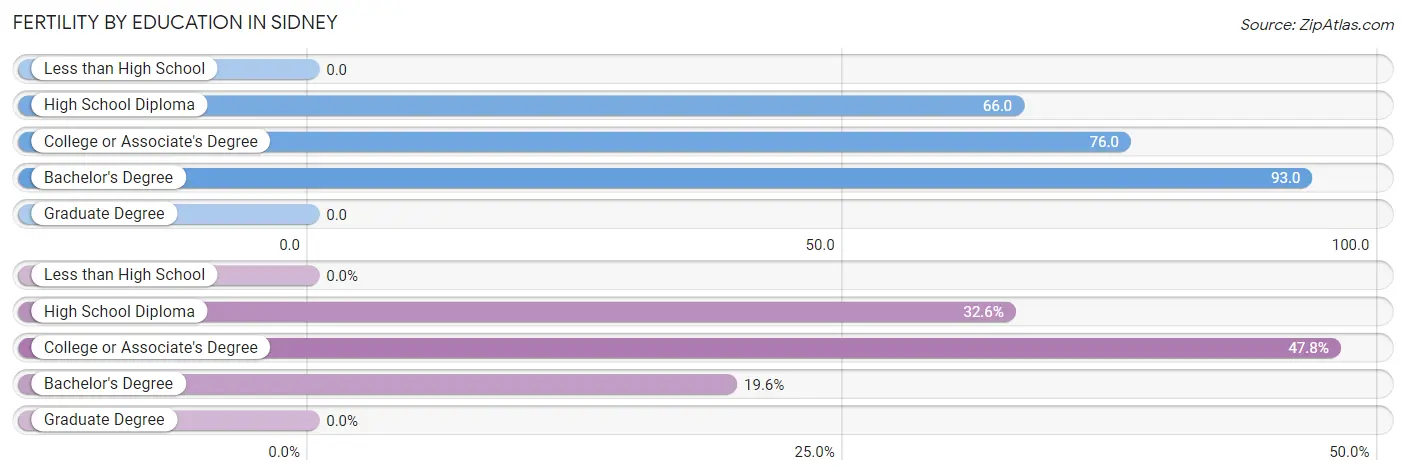
| Educational Attainment | Women with Births | Births / 1,000 Women |
| Less than High School | 0 (0.0%) | 0.0 |
| High School Diploma | 30 (32.6%) | 66.0 |
| College or Associate's Degree | 44 (47.8%) | 76.0 |
| Bachelor's Degree | 18 (19.6%) | 93.0 |
| Graduate Degree | 0 (0.0%) | 0.0 |
| Total | 92 (100.0%) | 62.0 |
Fertility by Education by Marriage Status in Sidney
8.7% of women with births in Sidney are unmarried. Women with the educational attainment of bachelor's degree are most likely to be married with 100.0% of them married at childbirth, while women with the educational attainment of high school diploma are least likely to be married with 20.0% of them unmarried at childbirth.
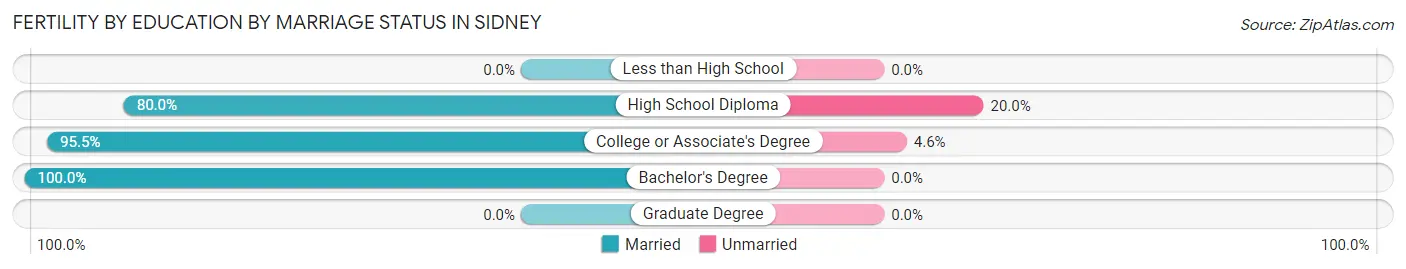
| Educational Attainment | Married | Unmarried |
| Less than High School | 0 (0.0%) | 0 (0.0%) |
| High School Diploma | 24 (80.0%) | 6 (20.0%) |
| College or Associate's Degree | 42 (95.5%) | 2 (4.5%) |
| Bachelor's Degree | 18 (100.0%) | 0 (0.0%) |
| Graduate Degree | 0 (0.0%) | 0 (0.0%) |
| Total | 84 (91.3%) | 8 (8.7%) |
Employment Characteristics in Sidney
Employment by Class of Employer in Sidney
Among the 2,974 employed individuals in Sidney, private company employees (2,202 | 74.0%), local government employees (243 | 8.2%), and not-for-profit organizations (176 | 5.9%) make up the most common classes of employment.
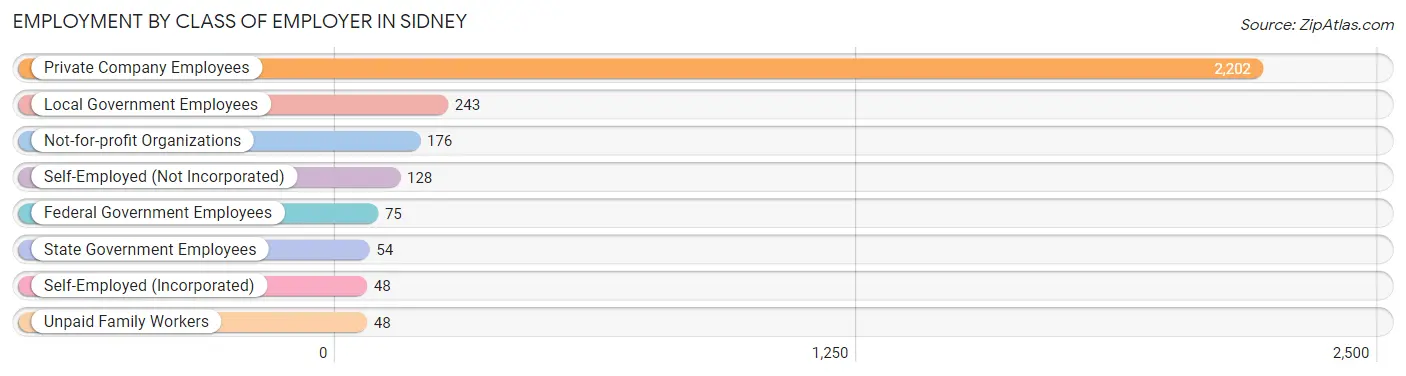
| Employer Class | # Employees | % Employees |
| Private Company Employees | 2,202 | 74.0% |
| Self-Employed (Incorporated) | 48 | 1.6% |
| Self-Employed (Not Incorporated) | 128 | 4.3% |
| Not-for-profit Organizations | 176 | 5.9% |
| Local Government Employees | 243 | 8.2% |
| State Government Employees | 54 | 1.8% |
| Federal Government Employees | 75 | 2.5% |
| Unpaid Family Workers | 48 | 1.6% |
| Total | 2,974 | 100.0% |
Employment Status by Age in Sidney
According to the labor force statistics for Sidney, out of the total population over 16 years of age (4,859), 67.7% or 3,290 individuals are in the labor force, with 5.1% or 168 of them unemployed. The age group with the highest labor force participation rate is 25 to 29 years, with 100.0% or 272 individuals in the labor force. Within the labor force, the 16 to 19 years age range has the highest percentage of unemployed individuals, with 37.2% or 142 of them being unemployed.
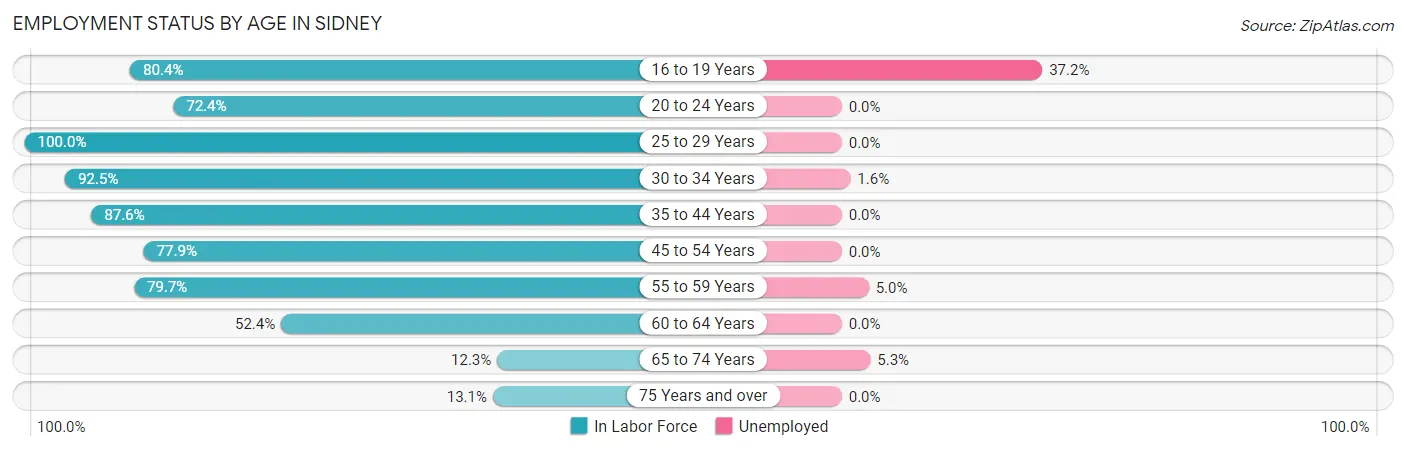
| Age Bracket | In Labor Force | Unemployed |
| 16 to 19 Years | 382 (80.4%) | 142 (37.2%) |
| 20 to 24 Years | 178 (72.4%) | 0 (0.0%) |
| 25 to 29 Years | 272 (100.0%) | 0 (0.0%) |
| 30 to 34 Years | 381 (92.5%) | 6 (1.6%) |
| 35 to 44 Years | 832 (87.6%) | 0 (0.0%) |
| 45 to 54 Years | 565 (77.9%) | 0 (0.0%) |
| 55 to 59 Years | 321 (79.7%) | 16 (5.0%) |
| 60 to 64 Years | 245 (52.4%) | 0 (0.0%) |
| 65 to 74 Years | 76 (12.3%) | 4 (5.3%) |
| 75 Years and over | 38 (13.1%) | 0 (0.0%) |
| Total | 3,290 (67.7%) | 168 (5.1%) |
Employment Status by Educational Attainment in Sidney
According to labor force statistics for Sidney, 81.0% of individuals (2,616) out of the total population between 25 and 64 years of age (3,230) are in the labor force, with 0.8% or 21 of them being unemployed. The group with the highest labor force participation rate are those with the educational attainment of bachelor's degree or higher, with 93.9% or 357 individuals in the labor force. Within the labor force, individuals with bachelor's degree or higher education have the highest percentage of unemployment, with 1.7% or 6 of them being unemployed.
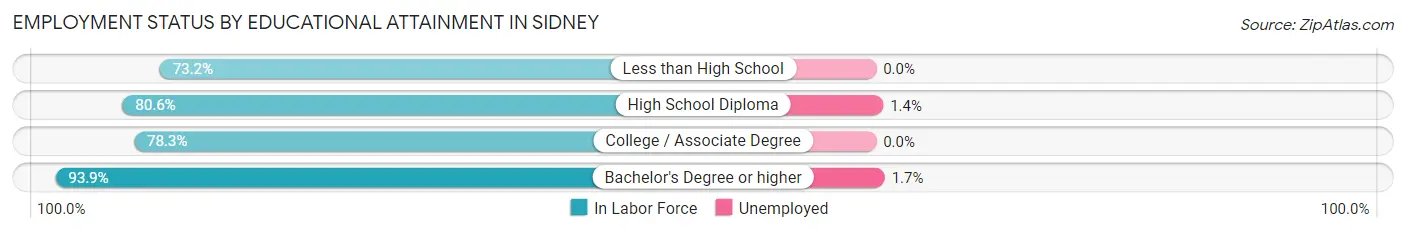
| Educational Attainment | In Labor Force | Unemployed |
| Less than High School | 93 (73.2%) | 0 (0.0%) |
| High School Diploma | 1,153 (80.6%) | 20 (1.4%) |
| College / Associate Degree | 1,012 (78.3%) | 0 (0.0%) |
| Bachelor's Degree or higher | 357 (93.9%) | 6 (1.7%) |
| Total | 2,616 (81.0%) | 26 (0.8%) |
Employment Occupations by Sex in Sidney
Management, Business, Science and Arts Occupations
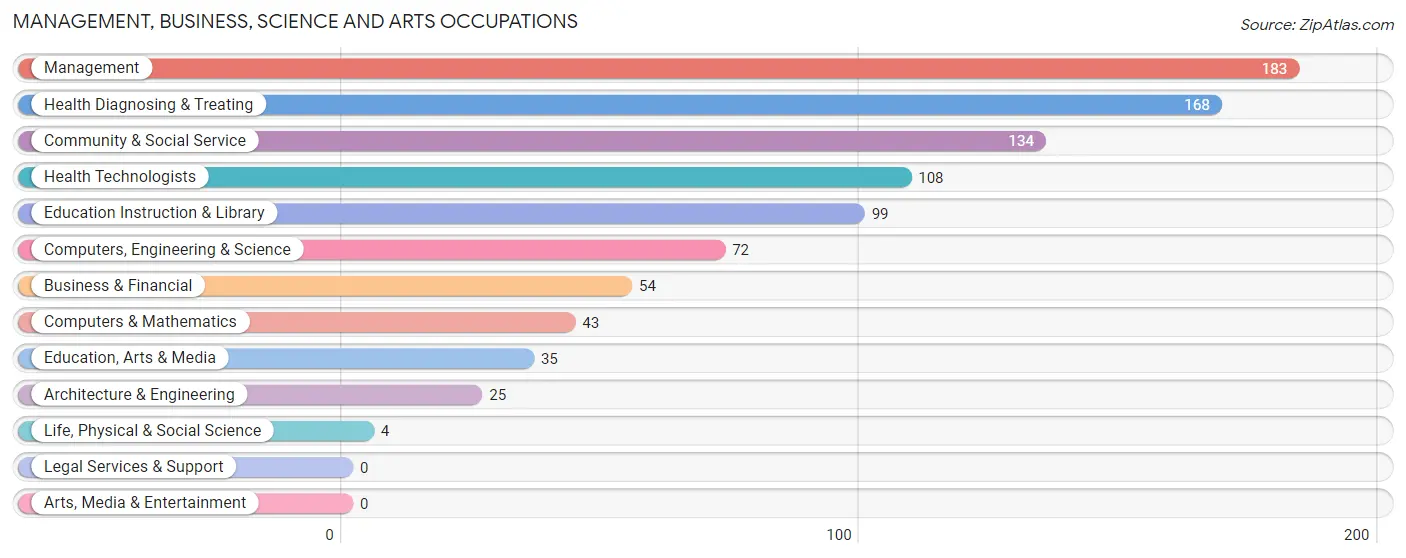
The most common Management, Business, Science and Arts occupations in Sidney are Management (183 | 5.9%), Health Diagnosing & Treating (168 | 5.4%), Community & Social Service (134 | 4.3%), Health Technologists (108 | 3.5%), and Education Instruction & Library (99 | 3.2%).
Management, Business, Science and Arts Occupations by Sex
Within the Management, Business, Science and Arts occupations in Sidney, the most male-oriented occupations are Architecture & Engineering (100.0%), Computers, Engineering & Science (84.7%), and Computers & Mathematics (83.7%), while the most female-oriented occupations are Life, Physical & Social Science (100.0%), Health Diagnosing & Treating (94.1%), and Health Technologists (90.7%).
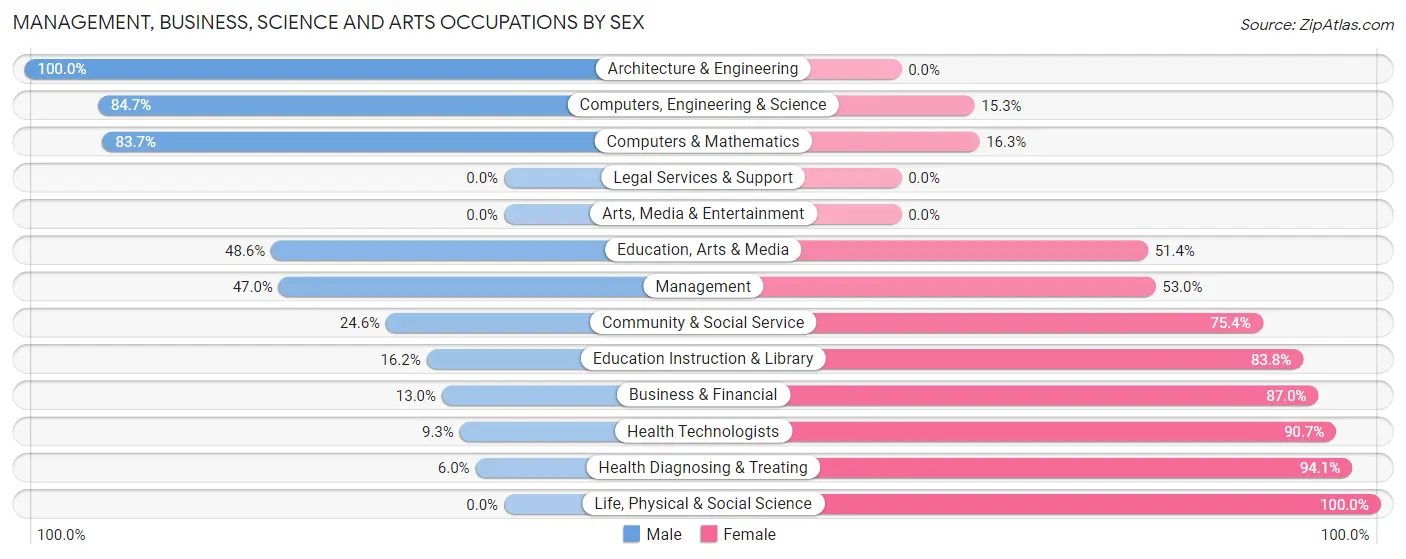
| Occupation | Male | Female |
| Management | 86 (47.0%) | 97 (53.0%) |
| Business & Financial | 7 (13.0%) | 47 (87.0%) |
| Computers, Engineering & Science | 61 (84.7%) | 11 (15.3%) |
| Computers & Mathematics | 36 (83.7%) | 7 (16.3%) |
| Architecture & Engineering | 25 (100.0%) | 0 (0.0%) |
| Life, Physical & Social Science | 0 (0.0%) | 4 (100.0%) |
| Community & Social Service | 33 (24.6%) | 101 (75.4%) |
| Education, Arts & Media | 17 (48.6%) | 18 (51.4%) |
| Legal Services & Support | 0 (0.0%) | 0 (0.0%) |
| Education Instruction & Library | 16 (16.2%) | 83 (83.8%) |
| Arts, Media & Entertainment | 0 (0.0%) | 0 (0.0%) |
| Health Diagnosing & Treating | 10 (5.9%) | 158 (94.1%) |
| Health Technologists | 10 (9.3%) | 98 (90.7%) |
| Total (Category) | 197 (32.2%) | 414 (67.8%) |
| Total (Overall) | 1,667 (53.4%) | 1,455 (46.6%) |
Services Occupations
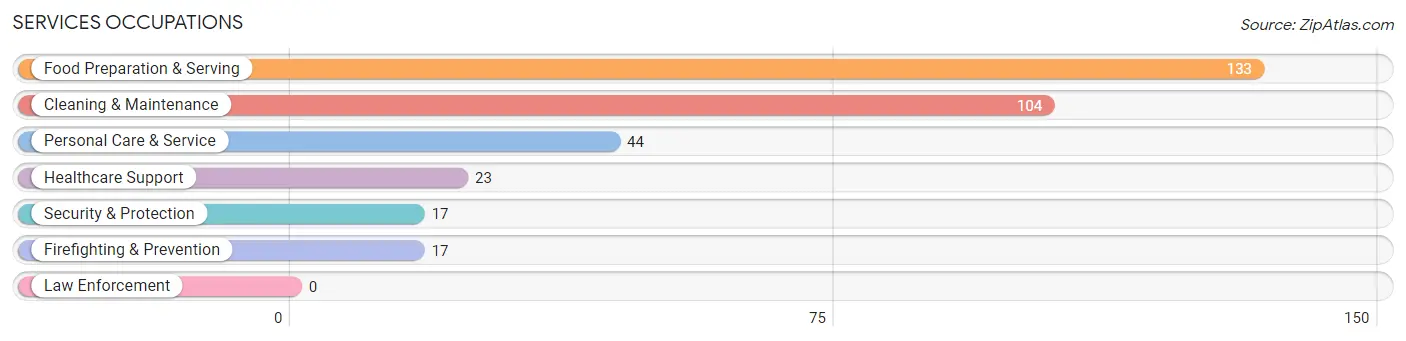
The most common Services occupations in Sidney are Food Preparation & Serving (133 | 4.3%), Cleaning & Maintenance (104 | 3.3%), Personal Care & Service (44 | 1.4%), Healthcare Support (23 | 0.7%), and Security & Protection (17 | 0.5%).
Services Occupations by Sex
Within the Services occupations in Sidney, the most male-oriented occupations are Cleaning & Maintenance (58.7%), and Food Preparation & Serving (30.1%), while the most female-oriented occupations are Healthcare Support (100.0%), Security & Protection (100.0%), and Firefighting & Prevention (100.0%).
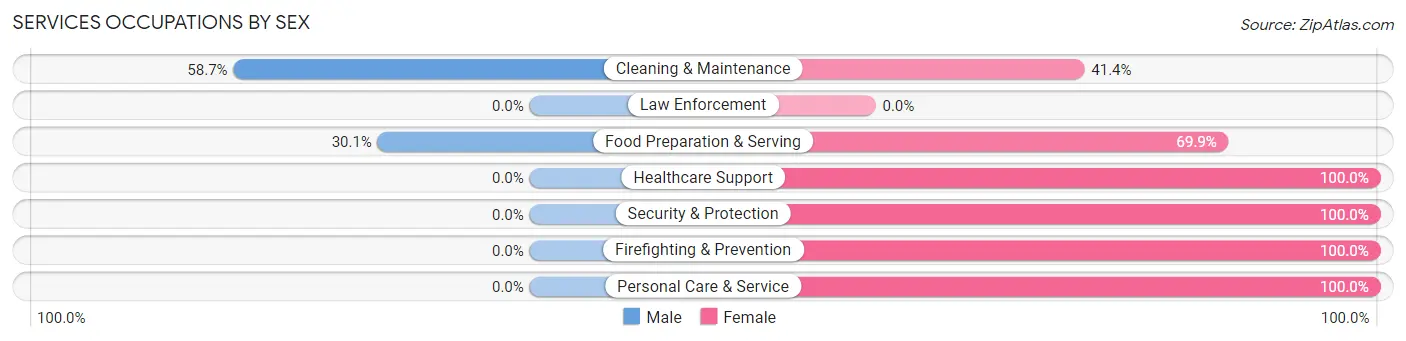
| Occupation | Male | Female |
| Healthcare Support | 0 (0.0%) | 23 (100.0%) |
| Security & Protection | 0 (0.0%) | 17 (100.0%) |
| Firefighting & Prevention | 0 (0.0%) | 17 (100.0%) |
| Law Enforcement | 0 (0.0%) | 0 (0.0%) |
| Food Preparation & Serving | 40 (30.1%) | 93 (69.9%) |
| Cleaning & Maintenance | 61 (58.7%) | 43 (41.3%) |
| Personal Care & Service | 0 (0.0%) | 44 (100.0%) |
| Total (Category) | 101 (31.5%) | 220 (68.5%) |
| Total (Overall) | 1,667 (53.4%) | 1,455 (46.6%) |
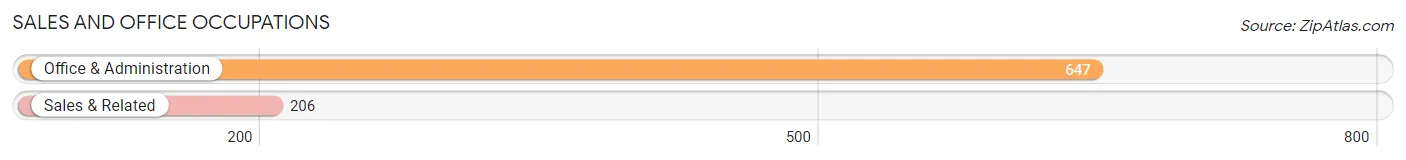
Sales and Office Occupations
The most common Sales and Office occupations in Sidney are Office & Administration (647 | 20.7%), and Sales & Related (206 | 6.6%).
Sales and Office Occupations by Sex
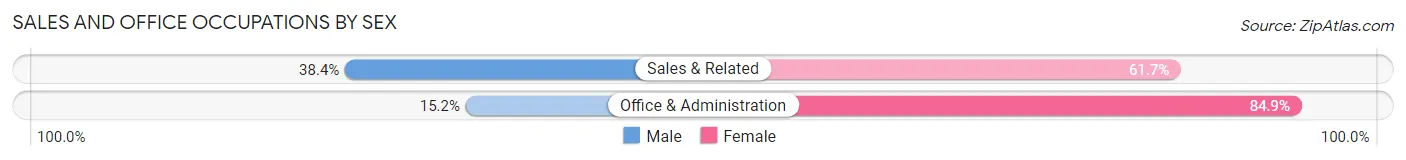
| Occupation | Male | Female |
| Sales & Related | 79 (38.4%) | 127 (61.7%) |
| Office & Administration | 98 (15.1%) | 549 (84.9%) |
| Total (Category) | 177 (20.7%) | 676 (79.2%) |
| Total (Overall) | 1,667 (53.4%) | 1,455 (46.6%) |
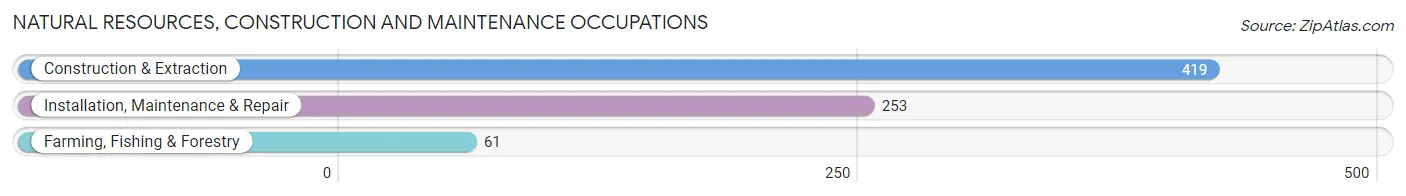
Natural Resources, Construction and Maintenance Occupations
The most common Natural Resources, Construction and Maintenance occupations in Sidney are Construction & Extraction (419 | 13.4%), Installation, Maintenance & Repair (253 | 8.1%), and Farming, Fishing & Forestry (61 | 1.9%).
Natural Resources, Construction and Maintenance Occupations by Sex
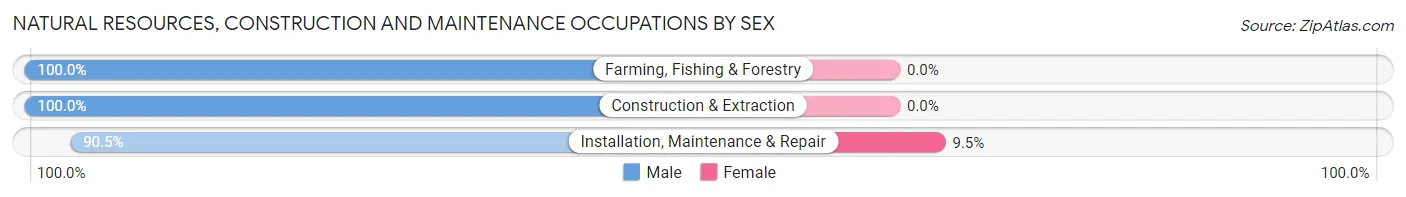
| Occupation | Male | Female |
| Farming, Fishing & Forestry | 61 (100.0%) | 0 (0.0%) |
| Construction & Extraction | 419 (100.0%) | 0 (0.0%) |
| Installation, Maintenance & Repair | 229 (90.5%) | 24 (9.5%) |
| Total (Category) | 709 (96.7%) | 24 (3.3%) |
| Total (Overall) | 1,667 (53.4%) | 1,455 (46.6%) |
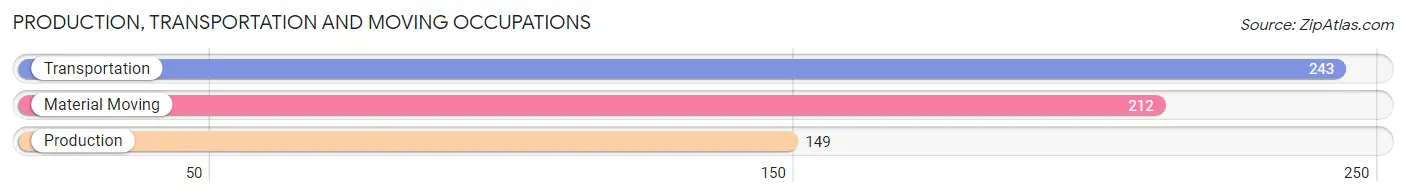
Production, Transportation and Moving Occupations
The most common Production, Transportation and Moving occupations in Sidney are Transportation (243 | 7.8%), Material Moving (212 | 6.8%), and Production (149 | 4.8%).
Production, Transportation and Moving Occupations by Sex
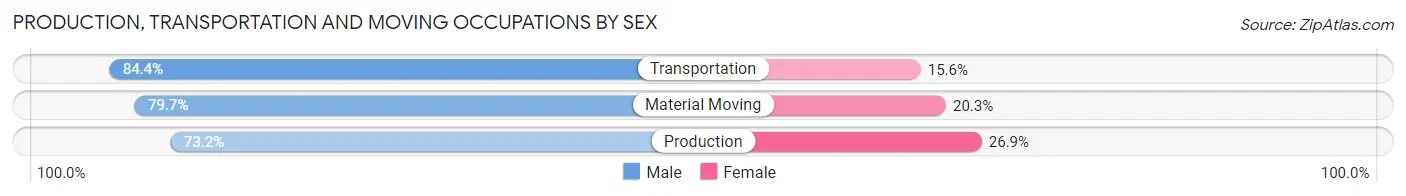
| Occupation | Male | Female |
| Production | 109 (73.2%) | 40 (26.9%) |
| Transportation | 205 (84.4%) | 38 (15.6%) |
| Material Moving | 169 (79.7%) | 43 (20.3%) |
| Total (Category) | 483 (80.0%) | 121 (20.0%) |
| Total (Overall) | 1,667 (53.4%) | 1,455 (46.6%) |
Employment Industries by Sex in Sidney
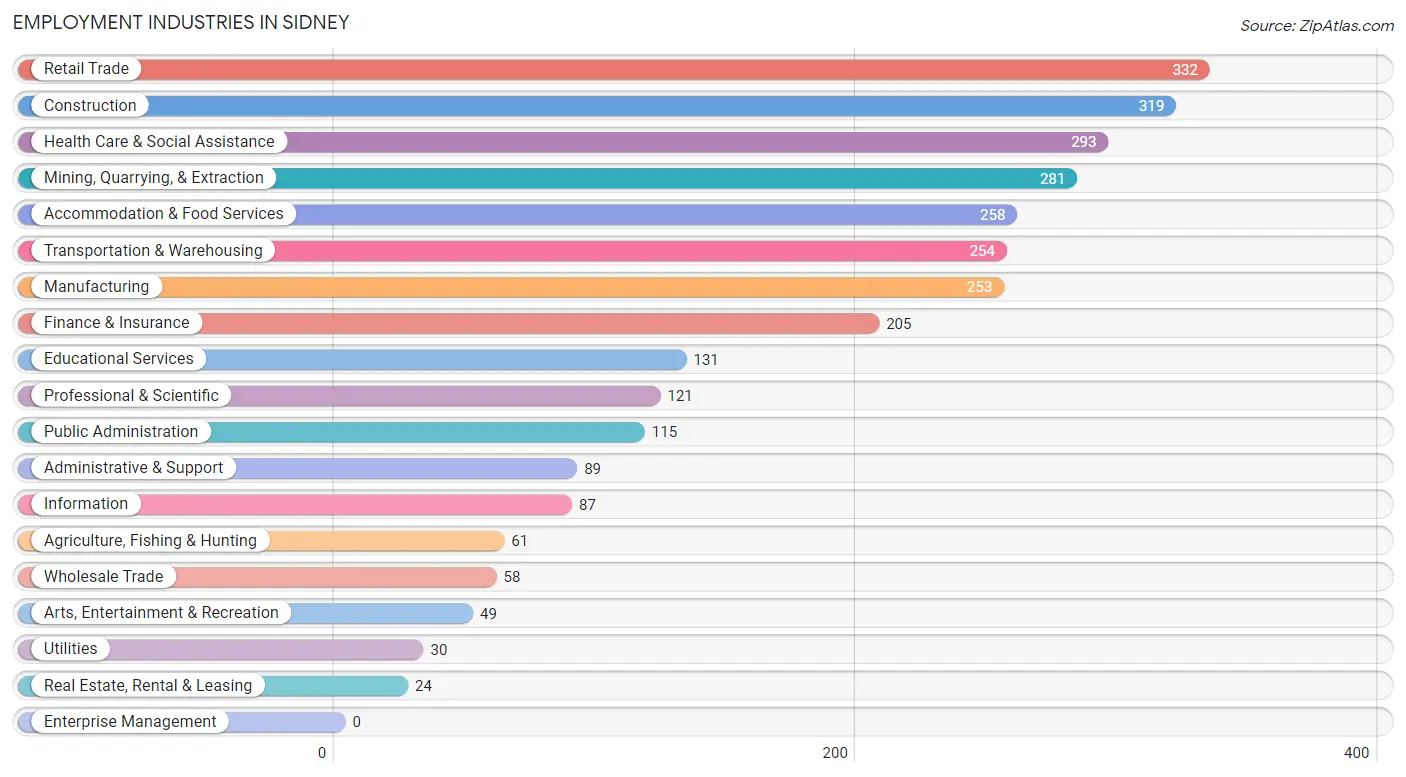
Employment Industries in Sidney
The major employment industries in Sidney include Retail Trade (332 | 10.6%), Construction (319 | 10.2%), Health Care & Social Assistance (293 | 9.4%), Mining, Quarrying, & Extraction (281 | 9.0%), and Accommodation & Food Services (258 | 8.3%).
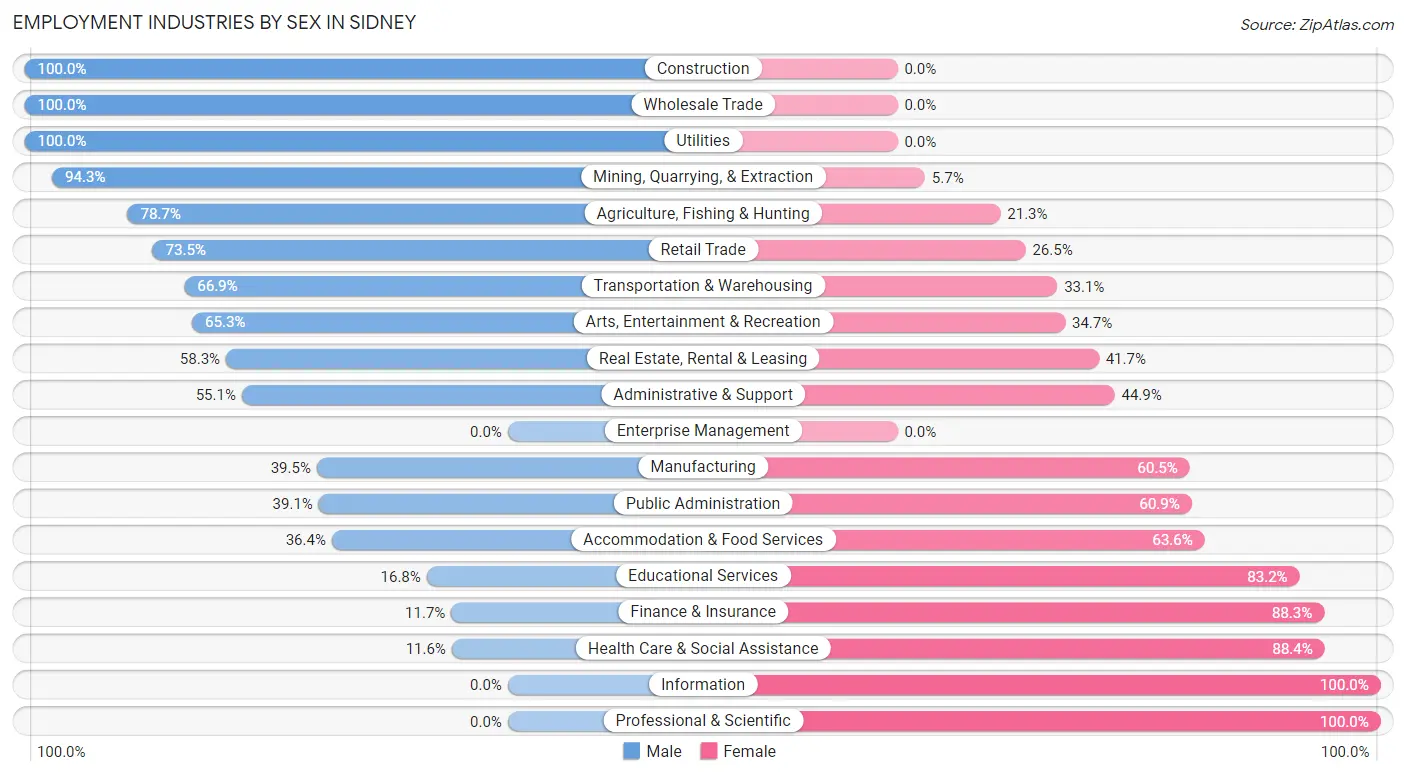
Employment Industries by Sex in Sidney
The Sidney industries that see more men than women are Construction (100.0%), Wholesale Trade (100.0%), and Utilities (100.0%), whereas the industries that tend to have a higher number of women are Information (100.0%), Professional & Scientific (100.0%), and Health Care & Social Assistance (88.4%).
| Industry | Male | Female |
| Agriculture, Fishing & Hunting | 48 (78.7%) | 13 (21.3%) |
| Mining, Quarrying, & Extraction | 265 (94.3%) | 16 (5.7%) |
| Construction | 319 (100.0%) | 0 (0.0%) |
| Manufacturing | 100 (39.5%) | 153 (60.5%) |
| Wholesale Trade | 58 (100.0%) | 0 (0.0%) |
| Retail Trade | 244 (73.5%) | 88 (26.5%) |
| Transportation & Warehousing | 170 (66.9%) | 84 (33.1%) |
| Utilities | 30 (100.0%) | 0 (0.0%) |
| Information | 0 (0.0%) | 87 (100.0%) |
| Finance & Insurance | 24 (11.7%) | 181 (88.3%) |
| Real Estate, Rental & Leasing | 14 (58.3%) | 10 (41.7%) |
| Professional & Scientific | 0 (0.0%) | 121 (100.0%) |
| Enterprise Management | 0 (0.0%) | 0 (0.0%) |
| Administrative & Support | 49 (55.1%) | 40 (44.9%) |
| Educational Services | 22 (16.8%) | 109 (83.2%) |
| Health Care & Social Assistance | 34 (11.6%) | 259 (88.4%) |
| Arts, Entertainment & Recreation | 32 (65.3%) | 17 (34.7%) |
| Accommodation & Food Services | 94 (36.4%) | 164 (63.6%) |
| Public Administration | 45 (39.1%) | 70 (60.9%) |
| Total | 1,667 (53.4%) | 1,455 (46.6%) |
Education in Sidney
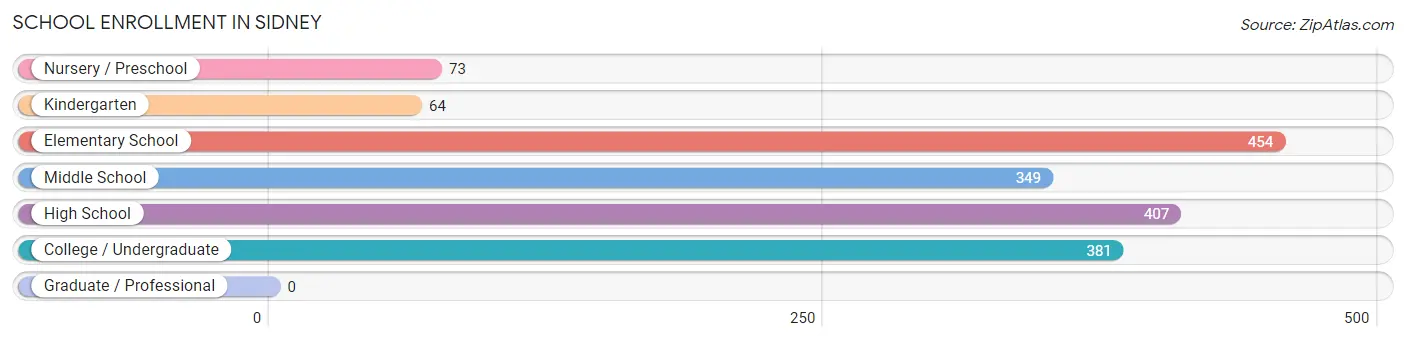
School Enrollment in Sidney
The most common levels of schooling among the 1,728 students in Sidney are elementary school (454 | 26.3%), high school (407 | 23.5%), and college / undergraduate (381 | 22.1%).
| School Level | # Students | % Students |
| Nursery / Preschool | 73 | 4.2% |
| Kindergarten | 64 | 3.7% |
| Elementary School | 454 | 26.3% |
| Middle School | 349 | 20.2% |
| High School | 407 | 23.5% |
| College / Undergraduate | 381 | 22.1% |
| Graduate / Professional | 0 | 0.0% |
| Total | 1,728 | 100.0% |
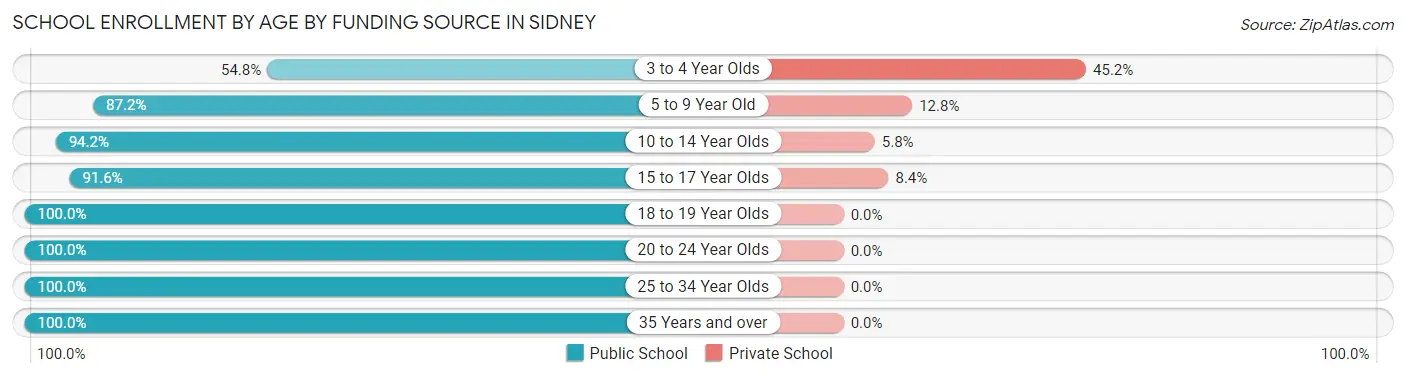
School Enrollment by Age by Funding Source in Sidney
Out of a total of 1,728 students who are enrolled in schools in Sidney, 119 (6.9%) attend a private institution, while the remaining 1,609 (93.1%) are enrolled in public schools. The age group of 3 to 4 year olds has the highest likelihood of being enrolled in private schools, with 14 (45.2% in the age bracket) enrolled. Conversely, the age group of 18 to 19 year olds has the lowest likelihood of being enrolled in a private school, with 228 (100.0% in the age bracket) attending a public institution.
| Age Bracket | Public School | Private School |
| 3 to 4 Year Olds | 17 (54.8%) | 14 (45.2%) |
| 5 to 9 Year Old | 321 (87.2%) | 47 (12.8%) |
| 10 to 14 Year Olds | 520 (94.2%) | 32 (5.8%) |
| 15 to 17 Year Olds | 296 (91.6%) | 27 (8.4%) |
| 18 to 19 Year Olds | 228 (100.0%) | 0 (0.0%) |
| 20 to 24 Year Olds | 76 (100.0%) | 0 (0.0%) |
| 25 to 34 Year Olds | 19 (100.0%) | 0 (0.0%) |
| 35 Years and over | 131 (100.0%) | 0 (0.0%) |
| Total | 1,609 (93.1%) | 119 (6.9%) |
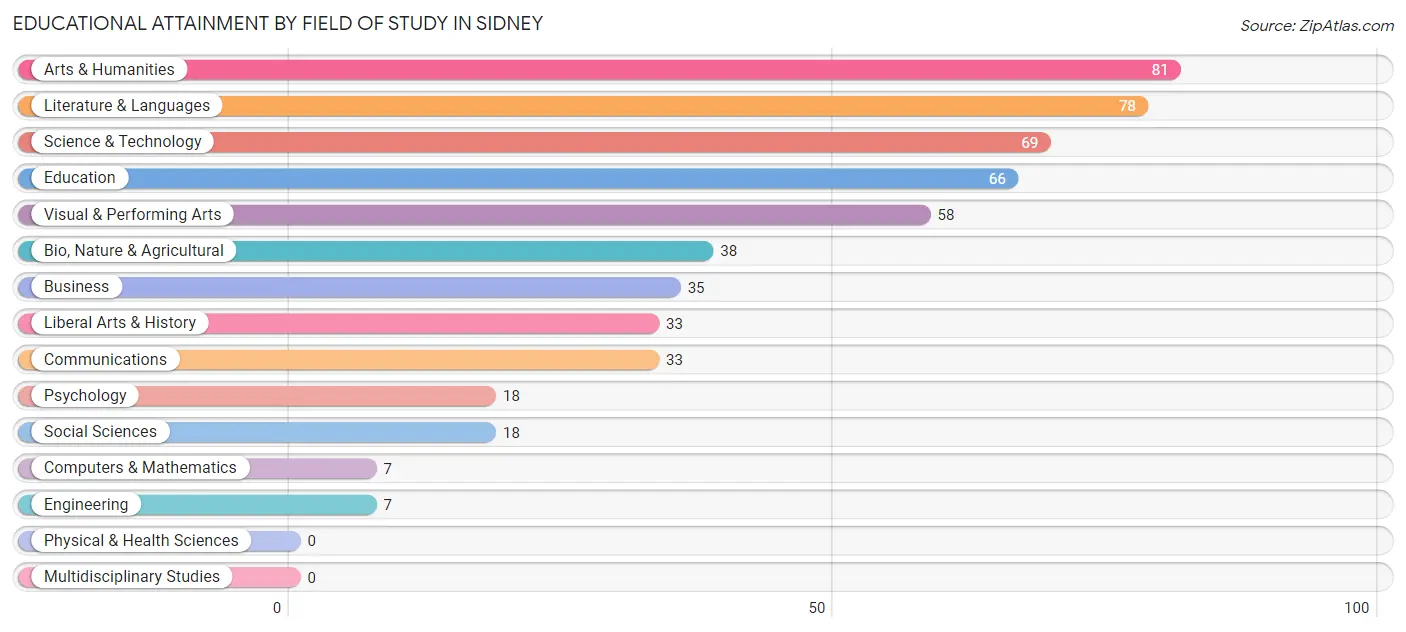
Educational Attainment by Field of Study in Sidney
Arts & humanities (81 | 15.0%), literature & languages (78 | 14.4%), science & technology (69 | 12.8%), education (66 | 12.2%), and visual & performing arts (58 | 10.7%) are the most common fields of study among 541 individuals in Sidney who have obtained a bachelor's degree or higher.
| Field of Study | # Graduates | % Graduates |
| Computers & Mathematics | 7 | 1.3% |
| Bio, Nature & Agricultural | 38 | 7.0% |
| Physical & Health Sciences | 0 | 0.0% |
| Psychology | 18 | 3.3% |
| Social Sciences | 18 | 3.3% |
| Engineering | 7 | 1.3% |
| Multidisciplinary Studies | 0 | 0.0% |
| Science & Technology | 69 | 12.8% |
| Business | 35 | 6.5% |
| Education | 66 | 12.2% |
| Literature & Languages | 78 | 14.4% |
| Liberal Arts & History | 33 | 6.1% |
| Visual & Performing Arts | 58 | 10.7% |
| Communications | 33 | 6.1% |
| Arts & Humanities | 81 | 15.0% |
| Total | 541 | 100.0% |
Transportation & Commute in Sidney
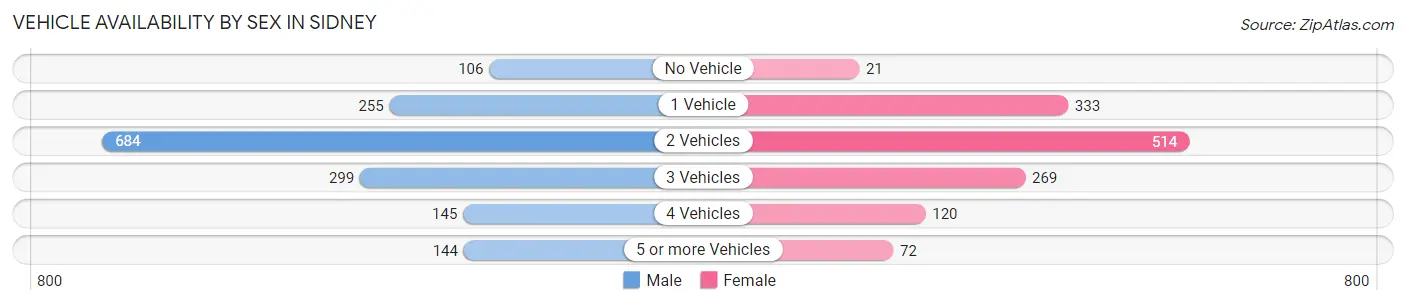
Vehicle Availability by Sex in Sidney
The most prevalent vehicle ownership categories in Sidney are males with 2 vehicles (684, accounting for 41.9%) and females with 2 vehicles (514, making up 51.5%).
| Vehicles Available | Male | Female |
| No Vehicle | 106 (6.5%) | 21 (1.6%) |
| 1 Vehicle | 255 (15.6%) | 333 (25.1%) |
| 2 Vehicles | 684 (41.9%) | 514 (38.7%) |
| 3 Vehicles | 299 (18.3%) | 269 (20.2%) |
| 4 Vehicles | 145 (8.9%) | 120 (9.0%) |
| 5 or more Vehicles | 144 (8.8%) | 72 (5.4%) |
| Total | 1,633 (100.0%) | 1,329 (100.0%) |
Commute Time in Sidney
The most frequently occuring commute durations in Sidney are 5 to 9 minutes (1,121 commuters, 38.3%), 10 to 14 minutes (391 commuters, 13.3%), and 15 to 19 minutes (293 commuters, 10.0%).
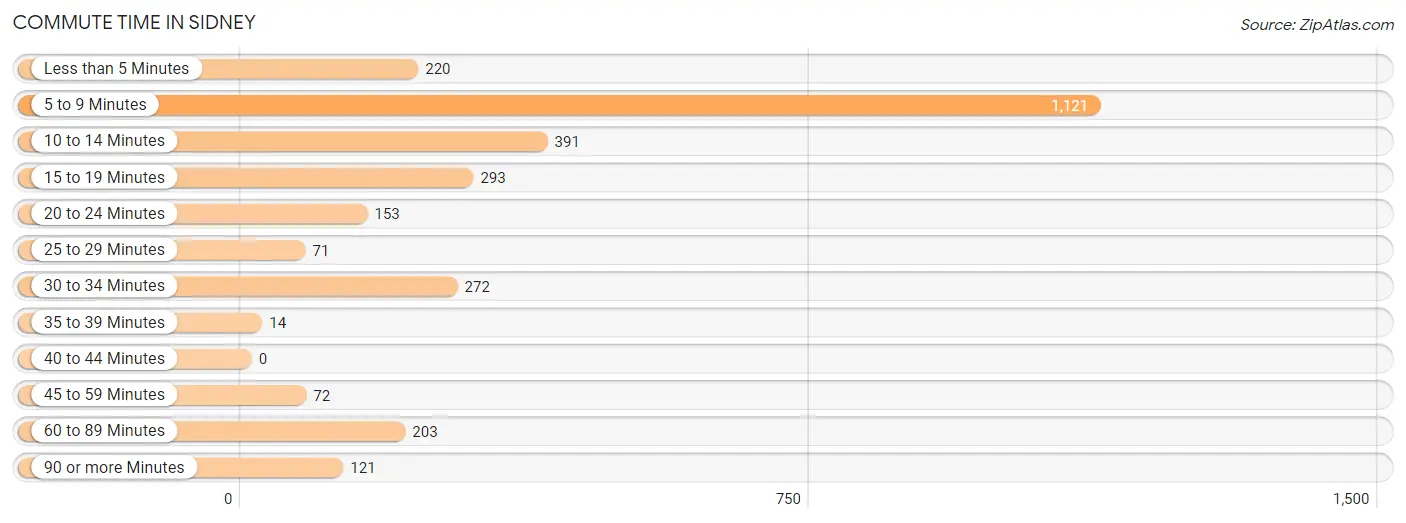
| Commute Time | # Commuters | % Commuters |
| Less than 5 Minutes | 220 | 7.5% |
| 5 to 9 Minutes | 1,121 | 38.3% |
| 10 to 14 Minutes | 391 | 13.3% |
| 15 to 19 Minutes | 293 | 10.0% |
| 20 to 24 Minutes | 153 | 5.2% |
| 25 to 29 Minutes | 71 | 2.4% |
| 30 to 34 Minutes | 272 | 9.3% |
| 35 to 39 Minutes | 14 | 0.5% |
| 40 to 44 Minutes | 0 | 0.0% |
| 45 to 59 Minutes | 72 | 2.5% |
| 60 to 89 Minutes | 203 | 6.9% |
| 90 or more Minutes | 121 | 4.1% |
Commute Time by Sex in Sidney
The most common commute times in Sidney are 5 to 9 minutes (398 commuters, 24.3%) for males and 5 to 9 minutes (723 commuters, 55.8%) for females.
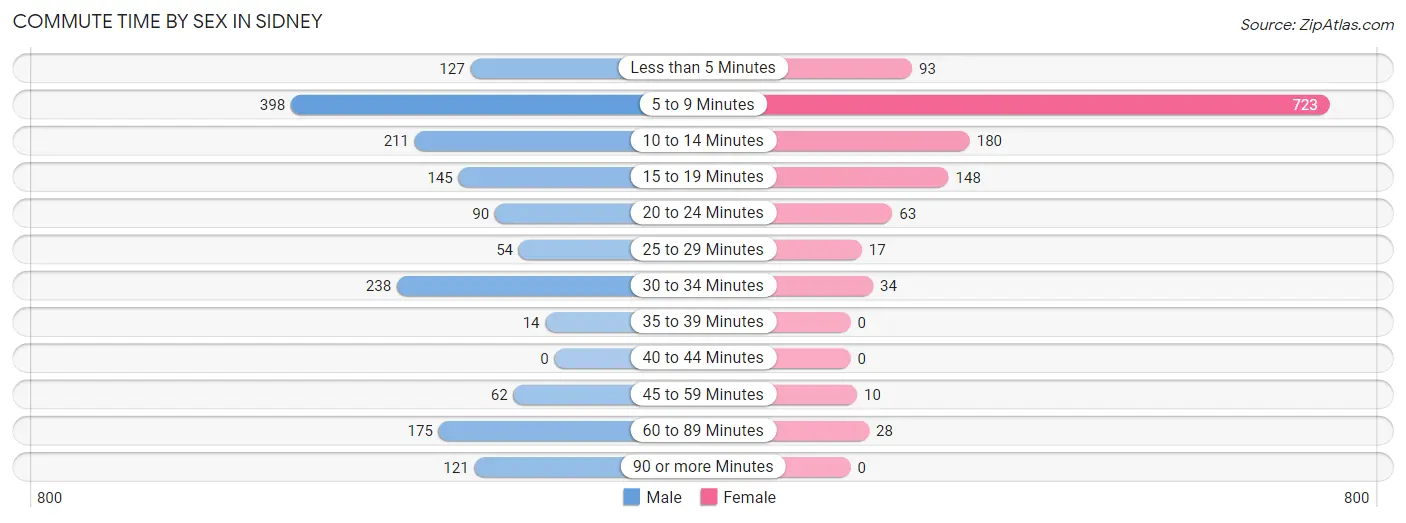
| Commute Time | Male | Female |
| Less than 5 Minutes | 127 (7.8%) | 93 (7.2%) |
| 5 to 9 Minutes | 398 (24.3%) | 723 (55.8%) |
| 10 to 14 Minutes | 211 (12.9%) | 180 (13.9%) |
| 15 to 19 Minutes | 145 (8.9%) | 148 (11.4%) |
| 20 to 24 Minutes | 90 (5.5%) | 63 (4.9%) |
| 25 to 29 Minutes | 54 (3.3%) | 17 (1.3%) |
| 30 to 34 Minutes | 238 (14.6%) | 34 (2.6%) |
| 35 to 39 Minutes | 14 (0.9%) | 0 (0.0%) |
| 40 to 44 Minutes | 0 (0.0%) | 0 (0.0%) |
| 45 to 59 Minutes | 62 (3.8%) | 10 (0.8%) |
| 60 to 89 Minutes | 175 (10.7%) | 28 (2.2%) |
| 90 or more Minutes | 121 (7.4%) | 0 (0.0%) |
Time of Departure to Work by Sex in Sidney
The most frequent times of departure to work in Sidney are 6:00 AM to 6:29 AM (265, 16.2%) for males and 7:30 AM to 7:59 AM (381, 29.4%) for females.
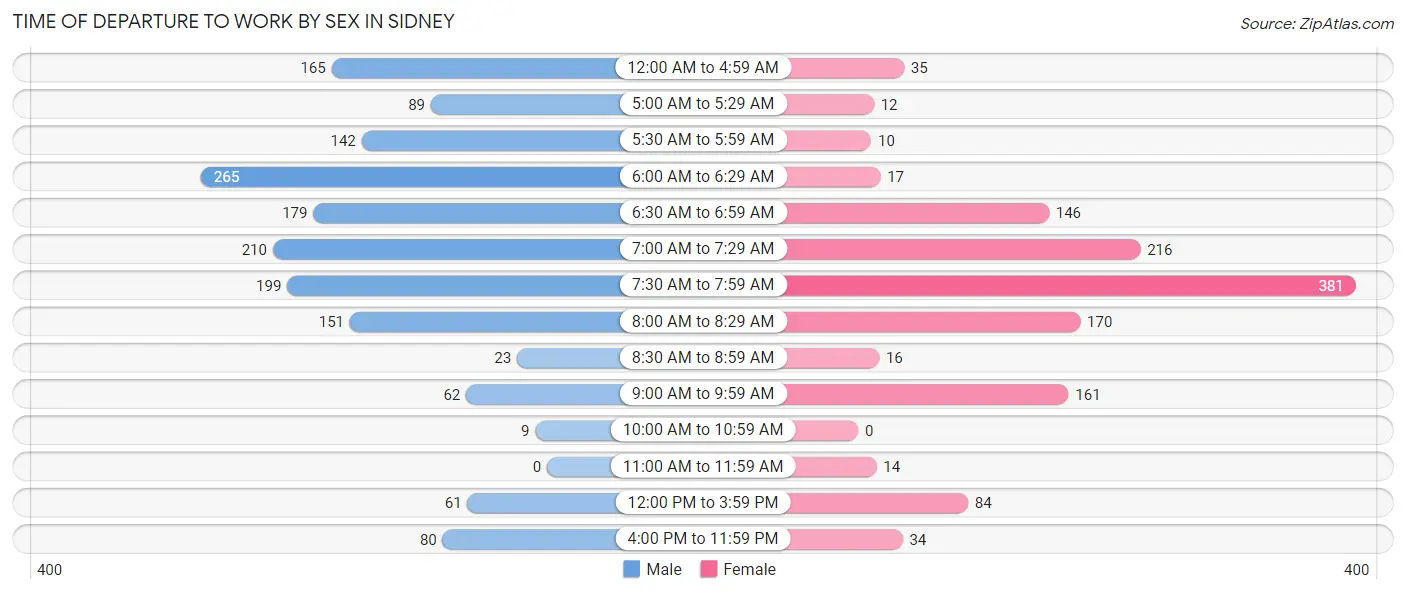
| Time of Departure | Male | Female |
| 12:00 AM to 4:59 AM | 165 (10.1%) | 35 (2.7%) |
| 5:00 AM to 5:29 AM | 89 (5.4%) | 12 (0.9%) |
| 5:30 AM to 5:59 AM | 142 (8.7%) | 10 (0.8%) |
| 6:00 AM to 6:29 AM | 265 (16.2%) | 17 (1.3%) |
| 6:30 AM to 6:59 AM | 179 (11.0%) | 146 (11.3%) |
| 7:00 AM to 7:29 AM | 210 (12.8%) | 216 (16.7%) |
| 7:30 AM to 7:59 AM | 199 (12.2%) | 381 (29.4%) |
| 8:00 AM to 8:29 AM | 151 (9.2%) | 170 (13.1%) |
| 8:30 AM to 8:59 AM | 23 (1.4%) | 16 (1.2%) |
| 9:00 AM to 9:59 AM | 62 (3.8%) | 161 (12.4%) |
| 10:00 AM to 10:59 AM | 9 (0.5%) | 0 (0.0%) |
| 11:00 AM to 11:59 AM | 0 (0.0%) | 14 (1.1%) |
| 12:00 PM to 3:59 PM | 61 (3.7%) | 84 (6.5%) |
| 4:00 PM to 11:59 PM | 80 (4.9%) | 34 (2.6%) |
| Total | 1,635 (100.0%) | 1,296 (100.0%) |
Housing Occupancy in Sidney
Occupancy by Ownership in Sidney
Of the total 2,516 dwellings in Sidney, owner-occupied units account for 1,561 (62.0%), while renter-occupied units make up 955 (38.0%).
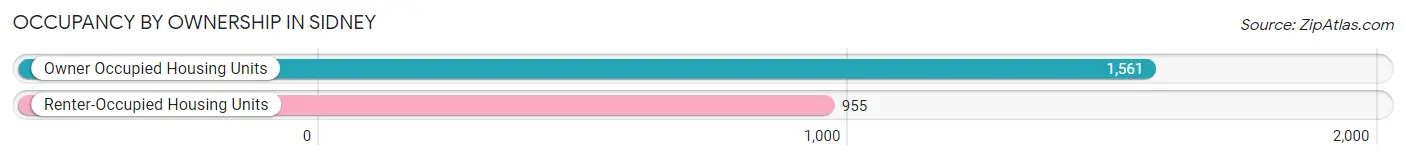
| Occupancy | # Housing Units | % Housing Units |
| Owner Occupied Housing Units | 1,561 | 62.0% |
| Renter-Occupied Housing Units | 955 | 38.0% |
| Total Occupied Housing Units | 2,516 | 100.0% |
Occupancy by Household Size in Sidney
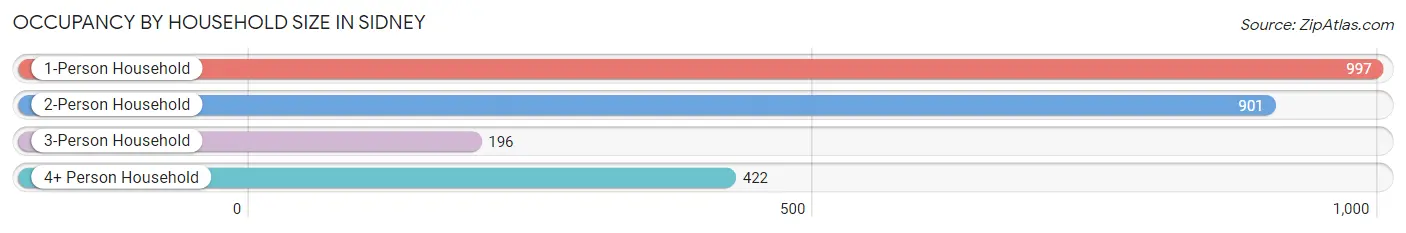
| Household Size | # Housing Units | % Housing Units |
| 1-Person Household | 997 | 39.6% |
| 2-Person Household | 901 | 35.8% |
| 3-Person Household | 196 | 7.8% |
| 4+ Person Household | 422 | 16.8% |
| Total Housing Units | 2,516 | 100.0% |
Occupancy by Ownership by Household Size in Sidney

| Household Size | Owner-occupied | Renter-occupied |
| 1-Person Household | 448 (44.9%) | 549 (55.1%) |
| 2-Person Household | 611 (67.8%) | 290 (32.2%) |
| 3-Person Household | 173 (88.3%) | 23 (11.7%) |
| 4+ Person Household | 329 (78.0%) | 93 (22.0%) |
| Total Housing Units | 1,561 (62.0%) | 955 (38.0%) |
Occupancy by Educational Attainment in Sidney
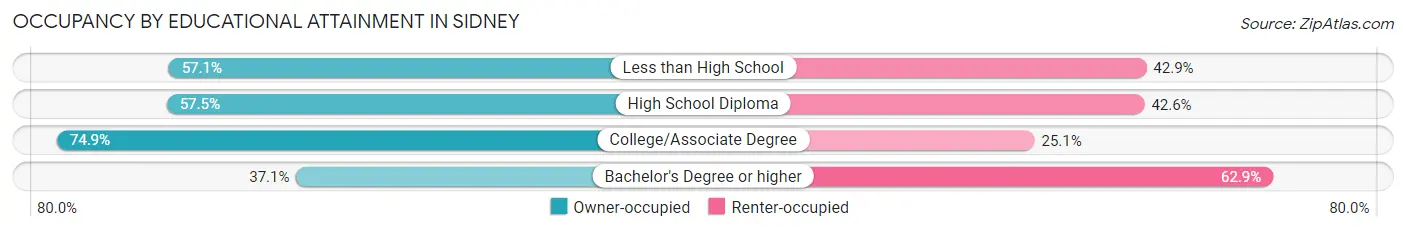
| Household Size | Owner-occupied | Renter-occupied |
| Less than High School | 64 (57.1%) | 48 (42.9%) |
| High School Diploma | 609 (57.5%) | 451 (42.5%) |
| College/Associate Degree | 772 (74.9%) | 259 (25.1%) |
| Bachelor's Degree or higher | 116 (37.1%) | 197 (62.9%) |
Occupancy by Age of Householder in Sidney
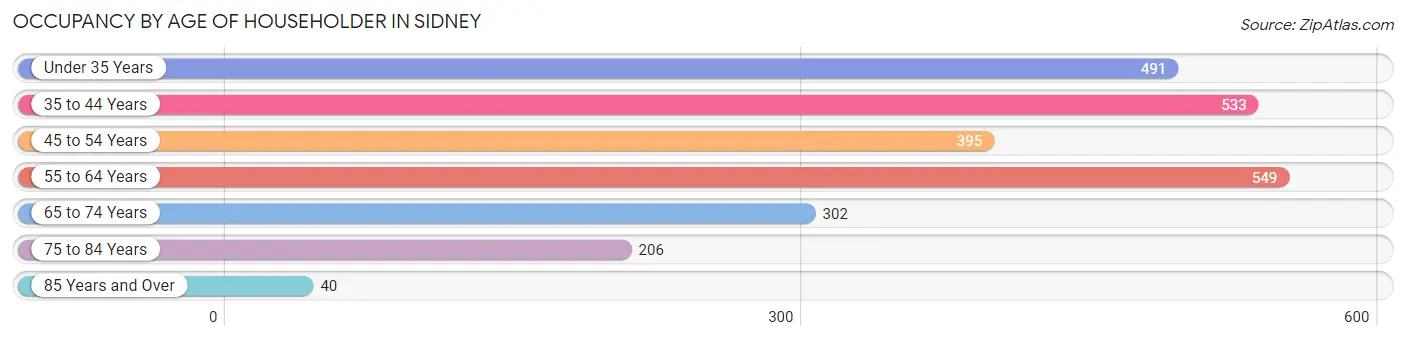
| Age Bracket | # Households | % Households |
| Under 35 Years | 491 | 19.5% |
| 35 to 44 Years | 533 | 21.2% |
| 45 to 54 Years | 395 | 15.7% |
| 55 to 64 Years | 549 | 21.8% |
| 65 to 74 Years | 302 | 12.0% |
| 75 to 84 Years | 206 | 8.2% |
| 85 Years and Over | 40 | 1.6% |
| Total | 2,516 | 100.0% |
Housing Finances in Sidney
Median Income by Occupancy in Sidney
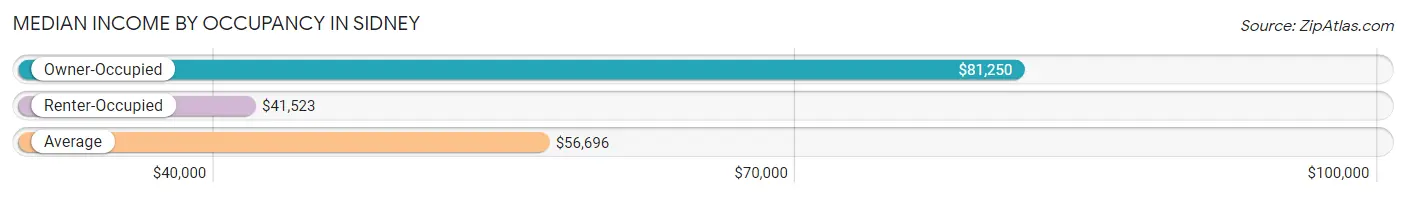
| Occupancy Type | # Households | Median Income |
| Owner-Occupied | 1,561 (62.0%) | $81,250 |
| Renter-Occupied | 955 (38.0%) | $41,523 |
| Average | 2,516 (100.0%) | $56,696 |
Occupancy by Householder Income Bracket in Sidney
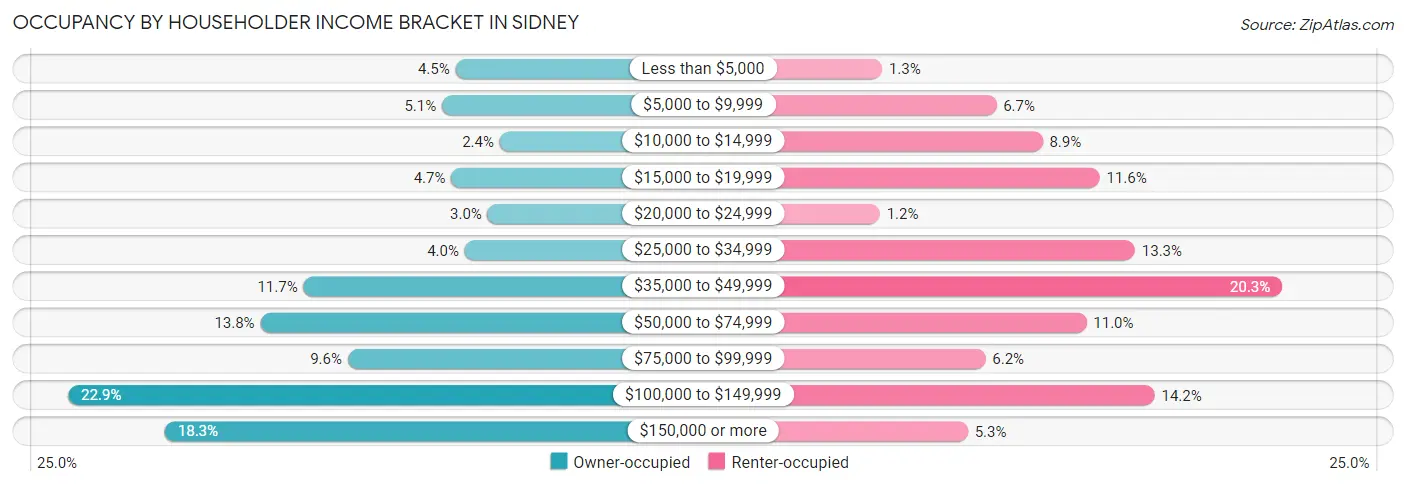
| Income Bracket | Owner-occupied | Renter-occupied |
| Less than $5,000 | 70 (4.5%) | 12 (1.3%) |
| $5,000 to $9,999 | 80 (5.1%) | 64 (6.7%) |
| $10,000 to $14,999 | 37 (2.4%) | 85 (8.9%) |
| $15,000 to $19,999 | 73 (4.7%) | 111 (11.6%) |
| $20,000 to $24,999 | 46 (2.9%) | 11 (1.1%) |
| $25,000 to $34,999 | 63 (4.0%) | 127 (13.3%) |
| $35,000 to $49,999 | 183 (11.7%) | 194 (20.3%) |
| $50,000 to $74,999 | 215 (13.8%) | 105 (11.0%) |
| $75,000 to $99,999 | 150 (9.6%) | 59 (6.2%) |
| $100,000 to $149,999 | 358 (22.9%) | 136 (14.2%) |
| $150,000 or more | 286 (18.3%) | 51 (5.3%) |
| Total | 1,561 (100.0%) | 955 (100.0%) |
Monthly Housing Cost Tiers in Sidney
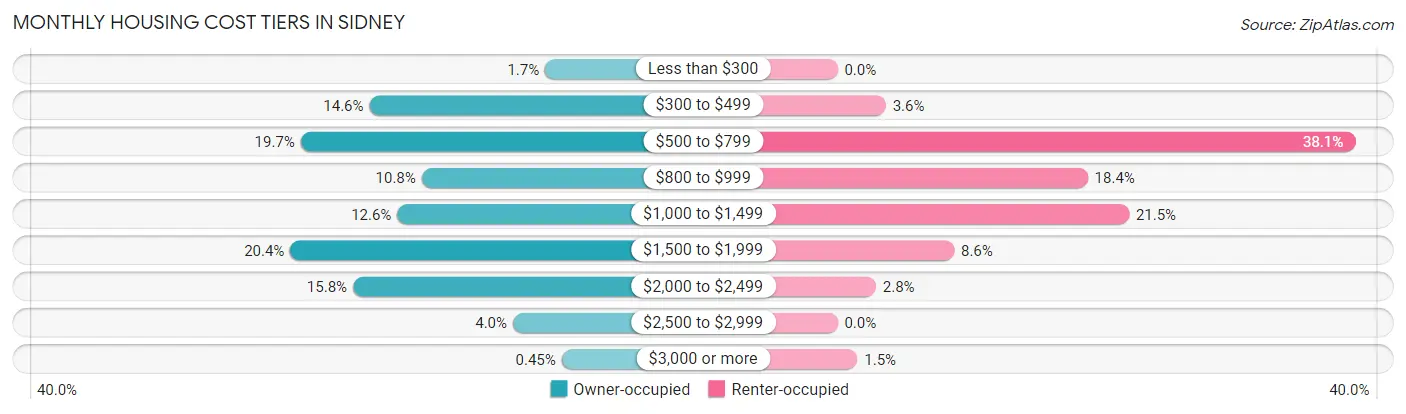
| Monthly Cost | Owner-occupied | Renter-occupied |
| Less than $300 | 26 (1.7%) | 0 (0.0%) |
| $300 to $499 | 228 (14.6%) | 34 (3.6%) |
| $500 to $799 | 307 (19.7%) | 364 (38.1%) |
| $800 to $999 | 168 (10.8%) | 176 (18.4%) |
| $1,000 to $1,499 | 196 (12.6%) | 205 (21.5%) |
| $1,500 to $1,999 | 319 (20.4%) | 82 (8.6%) |
| $2,000 to $2,499 | 247 (15.8%) | 27 (2.8%) |
| $2,500 to $2,999 | 63 (4.0%) | 0 (0.0%) |
| $3,000 or more | 7 (0.4%) | 14 (1.5%) |
| Total | 1,561 (100.0%) | 955 (100.0%) |
Physical Housing Characteristics in Sidney
Housing Structures in Sidney
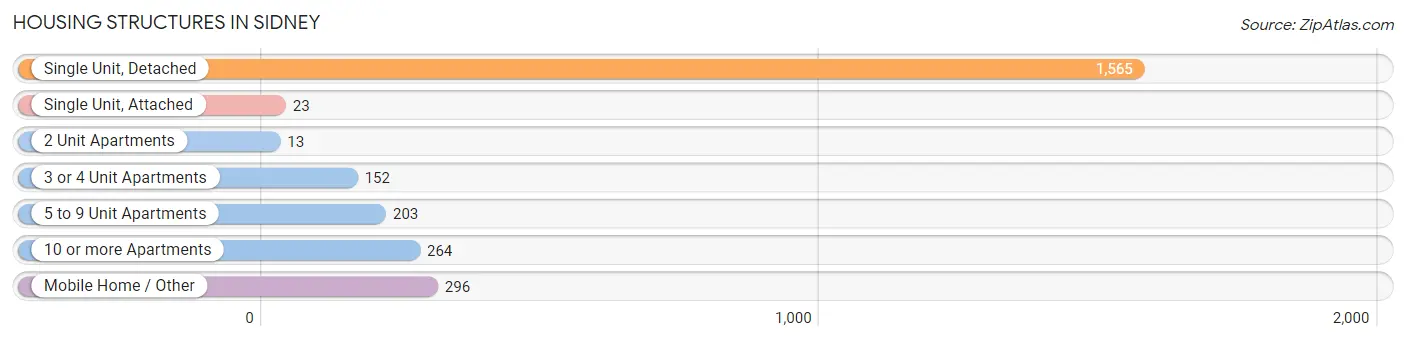
| Structure Type | # Housing Units | % Housing Units |
| Single Unit, Detached | 1,565 | 62.2% |
| Single Unit, Attached | 23 | 0.9% |
| 2 Unit Apartments | 13 | 0.5% |
| 3 or 4 Unit Apartments | 152 | 6.0% |
| 5 to 9 Unit Apartments | 203 | 8.1% |
| 10 or more Apartments | 264 | 10.5% |
| Mobile Home / Other | 296 | 11.8% |
| Total | 2,516 | 100.0% |
Housing Structures by Occupancy in Sidney
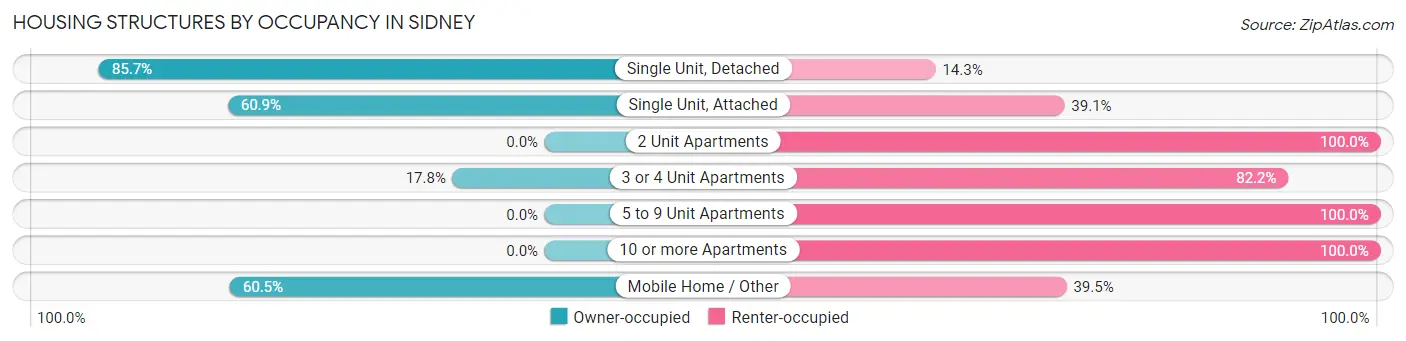
| Structure Type | Owner-occupied | Renter-occupied |
| Single Unit, Detached | 1,341 (85.7%) | 224 (14.3%) |
| Single Unit, Attached | 14 (60.9%) | 9 (39.1%) |
| 2 Unit Apartments | 0 (0.0%) | 13 (100.0%) |
| 3 or 4 Unit Apartments | 27 (17.8%) | 125 (82.2%) |
| 5 to 9 Unit Apartments | 0 (0.0%) | 203 (100.0%) |
| 10 or more Apartments | 0 (0.0%) | 264 (100.0%) |
| Mobile Home / Other | 179 (60.5%) | 117 (39.5%) |
| Total | 1,561 (62.0%) | 955 (38.0%) |
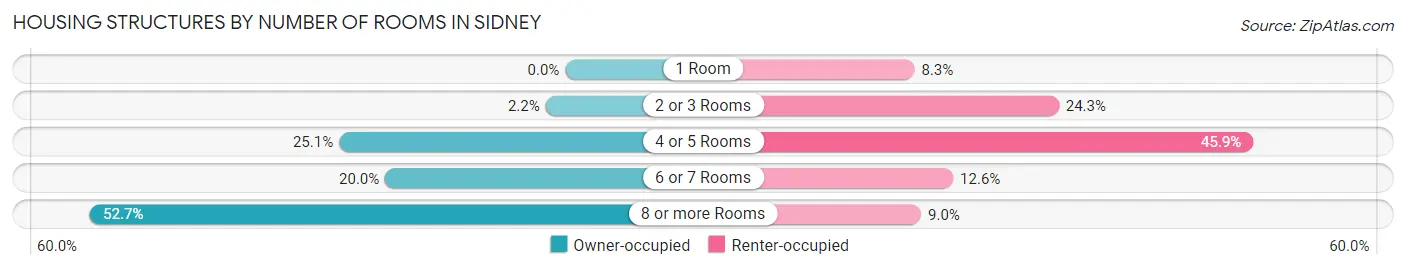
Housing Structures by Number of Rooms in Sidney
| Number of Rooms | Owner-occupied | Renter-occupied |
| 1 Room | 0 (0.0%) | 79 (8.3%) |
| 2 or 3 Rooms | 34 (2.2%) | 232 (24.3%) |
| 4 or 5 Rooms | 392 (25.1%) | 438 (45.9%) |
| 6 or 7 Rooms | 312 (20.0%) | 120 (12.6%) |
| 8 or more Rooms | 823 (52.7%) | 86 (9.0%) |
| Total | 1,561 (100.0%) | 955 (100.0%) |
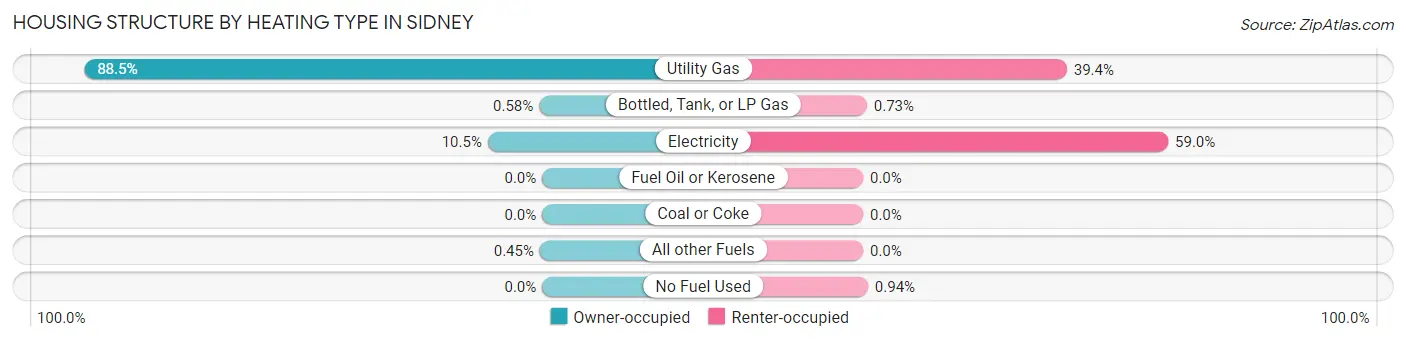
Housing Structure by Heating Type in Sidney
| Heating Type | Owner-occupied | Renter-occupied |
| Utility Gas | 1,381 (88.5%) | 376 (39.4%) |
| Bottled, Tank, or LP Gas | 9 (0.6%) | 7 (0.7%) |
| Electricity | 164 (10.5%) | 563 (59.0%) |
| Fuel Oil or Kerosene | 0 (0.0%) | 0 (0.0%) |
| Coal or Coke | 0 (0.0%) | 0 (0.0%) |
| All other Fuels | 7 (0.4%) | 0 (0.0%) |
| No Fuel Used | 0 (0.0%) | 9 (0.9%) |
| Total | 1,561 (100.0%) | 955 (100.0%) |
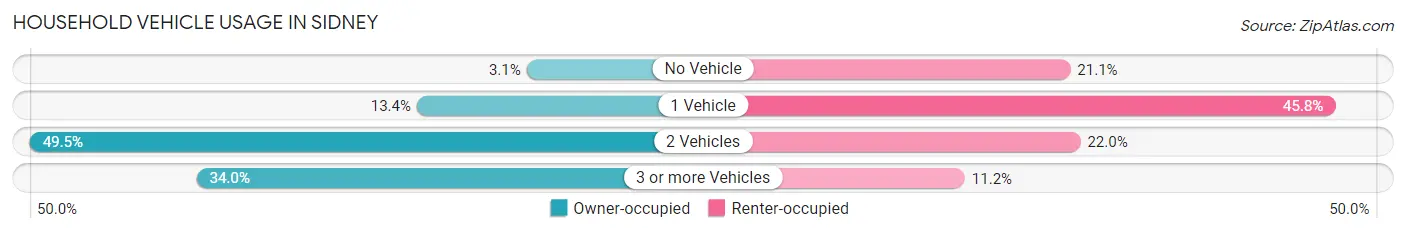
Household Vehicle Usage in Sidney
| Vehicles per Household | Owner-occupied | Renter-occupied |
| No Vehicle | 49 (3.1%) | 201 (21.0%) |
| 1 Vehicle | 209 (13.4%) | 437 (45.8%) |
| 2 Vehicles | 773 (49.5%) | 210 (22.0%) |
| 3 or more Vehicles | 530 (34.0%) | 107 (11.2%) |
| Total | 1,561 (100.0%) | 955 (100.0%) |
Real Estate & Mortgages in Sidney
Real Estate and Mortgage Overview in Sidney
| Characteristic | Without Mortgage | With Mortgage |
| Housing Units | 660 | 901 |
| Median Property Value | $237,400 | $259,100 |
| Median Household Income | $39,861 | $199 |
| Monthly Housing Costs | $550 | $7 |
| Real Estate Taxes | $1,797 | $10 |
Property Value by Mortgage Status in Sidney
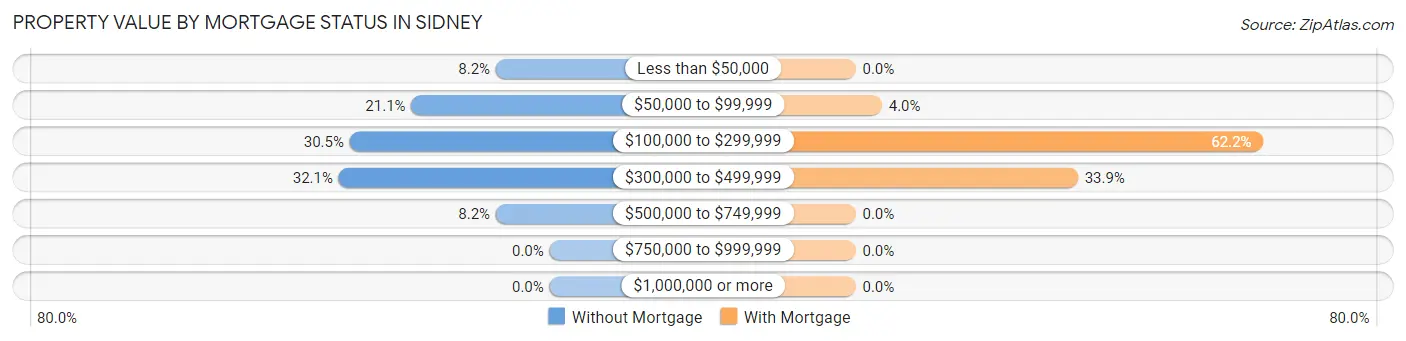
| Property Value | Without Mortgage | With Mortgage |
| Less than $50,000 | 54 (8.2%) | 0 (0.0%) |
| $50,000 to $99,999 | 139 (21.1%) | 36 (4.0%) |
| $100,000 to $299,999 | 201 (30.4%) | 560 (62.2%) |
| $300,000 to $499,999 | 212 (32.1%) | 305 (33.9%) |
| $500,000 to $749,999 | 54 (8.2%) | 0 (0.0%) |
| $750,000 to $999,999 | 0 (0.0%) | 0 (0.0%) |
| $1,000,000 or more | 0 (0.0%) | 0 (0.0%) |
| Total | 660 (100.0%) | 901 (100.0%) |
Household Income by Mortgage Status in Sidney
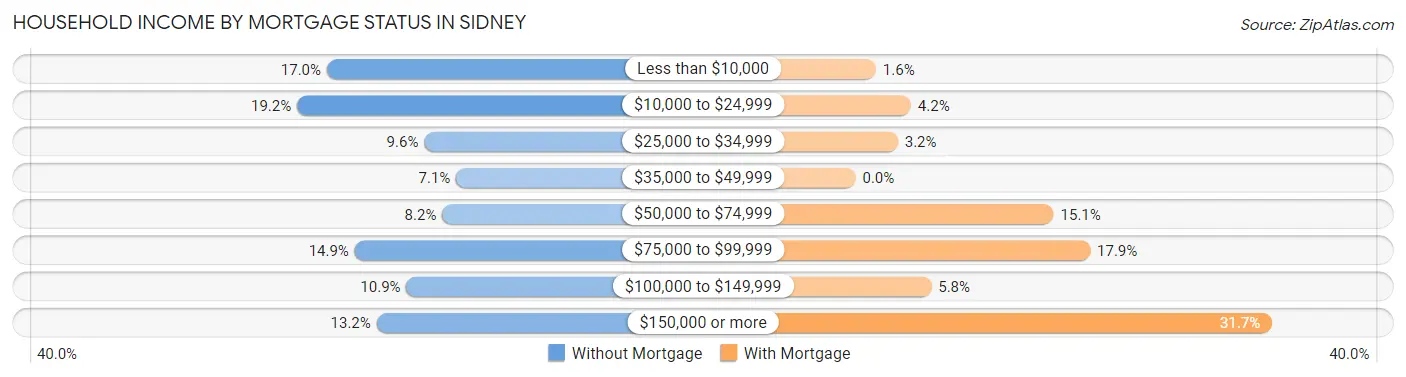
| Household Income | Without Mortgage | With Mortgage |
| Less than $10,000 | 112 (17.0%) | 14 (1.5%) |
| $10,000 to $24,999 | 127 (19.2%) | 38 (4.2%) |
| $25,000 to $34,999 | 63 (9.6%) | 29 (3.2%) |
| $35,000 to $49,999 | 47 (7.1%) | 0 (0.0%) |
| $50,000 to $74,999 | 54 (8.2%) | 136 (15.1%) |
| $75,000 to $99,999 | 98 (14.8%) | 161 (17.9%) |
| $100,000 to $149,999 | 72 (10.9%) | 52 (5.8%) |
| $150,000 or more | 87 (13.2%) | 286 (31.7%) |
| Total | 660 (100.0%) | 901 (100.0%) |
Property Value to Household Income Ratio in Sidney
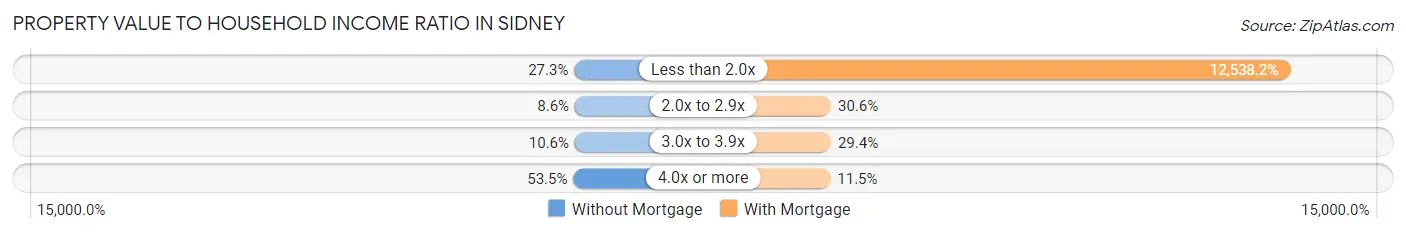
| Value-to-Income Ratio | Without Mortgage | With Mortgage |
| Less than 2.0x | 180 (27.3%) | 112,969 (12,538.2%) |
| 2.0x to 2.9x | 57 (8.6%) | 276 (30.6%) |
| 3.0x to 3.9x | 70 (10.6%) | 265 (29.4%) |
| 4.0x or more | 353 (53.5%) | 104 (11.5%) |
| Total | 660 (100.0%) | 901 (100.0%) |
Real Estate Taxes by Mortgage Status in Sidney
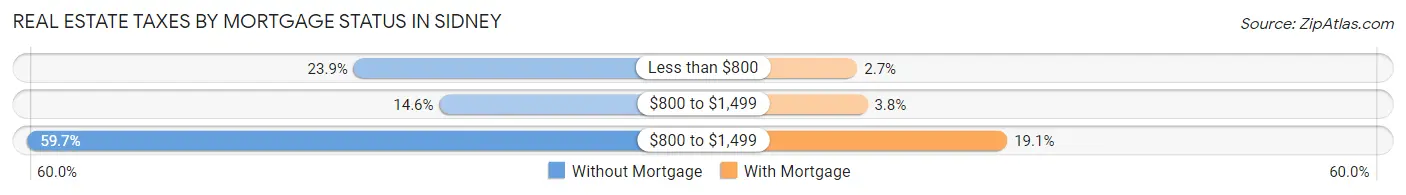
| Property Taxes | Without Mortgage | With Mortgage |
| Less than $800 | 158 (23.9%) | 24 (2.7%) |
| $800 to $1,499 | 96 (14.5%) | 34 (3.8%) |
| $800 to $1,499 | 394 (59.7%) | 172 (19.1%) |
| Total | 660 (100.0%) | 901 (100.0%) |
Health & Disability in Sidney
Health Insurance Coverage by Age in Sidney
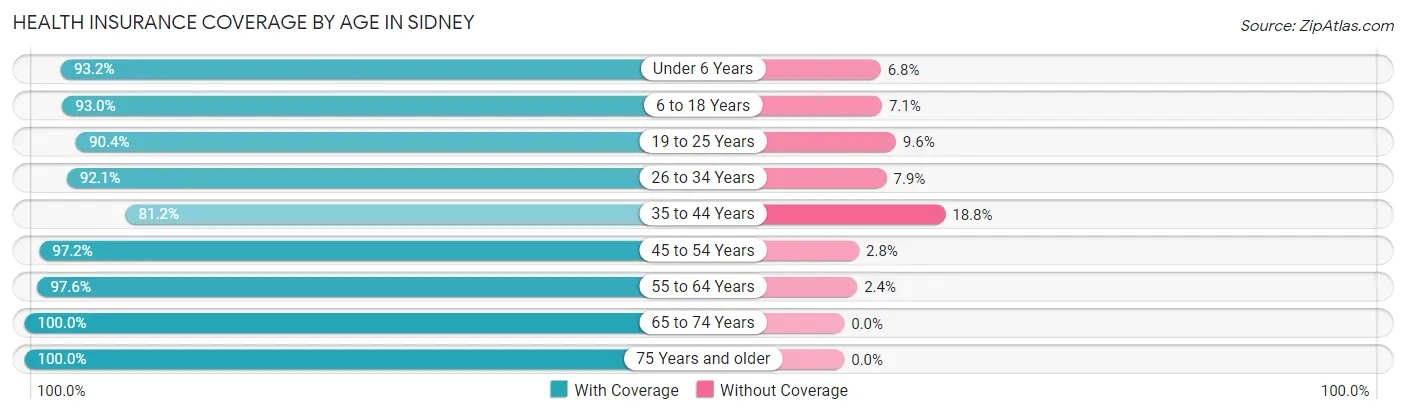
| Age Bracket | With Coverage | Without Coverage |
| Under 6 Years | 412 (93.2%) | 30 (6.8%) |
| 6 to 18 Years | 1,161 (92.9%) | 88 (7.0%) |
| 19 to 25 Years | 432 (90.4%) | 46 (9.6%) |
| 26 to 34 Years | 584 (92.1%) | 50 (7.9%) |
| 35 to 44 Years | 771 (81.2%) | 179 (18.8%) |
| 45 to 54 Years | 705 (97.2%) | 20 (2.8%) |
| 55 to 64 Years | 850 (97.6%) | 21 (2.4%) |
| 65 to 74 Years | 618 (100.0%) | 0 (0.0%) |
| 75 Years and older | 281 (100.0%) | 0 (0.0%) |
| Total | 5,814 (93.0%) | 434 (7.0%) |
Health Insurance Coverage by Citizenship Status in Sidney
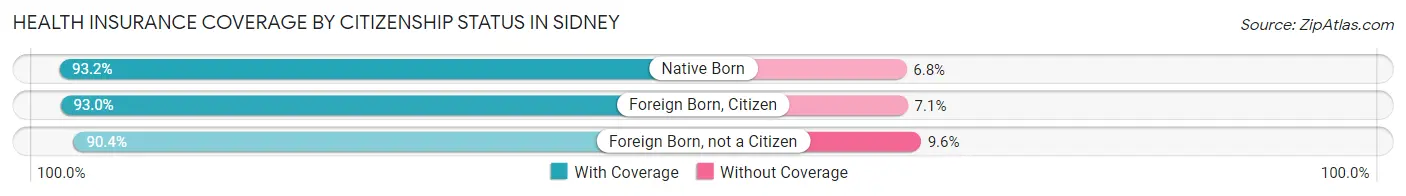
| Citizenship Status | With Coverage | Without Coverage |
| Native Born | 412 (93.2%) | 30 (6.8%) |
| Foreign Born, Citizen | 1,161 (92.9%) | 88 (7.0%) |
| Foreign Born, not a Citizen | 432 (90.4%) | 46 (9.6%) |
Health Insurance Coverage by Household Income in Sidney
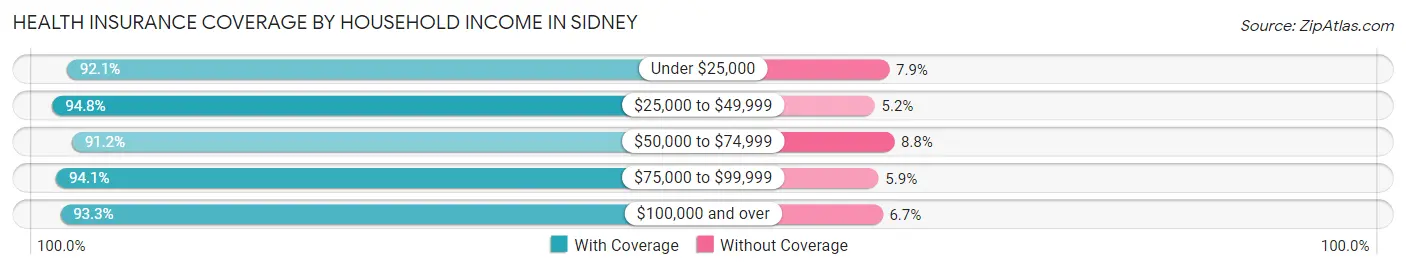
| Household Income | With Coverage | Without Coverage |
| Under $25,000 | 685 (92.1%) | 59 (7.9%) |
| $25,000 to $49,999 | 947 (94.8%) | 52 (5.2%) |
| $50,000 to $74,999 | 969 (91.2%) | 94 (8.8%) |
| $75,000 to $99,999 | 540 (94.1%) | 34 (5.9%) |
| $100,000 and over | 2,641 (93.3%) | 189 (6.7%) |
Public vs Private Health Insurance Coverage by Age in Sidney
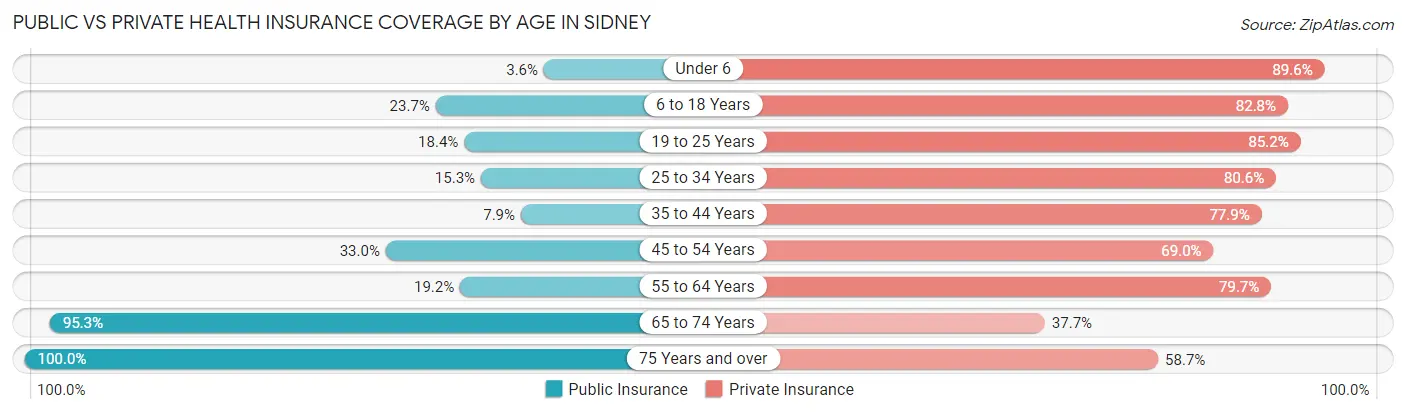
| Age Bracket | Public Insurance | Private Insurance |
| Under 6 | 16 (3.6%) | 396 (89.6%) |
| 6 to 18 Years | 296 (23.7%) | 1,034 (82.8%) |
| 19 to 25 Years | 88 (18.4%) | 407 (85.2%) |
| 25 to 34 Years | 97 (15.3%) | 511 (80.6%) |
| 35 to 44 Years | 75 (7.9%) | 740 (77.9%) |
| 45 to 54 Years | 239 (33.0%) | 500 (69.0%) |
| 55 to 64 Years | 167 (19.2%) | 694 (79.7%) |
| 65 to 74 Years | 589 (95.3%) | 233 (37.7%) |
| 75 Years and over | 281 (100.0%) | 165 (58.7%) |
| Total | 1,848 (29.6%) | 4,680 (74.9%) |
Disability Status by Sex by Age in Sidney
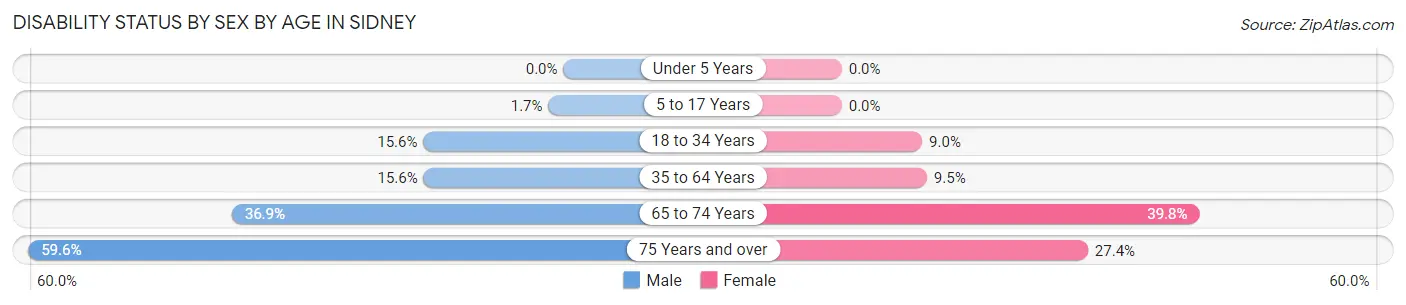
| Age Bracket | Male | Female |
| Under 5 Years | 0 (0.0%) | 0 (0.0%) |
| 5 to 17 Years | 10 (1.7%) | 0 (0.0%) |
| 18 to 34 Years | 88 (15.6%) | 56 (8.9%) |
| 35 to 64 Years | 191 (15.6%) | 125 (9.5%) |
| 65 to 74 Years | 103 (36.9%) | 135 (39.8%) |
| 75 Years and over | 87 (59.6%) | 37 (27.4%) |
Disability Class by Sex by Age in Sidney
Disability Class: Hearing Difficulty
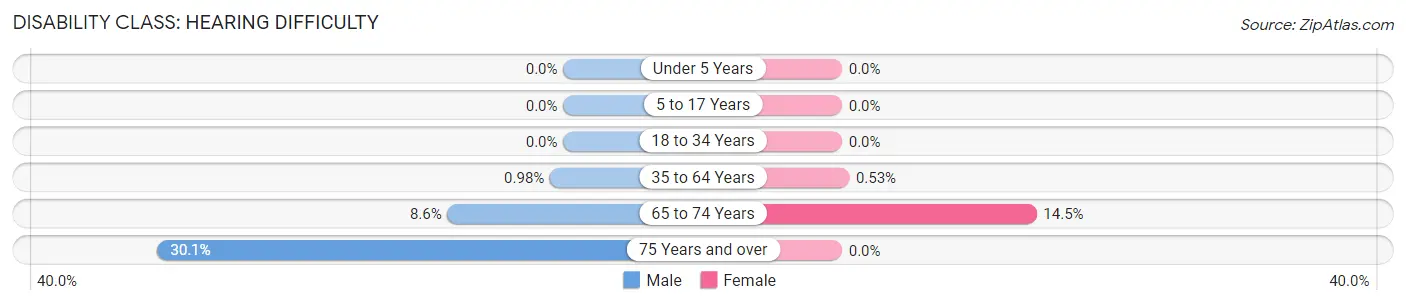
| Age Bracket | Male | Female |
| Under 5 Years | 0 (0.0%) | 0 (0.0%) |
| 5 to 17 Years | 0 (0.0%) | 0 (0.0%) |
| 18 to 34 Years | 0 (0.0%) | 0 (0.0%) |
| 35 to 64 Years | 12 (1.0%) | 7 (0.5%) |
| 65 to 74 Years | 24 (8.6%) | 49 (14.4%) |
| 75 Years and over | 44 (30.1%) | 0 (0.0%) |
Disability Class: Vision Difficulty
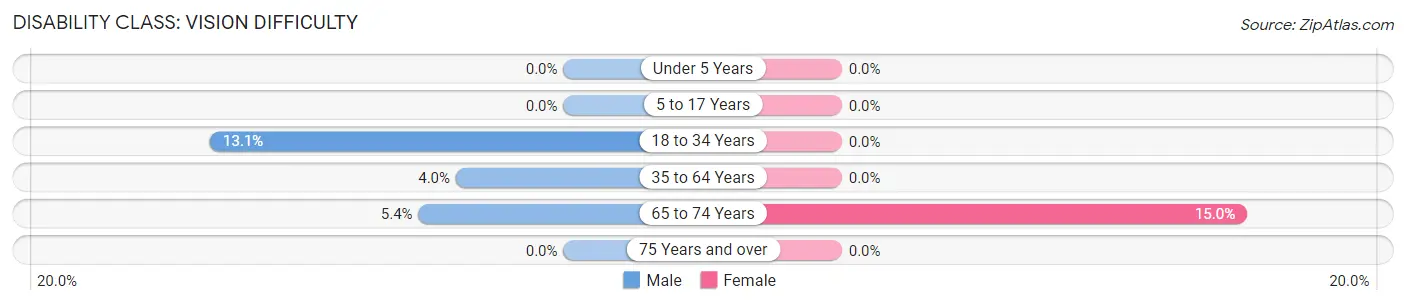
| Age Bracket | Male | Female |
| Under 5 Years | 0 (0.0%) | 0 (0.0%) |
| 5 to 17 Years | 0 (0.0%) | 0 (0.0%) |
| 18 to 34 Years | 74 (13.1%) | 0 (0.0%) |
| 35 to 64 Years | 49 (4.0%) | 0 (0.0%) |
| 65 to 74 Years | 15 (5.4%) | 51 (15.0%) |
| 75 Years and over | 0 (0.0%) | 0 (0.0%) |
Disability Class: Cognitive Difficulty
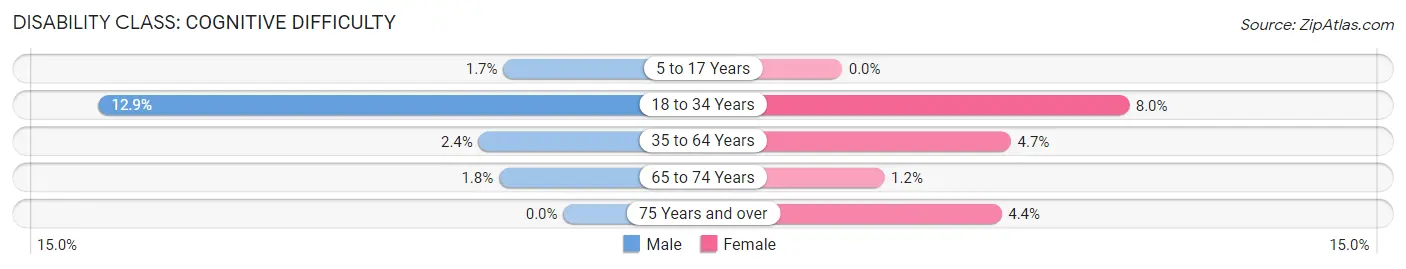
| Age Bracket | Male | Female |
| 5 to 17 Years | 10 (1.7%) | 0 (0.0%) |
| 18 to 34 Years | 73 (12.9%) | 50 (8.0%) |
| 35 to 64 Years | 29 (2.4%) | 62 (4.7%) |
| 65 to 74 Years | 5 (1.8%) | 4 (1.2%) |
| 75 Years and over | 0 (0.0%) | 6 (4.4%) |
Disability Class: Ambulatory Difficulty
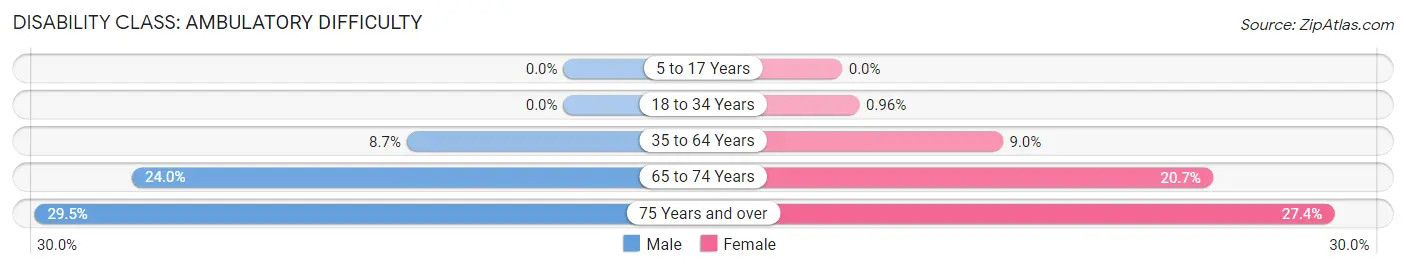
| Age Bracket | Male | Female |
| 5 to 17 Years | 0 (0.0%) | 0 (0.0%) |
| 18 to 34 Years | 0 (0.0%) | 6 (1.0%) |
| 35 to 64 Years | 107 (8.7%) | 118 (8.9%) |
| 65 to 74 Years | 67 (24.0%) | 70 (20.6%) |
| 75 Years and over | 43 (29.4%) | 37 (27.4%) |
Disability Class: Self-Care Difficulty
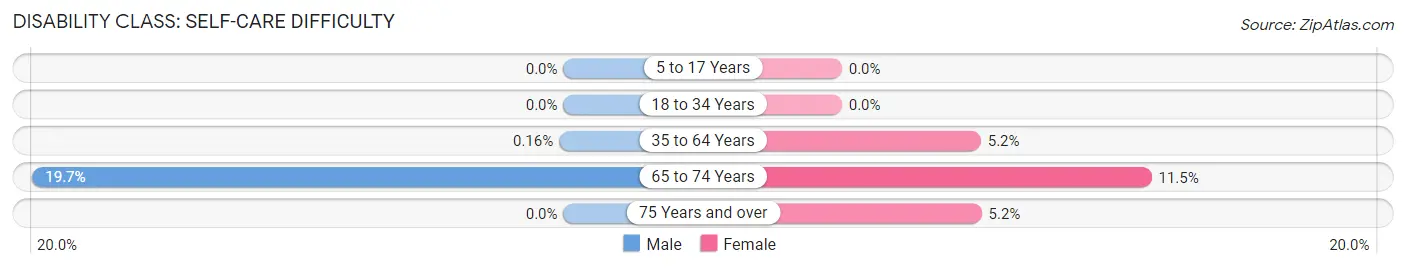
| Age Bracket | Male | Female |
| 5 to 17 Years | 0 (0.0%) | 0 (0.0%) |
| 18 to 34 Years | 0 (0.0%) | 0 (0.0%) |
| 35 to 64 Years | 2 (0.2%) | 68 (5.2%) |
| 65 to 74 Years | 55 (19.7%) | 39 (11.5%) |
| 75 Years and over | 0 (0.0%) | 7 (5.2%) |
Technology Access in Sidney
Computing Device Access in Sidney
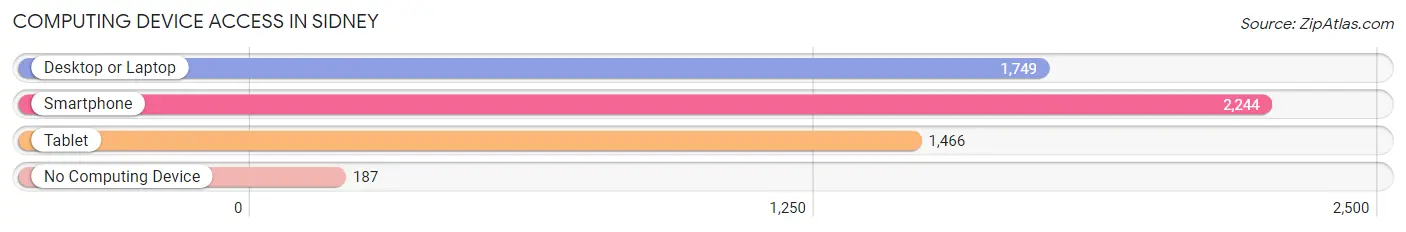
| Device Type | # Households | % Households |
| Desktop or Laptop | 1,749 | 69.5% |
| Smartphone | 2,244 | 89.2% |
| Tablet | 1,466 | 58.3% |
| No Computing Device | 187 | 7.4% |
| Total | 2,516 | 100.0% |
Internet Access in Sidney
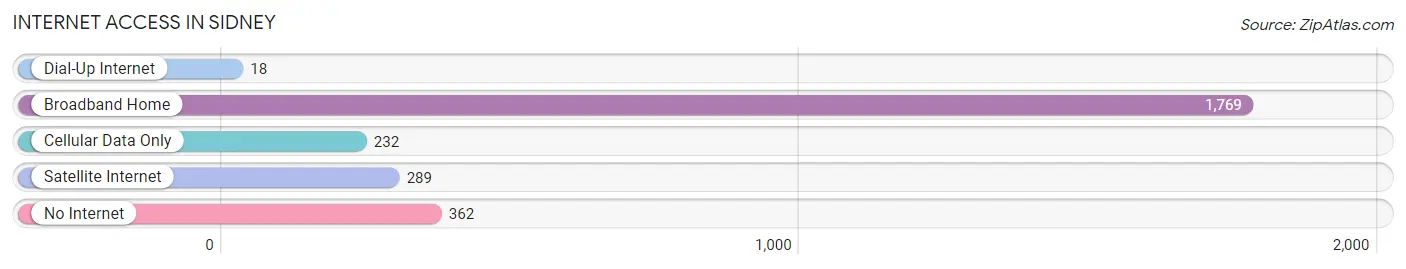
| Internet Type | # Households | % Households |
| Dial-Up Internet | 18 | 0.7% |
| Broadband Home | 1,769 | 70.3% |
| Cellular Data Only | 232 | 9.2% |
| Satellite Internet | 289 | 11.5% |
| No Internet | 362 | 14.4% |
| Total | 2,516 | 100.0% |
Sidney Summary
Sidney, Montana is a small city located in the northeastern corner of the state, near the North Dakota border. It is the county seat of Richland County and the largest city in the region. The city has a population of 5,191 as of the 2010 census, and is the principal city of the Sidney Micropolitan Statistical Area, which includes all of Richland County.
History
Sidney was founded in 1883 by the Northern Pacific Railroad. The city was named after Sidney Dillon, a director of the railroad. The city was incorporated in 1885 and quickly became a major hub for the railroad. The city was also a major center for agriculture, with many farmers settling in the area.
Geography
Sidney is located in the northeastern corner of Montana, near the North Dakota border. It is situated in the Yellowstone River Valley, and is surrounded by rolling hills and prairies. The city is located at an elevation of 2,068 feet (630 m).
The climate in Sidney is semi-arid, with hot summers and cold winters. The average annual temperature is 45.3°F (7.4°C). The average annual precipitation is 13.7 inches (348 mm).
Economy
Sidney is the economic center of Richland County. The city is home to several major employers, including the Northern Pacific Railroad, the Sidney Sugars Refinery, and the Sidney Health Center. The city is also home to several retail stores, restaurants, and other businesses.
Agriculture is a major part of the economy in Sidney. The city is home to several large farms, and the surrounding area is known for its production of wheat, barley, and other grains.
Demographics
As of the 2010 census, the population of Sidney was 5,191. The racial makeup of the city was 94.2% White, 0.7% African American, 0.7% Native American, 0.3% Asian, 0.1% Pacific Islander, 1.7% from other races, and 2.2% from two or more races. Hispanic or Latino of any race were 4.2% of the population.
The median income for a household in Sidney was $41,945, and the median income for a family was $50,945. The per capita income for the city was $20,945. About 11.2% of families and 14.2% of the population were below the poverty line, including 18.2% of those under age 18 and 8.2% of those age 65 or over.
Common Questions
What is Per Capita Income in Sidney?
Per Capita income in Sidney is $34,381.
What is the Median Family Income in Sidney?
Median Family Income in Sidney is $88,750.
What is the Median Household income in Sidney?
Median Household Income in Sidney is $56,696.
What is Income or Wage Gap in Sidney?
Income or Wage Gap in Sidney is 46.2%.
Women in Sidney earn 53.8 cents for every dollar earned by a man.
What is Inequality or Gini Index in Sidney?
Inequality or Gini Index in Sidney is 0.49.
What is the Total Population of Sidney?
Total Population of Sidney is 6,257.
What is the Total Male Population of Sidney?
Total Male Population of Sidney is 3,010.
What is the Total Female Population of Sidney?
Total Female Population of Sidney is 3,247.
What is the Ratio of Males per 100 Females in Sidney?
There are 92.70 Males per 100 Females in Sidney.
What is the Ratio of Females per 100 Males in Sidney?
There are 107.87 Females per 100 Males in Sidney.
What is the Median Population Age in Sidney?
Median Population Age in Sidney is 39.4 Years.
What is the Average Family Size in Sidney
Average Family Size in Sidney is 3.5 People.
What is the Average Household Size in Sidney
Average Household Size in Sidney is 2.5 People.
How Large is the Labor Force in Sidney?
There are 3,290 People in the Labor Forcein in Sidney.
What is the Percentage of People in the Labor Force in Sidney?
67.7% of People are in the Labor Force in Sidney.
What is the Unemployment Rate in Sidney?
Unemployment Rate in Sidney is 5.1%.