Zip Codes with the Highest Percentage of Households with Income Above $200,000 in Billings, MT
RELATED REPORTS & OPTIONS
Household Income | $200k+
Billings
Compare Zip Codes
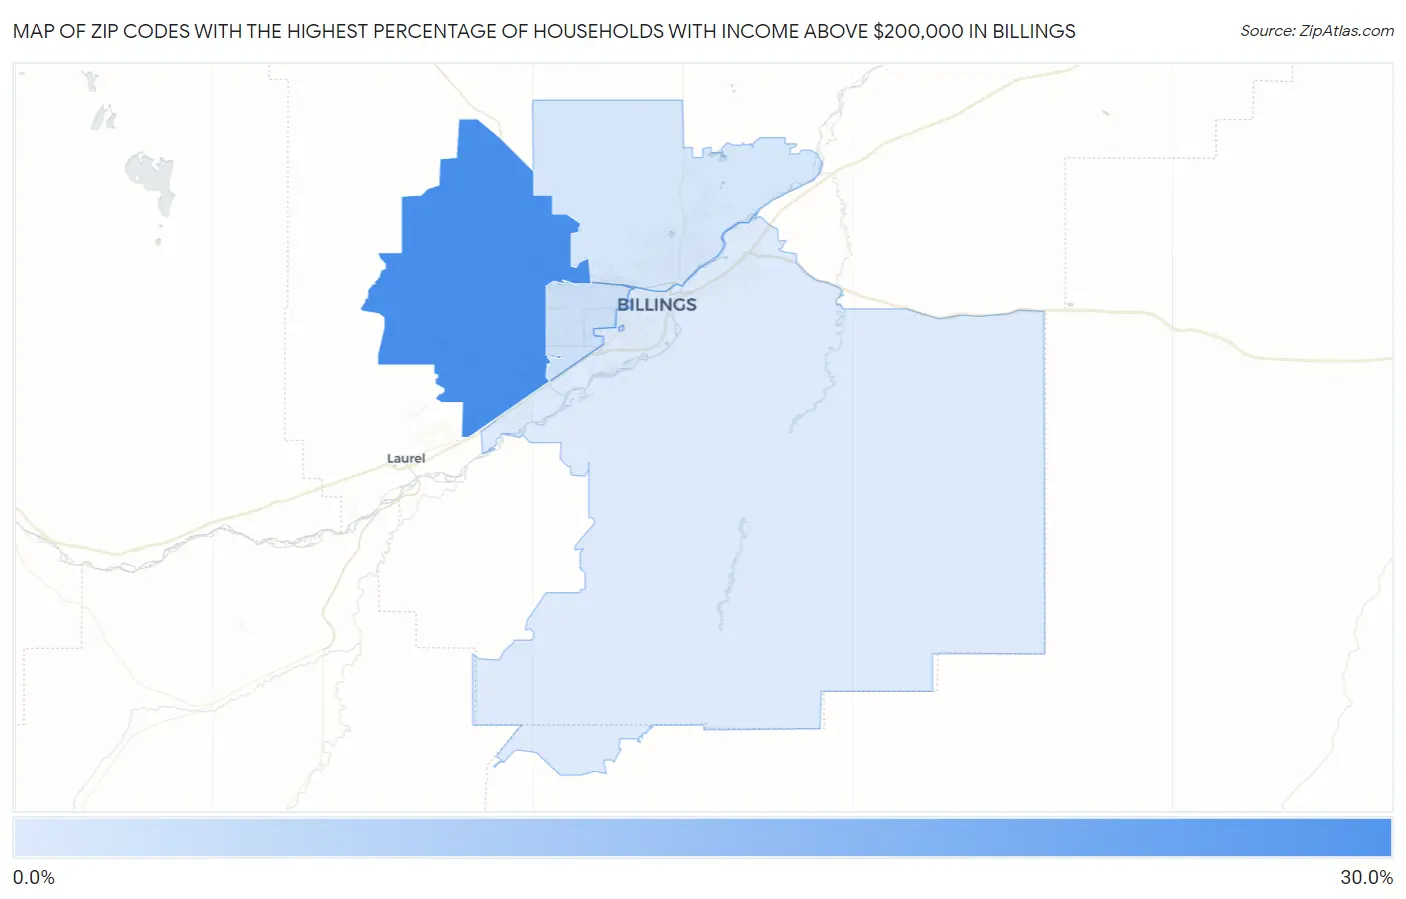
Map of Zip Codes with the Highest Percentage of Households with Income Above $200,000 in Billings
5.5%
25.9%
Zip Codes with the Highest Percentage of Households with Income Above $200,000 in Billings, MT
| Zip Code | Households with Income > $200k | vs State | vs National | |
| 1. | 59106 | 25.9% | 7.2%(+18.7)#8 | 11.4%(+14.5)#2,042 |
| 2. | 59102 | 7.6% | 7.2%(+0.400)#96 | 11.4%(-3.80)#10,894 |
| 3. | 59105 | 6.3% | 7.2%(-0.900)#125 | 11.4%(-5.10)#12,905 |
| 4. | 59101 | 5.5% | 7.2%(-1.70)#144 | 11.4%(-5.90)#14,478 |
1
Common Questions
What are the Top 3 Zip Codes with the Highest Percentage of Households with Income Above $200,000 in Billings, MT?
Top 3 Zip Codes with the Highest Percentage of Households with Income Above $200,000 in Billings, MT are:
What zip code has the Highest Percentage of Households with Income Above $200,000 in Billings, MT?
59106 has the Highest Percentage of Households with Income Above $200,000 in Billings, MT with 25.9%.
What is the Percentage of Households with Income Above $200,000 in Billings, MT?
Percentage of Households with Income Above $200,000 in Billings is 8.8%.
What is the Percentage of Households with Income Above $200,000 in Montana?
Percentage of Households with Income Above $200,000 in Montana is 7.2%.
What is the Percentage of Households with Income Above $200,000 in the United States?
Percentage of Households with Income Above $200,000 in the United States is 11.4%.