Zip Codes with the Highest Percentage of Households with Income Below $10,000 in Wichita, KS

RELATED REPORTS & OPTIONS

Household Income | $0-10k
Population
Families and Households
Female Fertility
Female Fertility (Unmarried)
Race (Community Size)
Race (Percentage)
Ancestry (Community Size)
AfricanAlaska NativeAmericanApacheArabArapahoArgentineanArmenianAustralianAustrianBangladeshiBarbadianBelgianBhutaneseBlackfeetBolivianBrazilianBritishBulgarianBurmeseCajunCanadianCelticCentral AmericanCentral American IndianCherokeeCheyenneChickasawChileanChippewaChoctawColombianComancheCosta RicanCreekCroatianCubanCzechCzechoslovakianDanishDelawareDominicanDutchDutch West IndianEastern EuropeanEcuadorianEgyptianEnglishEthiopianEuropeanFilipinoFinnishFrenchFrench American IndianFrench CanadianGermanGerman RussianGhanaianGreekGuamanian / ChamorroGuatemalanHaitianHonduranHungarianIcelanderIndian (Asian)IndonesianInupiatIranianIrishIroquoisItalianJamaicanJapaneseJordanianKenyanKiowaKoreanLaotianLebaneseLithuanianLuxembourgerMalaysianMexicanMexican American IndianMongolianMoroccanNative HawaiianNavajoNicaraguanNigerianNorthern EuropeanNorwegianOsageOttawaPakistaniPalestinianPanamanianParaguayanPennsylvania GermanPeruvianPimaPolishPortuguesePotawatomiPuebloPuerto RicanRomanianRussianSalvadoranSamoanScandinavianScotch-IrishScottishSeminoleSiouxSlavicSlovakSloveneSouth AfricanSouth AmericanSpaniardSpanishSpanish AmericanSpanish American IndianSri LankanSubsaharan AfricanSwedishSwissSyrianThaiTrinidadian and TobagonianTurkishUgandanUkrainianVenezuelanWelshWest IndianYugoslavian
Ancestry (Percentage)
AfricanAlaska NativeAmericanApacheArabArapahoArgentineanArmenianAustralianAustrianBangladeshiBarbadianBelgianBhutaneseBlackfeetBolivianBrazilianBritishBulgarianBurmeseCajunCanadianCelticCentral AmericanCentral American IndianCherokeeCheyenneChickasawChileanChippewaChoctawColombianComancheCosta RicanCreekCroatianCubanCzechCzechoslovakianDanishDelawareDominicanDutchDutch West IndianEastern EuropeanEcuadorianEgyptianEnglishEthiopianEuropeanFilipinoFinnishFrenchFrench American IndianFrench CanadianGermanGerman RussianGhanaianGreekGuamanian / ChamorroGuatemalanHaitianHonduranHungarianIcelanderIndian (Asian)IndonesianInupiatIranianIrishIroquoisItalianJamaicanJapaneseJordanianKenyanKiowaKoreanLaotianLebaneseLithuanianLuxembourgerMalaysianMexicanMexican American IndianMongolianMoroccanNative HawaiianNavajoNicaraguanNigerianNorthern EuropeanNorwegianOsageOttawaPakistaniPalestinianPanamanianParaguayanPennsylvania GermanPeruvianPimaPolishPortuguesePotawatomiPuebloPuerto RicanRomanianRussianSalvadoranSamoanScandinavianScotch-IrishScottishSeminoleSiouxSlavicSlovakSloveneSouth AfricanSouth AmericanSpaniardSpanishSpanish AmericanSpanish American IndianSri LankanSubsaharan AfricanSwedishSwissSyrianThaiTrinidadian and TobagonianTurkishUgandanUkrainianVenezuelanWelshWest IndianYugoslavian
Immigrant Origin (Total)
Immigrant Origin (Percentage)
Income
Income (Families)
Income (Households)
Poverty
Poverty (Families)
Unemployment
Employment Occupations
Employment Industries
Employer Class
Commute Time
Commute Means
School Enrollment
Education by Degree Field
Occupancy
Finances
Physical Characteristics
Wichita
Compare Zip Codes
Comparison Subject

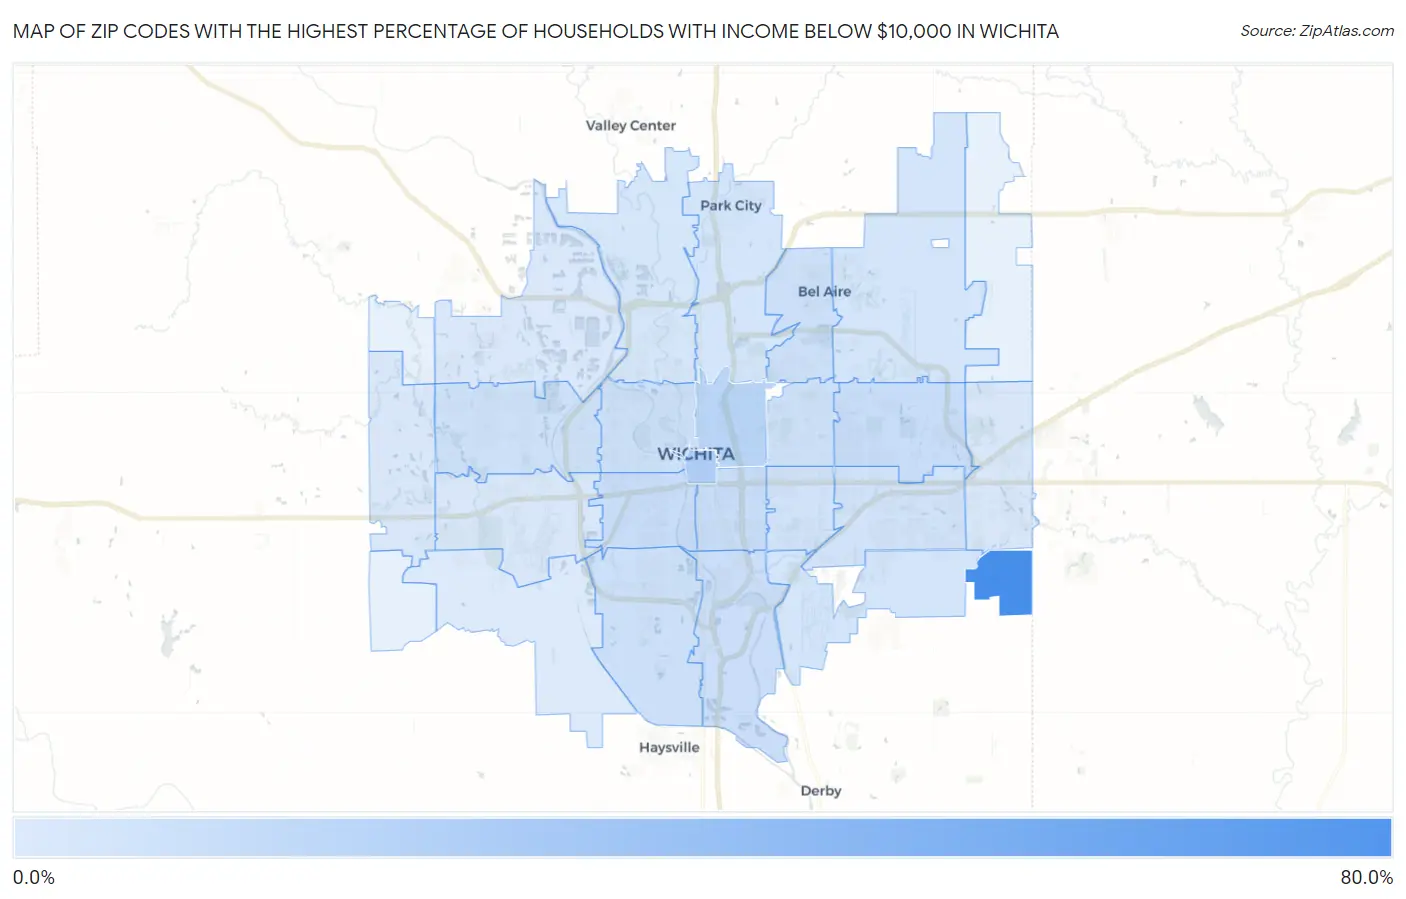
Map of Zip Codes with the Highest Percentage of Households with Income Below $10,000 in Wichita

0.0%
80.0%
Zip Codes with the Highest Percentage of Households with Income Below $10,000 in Wichita Map

Zip Codes with the Highest Percentage of Households with Income Below $10,000 in Wichita, KS

Zip Code Households with Income < $10k vs State vs National
1.6723267.6%4.5%(+63.1)#14.9%(+62.7)#61
2.6720217.8%4.5%(+13.3)#164.9%(+12.9)#1,048
3.6721413.0%4.5%(+8.50)#304.9%(+8.10)#2,072
4.672138.1%4.5%(+3.60)#784.9%(+3.20)#5,419
5.672067.7%4.5%(+3.20)#874.9%(+2.80)#5,950
6.672117.5%4.5%(+3.00)#964.9%(+2.60)#6,225
7.672166.8%4.5%(+2.30)#1164.9%(+1.90)#7,341
8.672206.3%4.5%(+1.80)#1354.9%(+1.40)#8,366
9.672035.9%4.5%(+1.40)#1584.9%(+1.00)#9,226
10.672175.8%4.5%(+1.30)#1664.9%(+0.900)#9,465
11.672085.3%4.5%(+0.800)#1884.9%(+0.400)#10,800
12.672125.0%4.5%(+0.500)#2084.9%(+0.100)#11,659
13.672074.7%4.5%(+0.200)#2334.9%(-0.200)#12,673
14.672184.6%4.5%(+0.100)#2474.9%(-0.300)#13,046
15.672193.8%4.5%(-0.700)#3014.9%(-1.10)#16,114
16.672263.7%4.5%(-0.800)#3144.9%(-1.20)#16,458
17.672103.7%4.5%(-0.800)#3154.9%(-1.20)#16,526
18.672042.6%4.5%(-1.90)#4054.9%(-2.30)#21,144
19.672352.3%4.5%(-2.20)#4344.9%(-2.60)#22,512
20.672092.1%4.5%(-2.40)#4564.9%(-2.80)#23,304
21.672301.9%4.5%(-2.60)#4804.9%(-3.00)#24,071
22.672050.90%4.5%(-3.60)#5644.9%(-4.00)#27,035
23.672150.50%4.5%(-4.00)#5824.9%(-4.40)#27,876

Common Questions

What are the Top 10 Zip Codes with the Highest Percentage of Households with Income Below $10,000 in Wichita, KS?
Top 10 Zip Codes with the Highest Percentage of Households with Income Below $10,000 in Wichita, KS are:
#1
67.6%
#2
17.8%
#3
13.0%
#4
8.1%
#5
7.7%
#6
7.5%
#7
6.8%
#8
6.3%
#9
5.9%
#10
5.8%
What zip code has the Highest Percentage of Households with Income Below $10,000 in Wichita, KS?
67232 has the Highest Percentage of Households with Income Below $10,000 in Wichita, KS with 67.6%.
What is the Percentage of Households with Income Below $10,000 in Wichita, KS?
Percentage of Households with Income Below $10,000 in Wichita is 5.4%.
What is the Percentage of Households with Income Below $10,000 in Kansas?
Percentage of Households with Income Below $10,000 in Kansas is 4.5%.
What is the Percentage of Households with Income Below $10,000 in the United States?
Percentage of Households with Income Below $10,000 in the United States is 4.9%.