Zip Codes with the Highest Percentage of Population with a Degree in Literature and Languages in Wichita, KS

RELATED REPORTS & OPTIONS

Literature and Languages
Population
Families and Households
Female Fertility
Female Fertility (Unmarried)
Race (Community Size)
Race (Percentage)
Ancestry (Community Size)
AfricanAlaska NativeAmericanApacheArabArapahoArgentineanArmenianAustralianAustrianBangladeshiBarbadianBelgianBhutaneseBlackfeetBolivianBrazilianBritishBulgarianBurmeseCajunCanadianCelticCentral AmericanCentral American IndianCherokeeCheyenneChickasawChileanChippewaChoctawColombianComancheCosta RicanCreekCroatianCubanCzechCzechoslovakianDanishDelawareDominicanDutchDutch West IndianEastern EuropeanEcuadorianEgyptianEnglishEthiopianEuropeanFilipinoFinnishFrenchFrench American IndianFrench CanadianGermanGerman RussianGhanaianGreekGuamanian / ChamorroGuatemalanHaitianHonduranHungarianIcelanderIndian (Asian)IndonesianInupiatIranianIrishIroquoisItalianJamaicanJapaneseJordanianKenyanKiowaKoreanLaotianLebaneseLithuanianLuxembourgerMalaysianMexicanMexican American IndianMongolianMoroccanNative HawaiianNavajoNicaraguanNigerianNorthern EuropeanNorwegianOsageOttawaPakistaniPalestinianPanamanianParaguayanPennsylvania GermanPeruvianPimaPolishPortuguesePotawatomiPuebloPuerto RicanRomanianRussianSalvadoranSamoanScandinavianScotch-IrishScottishSeminoleSiouxSlavicSlovakSloveneSouth AfricanSouth AmericanSpaniardSpanishSpanish AmericanSpanish American IndianSri LankanSubsaharan AfricanSwedishSwissSyrianThaiTrinidadian and TobagonianTurkishUgandanUkrainianVenezuelanWelshWest IndianYugoslavian
Ancestry (Percentage)
AfricanAlaska NativeAmericanApacheArabArapahoArgentineanArmenianAustralianAustrianBangladeshiBarbadianBelgianBhutaneseBlackfeetBolivianBrazilianBritishBulgarianBurmeseCajunCanadianCelticCentral AmericanCentral American IndianCherokeeCheyenneChickasawChileanChippewaChoctawColombianComancheCosta RicanCreekCroatianCubanCzechCzechoslovakianDanishDelawareDominicanDutchDutch West IndianEastern EuropeanEcuadorianEgyptianEnglishEthiopianEuropeanFilipinoFinnishFrenchFrench American IndianFrench CanadianGermanGerman RussianGhanaianGreekGuamanian / ChamorroGuatemalanHaitianHonduranHungarianIcelanderIndian (Asian)IndonesianInupiatIranianIrishIroquoisItalianJamaicanJapaneseJordanianKenyanKiowaKoreanLaotianLebaneseLithuanianLuxembourgerMalaysianMexicanMexican American IndianMongolianMoroccanNative HawaiianNavajoNicaraguanNigerianNorthern EuropeanNorwegianOsageOttawaPakistaniPalestinianPanamanianParaguayanPennsylvania GermanPeruvianPimaPolishPortuguesePotawatomiPuebloPuerto RicanRomanianRussianSalvadoranSamoanScandinavianScotch-IrishScottishSeminoleSiouxSlavicSlovakSloveneSouth AfricanSouth AmericanSpaniardSpanishSpanish AmericanSpanish American IndianSri LankanSubsaharan AfricanSwedishSwissSyrianThaiTrinidadian and TobagonianTurkishUgandanUkrainianVenezuelanWelshWest IndianYugoslavian
Immigrant Origin (Total)
Immigrant Origin (Percentage)
Income
Income (Families)
Income (Households)
Poverty
Poverty (Families)
Unemployment
Employment Occupations
Employment Industries
Employer Class
Commute Time
Commute Means
School Enrollment
Education by Degree Field
Occupancy
Finances
Physical Characteristics
Wichita
Compare Zip Codes
Comparison Subject

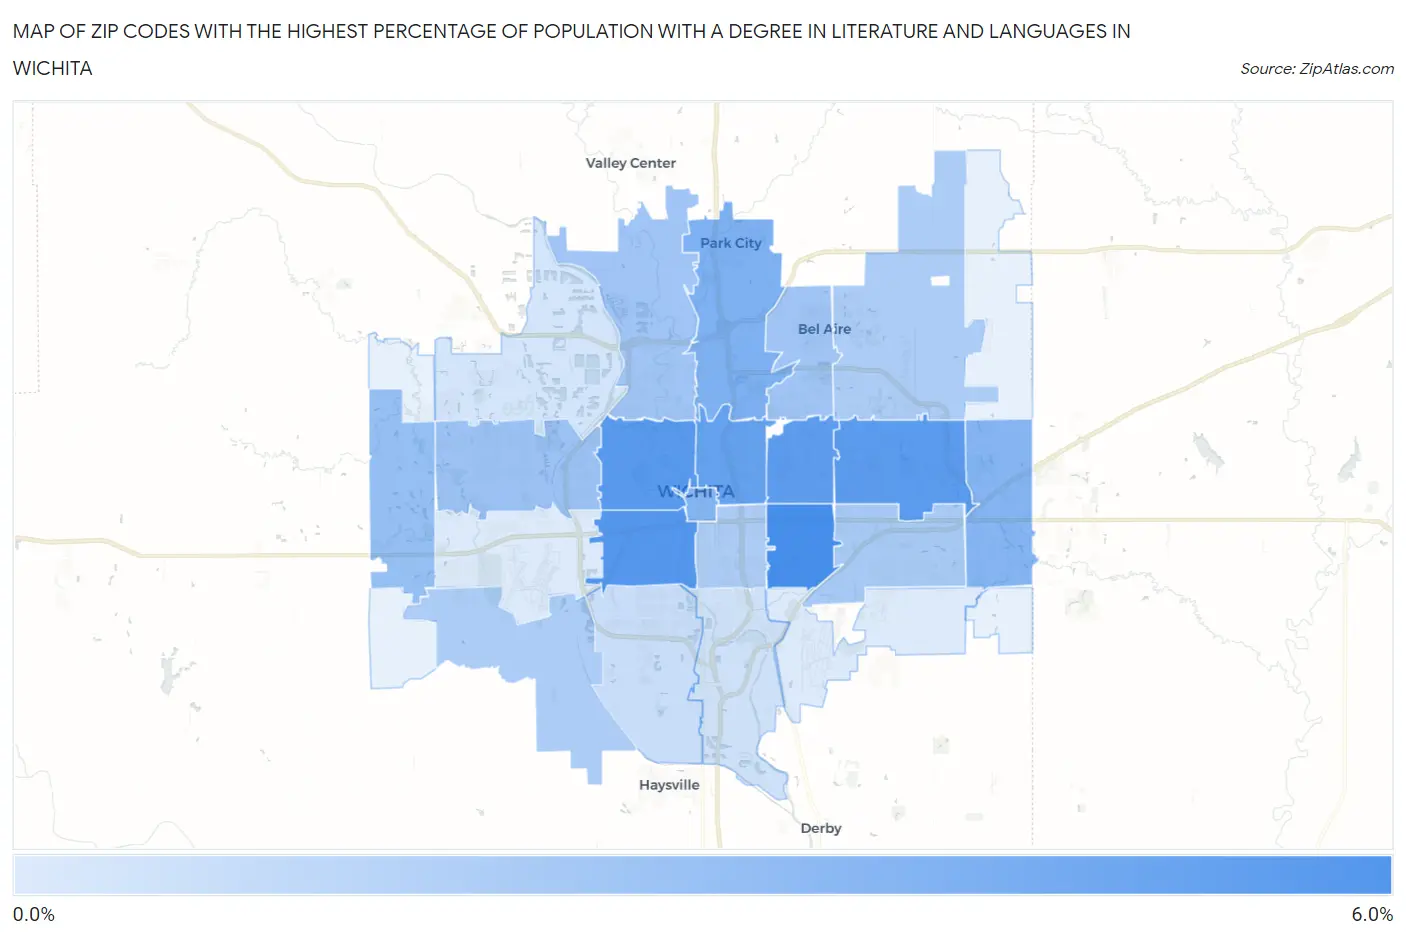
Map of Zip Codes with the Highest Percentage of Population with a Degree in Literature and Languages in Wichita

0.0%
6.0%
Zip Codes with the Highest Percentage of Population with a Degree in Literature and Languages in Wichita Map

Zip Codes with the Highest Percentage of Population with a Degree in Literature and Languages in Wichita, KS

Zip Code % Graduates vs State vs National
1.672185.1%3.3%(+1.83)#804.4%(+0.690)#7,123
2.672134.6%3.3%(+1.37)#914.4%(+0.238)#8,303
3.672034.6%3.3%(+1.28)#974.4%(+0.144)#8,563
4.672064.5%3.3%(+1.19)#1024.4%(+0.055)#8,809
5.672084.4%3.3%(+1.09)#1074.4%(-0.043)#9,097
6.672144.2%3.3%(+0.883)#1224.4%(-0.253)#9,751
7.672193.4%3.3%(+0.085)#1614.4%(-1.05)#12,310
8.672023.2%3.3%(-0.048)#1684.4%(-1.18)#12,811
9.672303.1%3.3%(-0.146)#1744.4%(-1.28)#13,122
10.672352.6%3.3%(-0.653)#1984.4%(-1.79)#14,877
11.672122.4%3.3%(-0.855)#2064.4%(-1.99)#15,609
12.672042.3%3.3%(-0.982)#2144.4%(-2.12)#16,073
13.672202.3%3.3%(-0.987)#2154.4%(-2.12)#16,095
14.672072.1%3.3%(-1.21)#2304.4%(-2.35)#16,866
15.672151.9%3.3%(-1.34)#2384.4%(-2.47)#17,297
16.672111.9%3.3%(-1.35)#2394.4%(-2.49)#17,344
17.672261.9%3.3%(-1.35)#2404.4%(-2.49)#17,345
18.672171.1%3.3%(-2.20)#3104.4%(-3.33)#19,931
19.672160.85%3.3%(-2.42)#3294.4%(-3.55)#20,472
20.672050.73%3.3%(-2.54)#3394.4%(-3.68)#20,772
21.672100.45%3.3%(-2.82)#3634.4%(-3.96)#21,325
22.672090.42%3.3%(-2.85)#3644.4%(-3.99)#21,390

Common Questions

What are the Top 10 Zip Codes with the Highest Percentage of Population with a Degree in Literature and Languages in Wichita, KS?
Top 10 Zip Codes with the Highest Percentage of Population with a Degree in Literature and Languages in Wichita, KS are:
#1
5.1%
#2
4.6%
#3
4.6%
#4
4.5%
#5
4.4%
#6
4.2%
#7
3.4%
#8
3.2%
#9
3.1%
#10
2.6%
What zip code has the Highest Percentage of Population with a Degree in Literature and Languages in Wichita, KS?
67218 has the Highest Percentage of Population with a Degree in Literature and Languages in Wichita, KS with 5.1%.
What is the Percentage of Population with a Degree in Literature and Languages in Wichita, KS?
Percentage of Population with a Degree in Literature and Languages in Wichita is 2.8%.
What is the Percentage of Population with a Degree in Literature and Languages in Kansas?
Percentage of Population with a Degree in Literature and Languages in Kansas is 3.3%.
What is the Percentage of Population with a Degree in Literature and Languages in the United States?
Percentage of Population with a Degree in Literature and Languages in the United States is 4.4%.