Zip Codes with the Highest Percentage of Households with Income Below $10,000 in Lawrence, KS
RELATED REPORTS & OPTIONS
Household Income | $0-10k
Lawrence
Compare Zip Codes
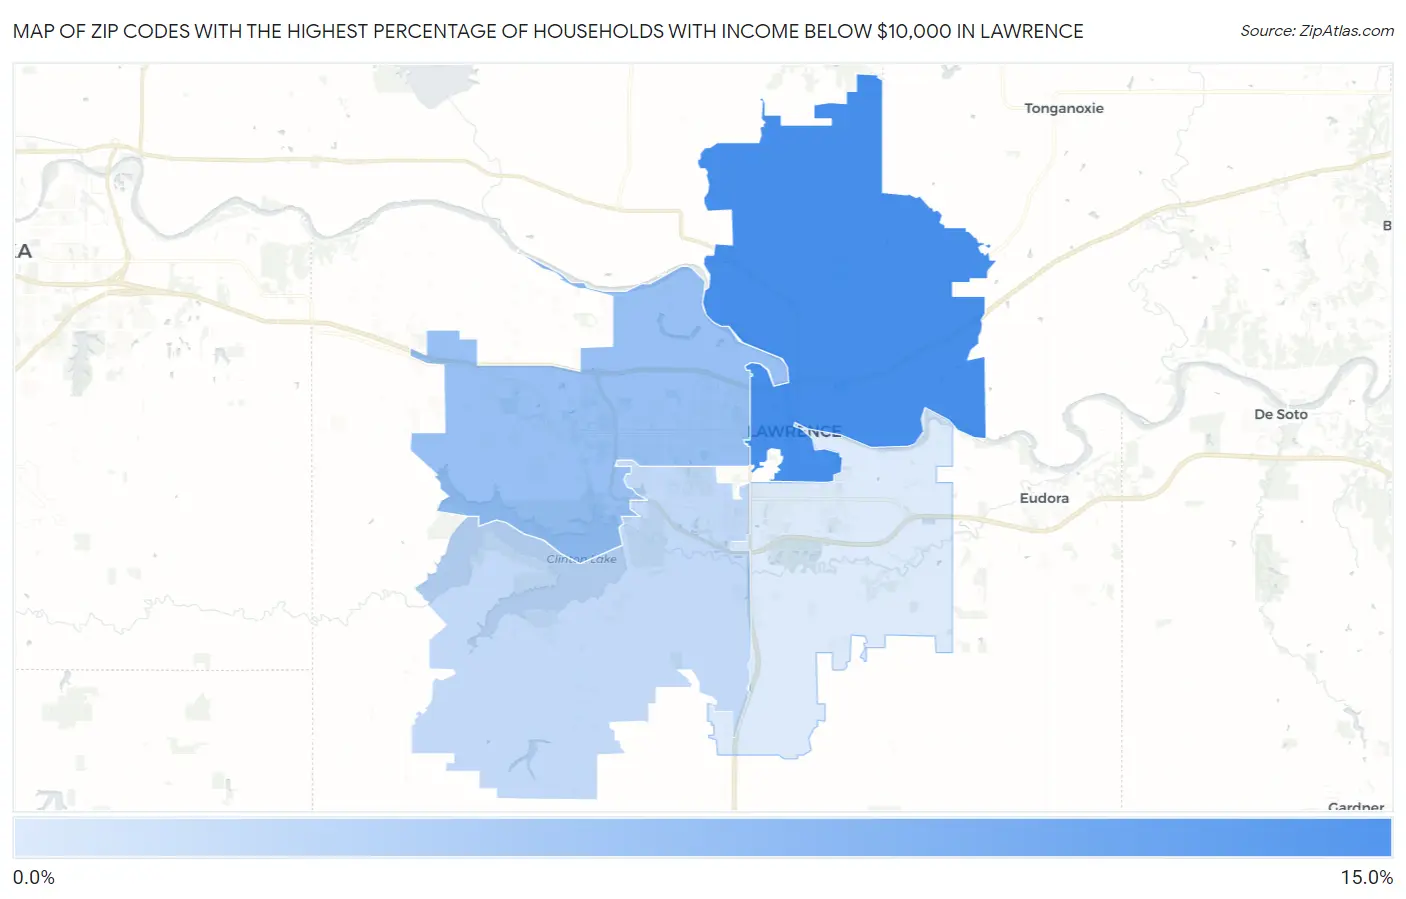
Map of Zip Codes with the Highest Percentage of Households with Income Below $10,000 in Lawrence
4.9%
11.5%
Zip Codes with the Highest Percentage of Households with Income Below $10,000 in Lawrence, KS
| Zip Code | Households with Income < $10k | vs State | vs National | |
| 1. | 66044 | 11.5% | 4.5%(+7.00)#37 | 4.9%(+6.60)#2,674 |
| 2. | 66049 | 7.9% | 4.5%(+3.40)#83 | 4.9%(+3.00)#5,678 |
| 3. | 66047 | 6.1% | 4.5%(+1.60)#147 | 4.9%(+1.20)#8,778 |
| 4. | 66046 | 4.9% | 4.5%(+0.400)#220 | 4.9%(=0.000)#12,050 |
1
Common Questions
What are the Top 3 Zip Codes with the Highest Percentage of Households with Income Below $10,000 in Lawrence, KS?
Top 3 Zip Codes with the Highest Percentage of Households with Income Below $10,000 in Lawrence, KS are:
What zip code has the Highest Percentage of Households with Income Below $10,000 in Lawrence, KS?
66044 has the Highest Percentage of Households with Income Below $10,000 in Lawrence, KS with 11.5%.
What is the Percentage of Households with Income Below $10,000 in Lawrence, KS?
Percentage of Households with Income Below $10,000 in Lawrence is 8.3%.
What is the Percentage of Households with Income Below $10,000 in Kansas?
Percentage of Households with Income Below $10,000 in Kansas is 4.5%.
What is the Percentage of Households with Income Below $10,000 in the United States?
Percentage of Households with Income Below $10,000 in the United States is 4.9%.