Zip Codes with the Highest Percentage of Population Employed in Arts, Media & Entertainment in Wichita, KS
RELATED REPORTS & OPTIONS
Arts, Media & Entertainment
Wichita
Compare Zip Codes
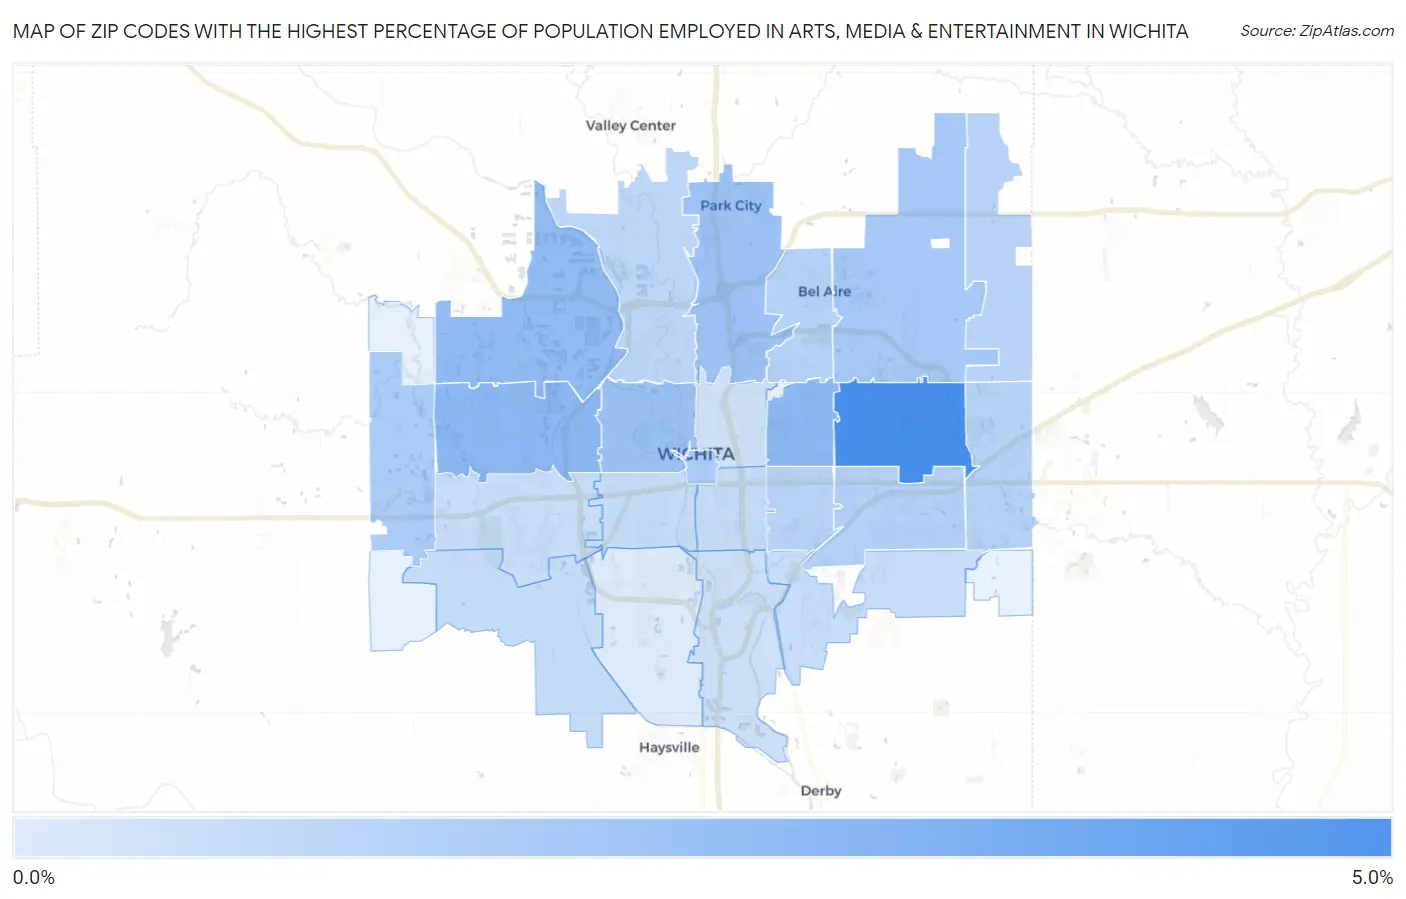
Map of Zip Codes with the Highest Percentage of Population Employed in Arts, Media & Entertainment in Wichita
0.35%
4.5%
Zip Codes with the Highest Percentage of Population Employed in Arts, Media & Entertainment in Wichita, KS
| Zip Code | % Employed | vs State | vs National | |
| 1. | 67206 | 4.5% | 1.6%(+2.95)#22 | 2.1%(+2.46)#1,834 |
| 2. | 67208 | 2.6% | 1.6%(+1.02)#70 | 2.1%(+0.533)#5,255 |
| 3. | 67212 | 2.6% | 1.6%(+0.980)#72 | 2.1%(+0.491)#5,395 |
| 4. | 67205 | 2.5% | 1.6%(+0.890)#77 | 2.1%(+0.401)#5,674 |
| 5. | 67219 | 2.2% | 1.6%(+0.607)#92 | 2.1%(+0.118)#6,919 |
| 6. | 67203 | 2.2% | 1.6%(+0.579)#94 | 2.1%(+0.090)#7,045 |
| 7. | 67226 | 1.9% | 1.6%(+0.288)#111 | 2.1%(-0.201)#8,619 |
| 8. | 67235 | 1.8% | 1.6%(+0.186)#118 | 2.1%(-0.303)#9,222 |
| 9. | 67202 | 1.7% | 1.6%(+0.155)#122 | 2.1%(-0.334)#9,424 |
| 10. | 67207 | 1.5% | 1.6%(-0.057)#142 | 2.1%(-0.546)#10,885 |
| 11. | 67230 | 1.4% | 1.6%(-0.141)#150 | 2.1%(-0.630)#11,490 |
| 12. | 67220 | 1.4% | 1.6%(-0.148)#151 | 2.1%(-0.637)#11,536 |
| 13. | 67228 | 1.4% | 1.6%(-0.203)#164 | 2.1%(-0.692)#11,923 |
| 14. | 67218 | 1.4% | 1.6%(-0.208)#165 | 2.1%(-0.697)#11,970 |
| 15. | 67204 | 1.2% | 1.6%(-0.332)#189 | 2.1%(-0.821)#12,937 |
| 16. | 67211 | 0.98% | 1.6%(-0.591)#227 | 2.1%(-1.08)#14,969 |
| 17. | 67213 | 0.97% | 1.6%(-0.604)#229 | 2.1%(-1.09)#15,078 |
| 18. | 67215 | 0.95% | 1.6%(-0.619)#232 | 2.1%(-1.11)#15,199 |
| 19. | 67210 | 0.92% | 1.6%(-0.649)#239 | 2.1%(-1.14)#15,443 |
| 20. | 67209 | 0.91% | 1.6%(-0.658)#240 | 2.1%(-1.15)#15,529 |
| 21. | 67216 | 0.81% | 1.6%(-0.763)#262 | 2.1%(-1.25)#16,352 |
| 22. | 67214 | 0.72% | 1.6%(-0.850)#272 | 2.1%(-1.34)#17,049 |
| 23. | 67217 | 0.35% | 1.6%(-1.23)#337 | 2.1%(-1.71)#20,019 |
1
Common Questions
What are the Top 10 Zip Codes with the Highest Percentage of Population Employed in Arts, Media & Entertainment in Wichita, KS?
Top 10 Zip Codes with the Highest Percentage of Population Employed in Arts, Media & Entertainment in Wichita, KS are:
What zip code has the Highest Percentage of Population Employed in Arts, Media & Entertainment in Wichita, KS?
67206 has the Highest Percentage of Population Employed in Arts, Media & Entertainment in Wichita, KS with 4.5%.
What is the Percentage of Population Employed in Arts, Media & Entertainment in Wichita, KS?
Percentage of Population Employed in Arts, Media & Entertainment in Wichita is 1.7%.
What is the Percentage of Population Employed in Arts, Media & Entertainment in Kansas?
Percentage of Population Employed in Arts, Media & Entertainment in Kansas is 1.6%.
What is the Percentage of Population Employed in Arts, Media & Entertainment in the United States?
Percentage of Population Employed in Arts, Media & Entertainment in the United States is 2.1%.