Zip Codes with the Highest Percentage of Population Employed in Life, Physical & Social Science in Wichita, KS

RELATED REPORTS & OPTIONS

Life, Physical & Social Science
Population
Families and Households
Female Fertility
Female Fertility (Unmarried)
Race (Community Size)
Race (Percentage)
Ancestry (Community Size)
AfricanAlaska NativeAmericanApacheArabArapahoArgentineanArmenianAustralianAustrianBangladeshiBarbadianBelgianBhutaneseBlackfeetBolivianBrazilianBritishBulgarianBurmeseCajunCanadianCelticCentral AmericanCentral American IndianCherokeeCheyenneChickasawChileanChippewaChoctawColombianComancheCosta RicanCreekCroatianCubanCzechCzechoslovakianDanishDelawareDominicanDutchDutch West IndianEastern EuropeanEcuadorianEgyptianEnglishEthiopianEuropeanFilipinoFinnishFrenchFrench American IndianFrench CanadianGermanGerman RussianGhanaianGreekGuamanian / ChamorroGuatemalanHaitianHonduranHungarianIcelanderIndian (Asian)IndonesianInupiatIranianIrishIroquoisItalianJamaicanJapaneseJordanianKenyanKiowaKoreanLaotianLebaneseLithuanianLuxembourgerMalaysianMexicanMexican American IndianMongolianMoroccanNative HawaiianNavajoNicaraguanNigerianNorthern EuropeanNorwegianOsageOttawaPakistaniPalestinianPanamanianParaguayanPennsylvania GermanPeruvianPimaPolishPortuguesePotawatomiPuebloPuerto RicanRomanianRussianSalvadoranSamoanScandinavianScotch-IrishScottishSeminoleSiouxSlavicSlovakSloveneSouth AfricanSouth AmericanSpaniardSpanishSpanish AmericanSpanish American IndianSri LankanSubsaharan AfricanSwedishSwissSyrianThaiTrinidadian and TobagonianTurkishUgandanUkrainianVenezuelanWelshWest IndianYugoslavian
Ancestry (Percentage)
AfricanAlaska NativeAmericanApacheArabArapahoArgentineanArmenianAustralianAustrianBangladeshiBarbadianBelgianBhutaneseBlackfeetBolivianBrazilianBritishBulgarianBurmeseCajunCanadianCelticCentral AmericanCentral American IndianCherokeeCheyenneChickasawChileanChippewaChoctawColombianComancheCosta RicanCreekCroatianCubanCzechCzechoslovakianDanishDelawareDominicanDutchDutch West IndianEastern EuropeanEcuadorianEgyptianEnglishEthiopianEuropeanFilipinoFinnishFrenchFrench American IndianFrench CanadianGermanGerman RussianGhanaianGreekGuamanian / ChamorroGuatemalanHaitianHonduranHungarianIcelanderIndian (Asian)IndonesianInupiatIranianIrishIroquoisItalianJamaicanJapaneseJordanianKenyanKiowaKoreanLaotianLebaneseLithuanianLuxembourgerMalaysianMexicanMexican American IndianMongolianMoroccanNative HawaiianNavajoNicaraguanNigerianNorthern EuropeanNorwegianOsageOttawaPakistaniPalestinianPanamanianParaguayanPennsylvania GermanPeruvianPimaPolishPortuguesePotawatomiPuebloPuerto RicanRomanianRussianSalvadoranSamoanScandinavianScotch-IrishScottishSeminoleSiouxSlavicSlovakSloveneSouth AfricanSouth AmericanSpaniardSpanishSpanish AmericanSpanish American IndianSri LankanSubsaharan AfricanSwedishSwissSyrianThaiTrinidadian and TobagonianTurkishUgandanUkrainianVenezuelanWelshWest IndianYugoslavian
Immigrant Origin (Total)
Immigrant Origin (Percentage)
Income
Income (Families)
Income (Households)
Poverty
Poverty (Families)
Unemployment
Employment Occupations
Employment Industries
Employer Class
Commute Time
Commute Means
School Enrollment
Education by Degree Field
Occupancy
Finances
Physical Characteristics
Wichita
Compare Zip Codes
Comparison Subject

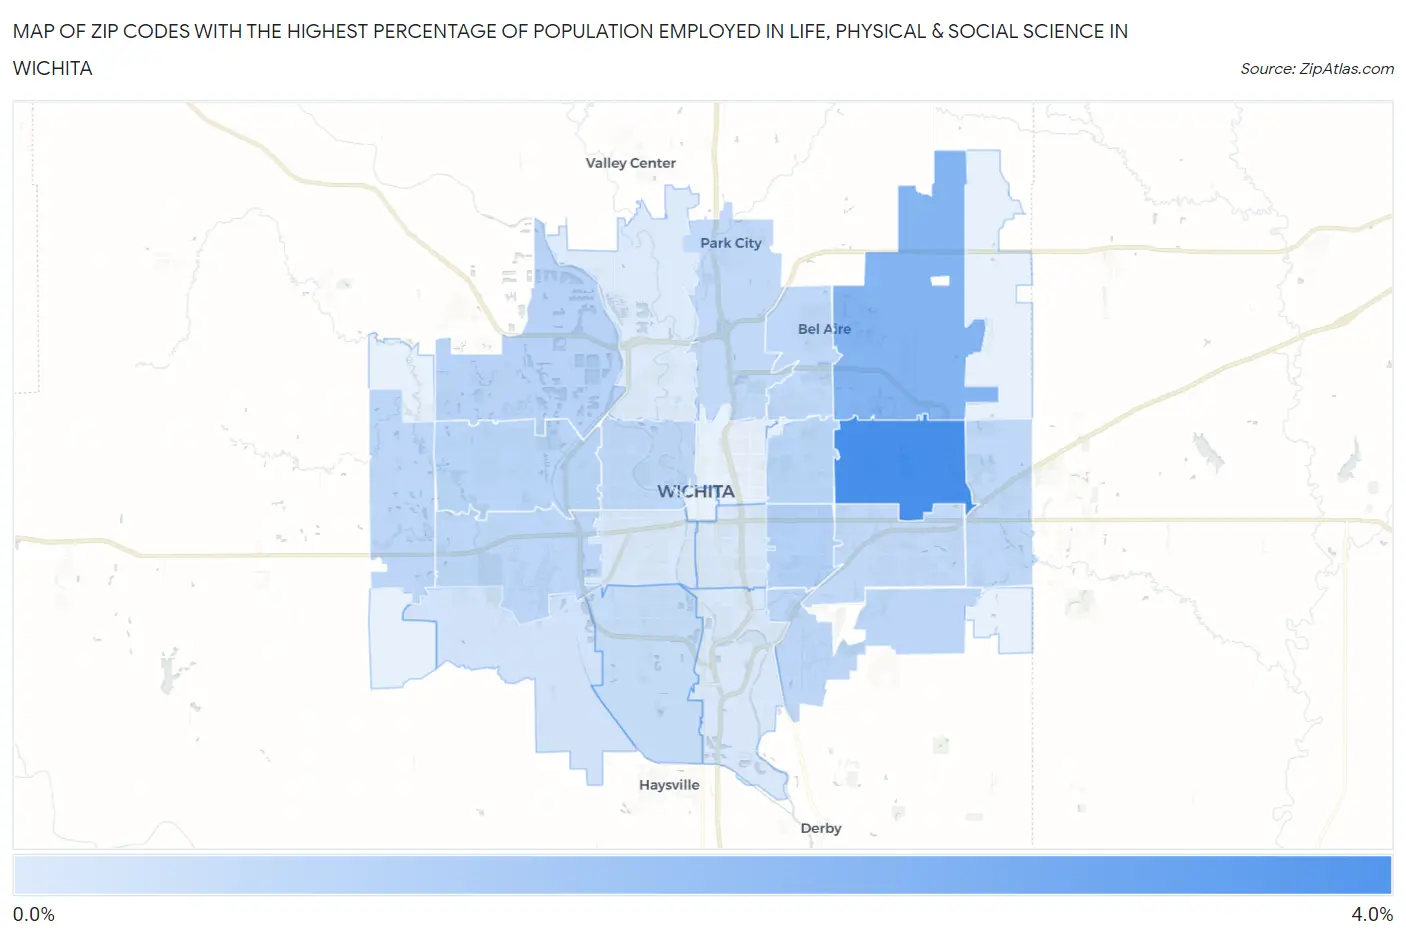
Map of Zip Codes with the Highest Percentage of Population Employed in Life, Physical & Social Science in Wichita

0.0%
4.0%
Zip Codes with the Highest Percentage of Population Employed in Life, Physical & Social Science in Wichita Map

Zip Codes with the Highest Percentage of Population Employed in Life, Physical & Social Science in Wichita, KS

Zip Code % Employed vs State vs National
1.672063.2%0.94%(+2.26)#271.1%(+2.11)#1,669
2.672262.0%0.94%(+1.02)#621.1%(+0.866)#3,807
3.672180.95%0.94%(+0.010)#1551.1%(-0.141)#9,490
4.672050.82%0.94%(-0.120)#1701.1%(-0.270)#10,795
5.672080.81%0.94%(-0.134)#1741.1%(-0.284)#10,926
6.672120.79%0.94%(-0.154)#1771.1%(-0.304)#11,133
7.672090.76%0.94%(-0.184)#1841.1%(-0.335)#11,439
8.672100.76%0.94%(-0.185)#1851.1%(-0.336)#11,450
9.672350.72%0.94%(-0.216)#1901.1%(-0.366)#11,768
10.672300.71%0.94%(-0.234)#1951.1%(-0.384)#11,948
11.672030.68%0.94%(-0.258)#2011.1%(-0.409)#12,267
12.672200.68%0.94%(-0.260)#2021.1%(-0.410)#12,288
13.672190.65%0.94%(-0.292)#2071.1%(-0.443)#12,674
14.672070.64%0.94%(-0.301)#2111.1%(-0.452)#12,796
15.672170.54%0.94%(-0.404)#2371.1%(-0.555)#14,072
16.672150.31%0.94%(-0.633)#2861.1%(-0.784)#16,972
17.672110.19%0.94%(-0.747)#3071.1%(-0.897)#18,262
18.672130.18%0.94%(-0.765)#3141.1%(-0.916)#18,447
19.672160.17%0.94%(-0.774)#3161.1%(-0.925)#18,536
20.672040.080%0.94%(-0.860)#3231.1%(-1.01)#19,189

Common Questions

What are the Top 10 Zip Codes with the Highest Percentage of Population Employed in Life, Physical & Social Science in Wichita, KS?
Top 10 Zip Codes with the Highest Percentage of Population Employed in Life, Physical & Social Science in Wichita, KS are:
#1
3.2%
#2
2.0%
#3
0.95%
#4
0.82%
#5
0.81%
#6
0.79%
#7
0.76%
#8
0.76%
#9
0.72%
#10
0.71%
What zip code has the Highest Percentage of Population Employed in Life, Physical & Social Science in Wichita, KS?
67206 has the Highest Percentage of Population Employed in Life, Physical & Social Science in Wichita, KS with 3.2%.
What is the Percentage of Population Employed in Life, Physical & Social Science in Wichita, KS?
Percentage of Population Employed in Life, Physical & Social Science in Wichita is 0.77%.
What is the Percentage of Population Employed in Life, Physical & Social Science in Kansas?
Percentage of Population Employed in Life, Physical & Social Science in Kansas is 0.94%.
What is the Percentage of Population Employed in Life, Physical & Social Science in the United States?
Percentage of Population Employed in Life, Physical & Social Science in the United States is 1.1%.