Zip Codes with the Highest Percentage of Population Employed in Community & Social Service in Wichita, KS
RELATED REPORTS & OPTIONS
Community & Social Service
Wichita
Compare Zip Codes
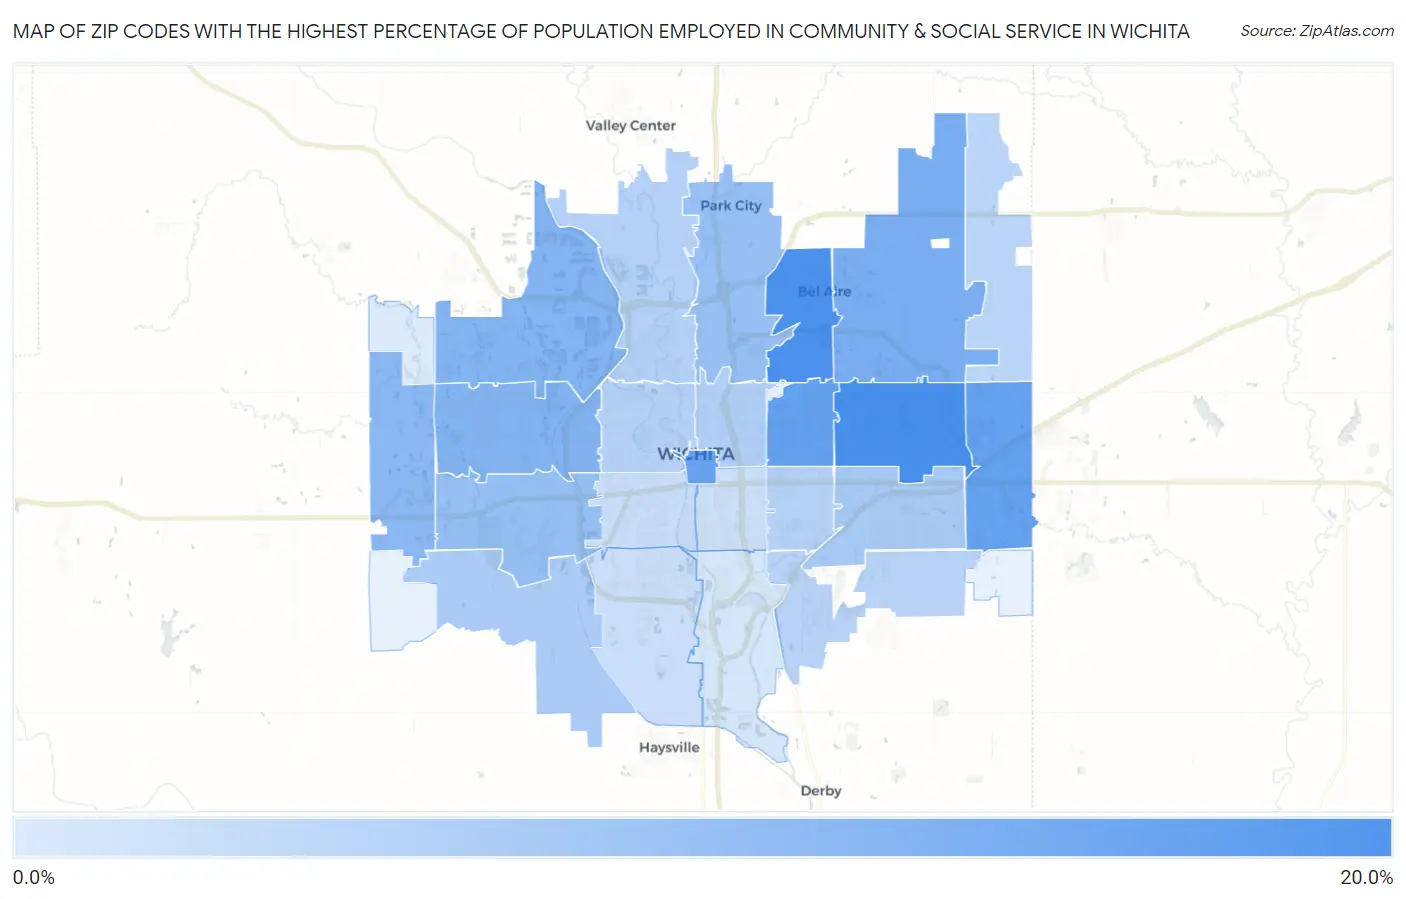
Map of Zip Codes with the Highest Percentage of Population Employed in Community & Social Service in Wichita
5.4%
18.3%
Zip Codes with the Highest Percentage of Population Employed in Community & Social Service in Wichita, KS
| Zip Code | % Employed | vs State | vs National | |
| 1. | 67206 | 18.3% | 11.3%(+7.05)#50 | 11.2%(+7.12)#2,660 |
| 2. | 67220 | 18.0% | 11.3%(+6.70)#58 | 11.2%(+6.77)#2,821 |
| 3. | 67208 | 15.7% | 11.3%(+4.46)#90 | 11.2%(+4.53)#4,296 |
| 4. | 67230 | 15.6% | 11.3%(+4.36)#93 | 11.2%(+4.43)#4,380 |
| 5. | 67202 | 15.4% | 11.3%(+4.09)#100 | 11.2%(+4.16)#4,638 |
| 6. | 67226 | 13.9% | 11.3%(+2.62)#137 | 11.2%(+2.69)#6,208 |
| 7. | 67205 | 13.0% | 11.3%(+1.74)#166 | 11.2%(+1.81)#7,511 |
| 8. | 67212 | 12.9% | 11.3%(+1.62)#169 | 11.2%(+1.69)#7,728 |
| 9. | 67235 | 12.4% | 11.3%(+1.07)#190 | 11.2%(+1.14)#8,677 |
| 10. | 67209 | 11.5% | 11.3%(+0.215)#232 | 11.2%(+0.285)#10,462 |
| 11. | 67219 | 11.2% | 11.3%(-0.102)#252 | 11.2%(-0.031)#11,178 |
| 12. | 67207 | 9.8% | 11.3%(-1.44)#328 | 11.2%(-1.37)#14,527 |
| 13. | 67215 | 9.7% | 11.3%(-1.60)#338 | 11.2%(-1.53)#14,900 |
| 14. | 67214 | 9.0% | 11.3%(-2.32)#378 | 11.2%(-2.25)#16,908 |
| 15. | 67204 | 8.8% | 11.3%(-2.50)#385 | 11.2%(-2.43)#17,399 |
| 16. | 67203 | 8.7% | 11.3%(-2.62)#393 | 11.2%(-2.55)#17,726 |
| 17. | 67218 | 8.6% | 11.3%(-2.68)#396 | 11.2%(-2.61)#17,881 |
| 18. | 67210 | 8.5% | 11.3%(-2.75)#400 | 11.2%(-2.68)#18,087 |
| 19. | 67228 | 8.4% | 11.3%(-2.93)#407 | 11.2%(-2.86)#18,601 |
| 20. | 67213 | 7.1% | 11.3%(-4.22)#474 | 11.2%(-4.15)#21,983 |
| 21. | 67217 | 6.9% | 11.3%(-4.36)#485 | 11.2%(-4.29)#22,321 |
| 22. | 67211 | 6.7% | 11.3%(-4.61)#490 | 11.2%(-4.54)#22,874 |
| 23. | 67216 | 6.1% | 11.3%(-5.23)#515 | 11.2%(-5.16)#24,254 |
| 24. | 67223 | 5.4% | 11.3%(-5.84)#542 | 11.2%(-5.77)#25,439 |
1
Common Questions
What are the Top 10 Zip Codes with the Highest Percentage of Population Employed in Community & Social Service in Wichita, KS?
Top 10 Zip Codes with the Highest Percentage of Population Employed in Community & Social Service in Wichita, KS are:
What zip code has the Highest Percentage of Population Employed in Community & Social Service in Wichita, KS?
67206 has the Highest Percentage of Population Employed in Community & Social Service in Wichita, KS with 18.3%.
What is the Percentage of Population Employed in Community & Social Service in Wichita, KS?
Percentage of Population Employed in Community & Social Service in Wichita is 10.8%.
What is the Percentage of Population Employed in Community & Social Service in Kansas?
Percentage of Population Employed in Community & Social Service in Kansas is 11.3%.
What is the Percentage of Population Employed in Community & Social Service in the United States?
Percentage of Population Employed in Community & Social Service in the United States is 11.2%.