Zip Codes with the Highest Percentage of Population Employed in Administrative & Support Services in Wichita, KS
RELATED REPORTS & OPTIONS
Administrative & Support Services
Wichita
Compare Zip Codes
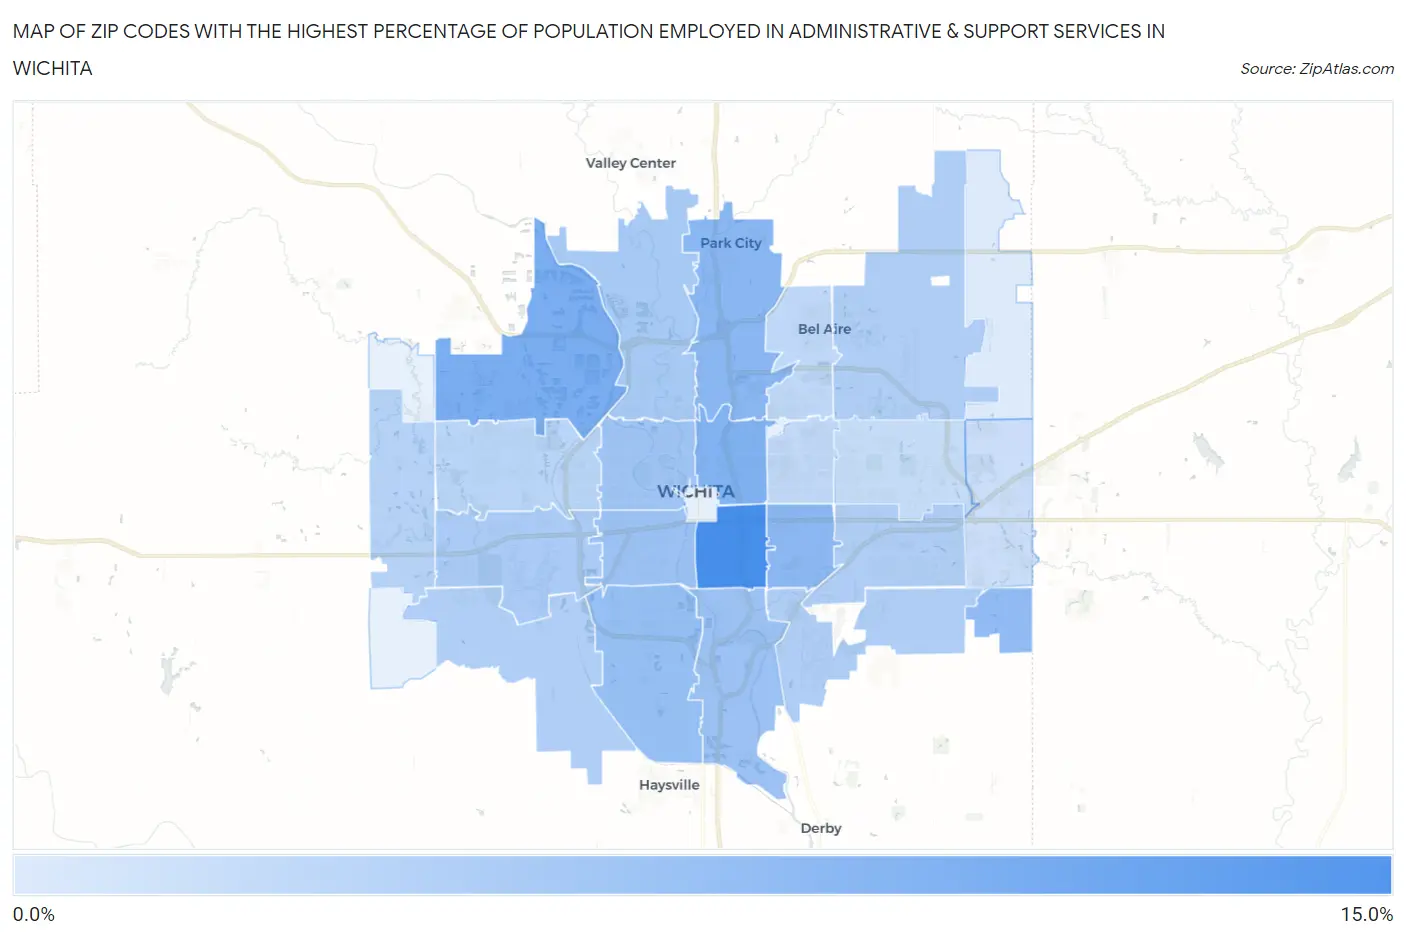
Map of Zip Codes with the Highest Percentage of Population Employed in Administrative & Support Services in Wichita
0.48%
10.3%
Zip Codes with the Highest Percentage of Population Employed in Administrative & Support Services in Wichita, KS
| Zip Code | % Employed | vs State | vs National | |
| 1. | 67211 | 10.3% | 3.2%(+7.11)#8 | 4.1%(+6.15)#1,200 |
| 2. | 67205 | 6.8% | 3.2%(+3.65)#35 | 4.1%(+2.69)#3,433 |
| 3. | 67214 | 6.5% | 3.2%(+3.28)#41 | 4.1%(+2.32)#3,964 |
| 4. | 67219 | 5.9% | 3.2%(+2.67)#53 | 4.1%(+1.70)#5,048 |
| 5. | 67218 | 5.7% | 3.2%(+2.48)#56 | 4.1%(+1.52)#5,425 |
| 6. | 67232 | 5.3% | 3.2%(+2.15)#67 | 4.1%(+1.18)#6,243 |
| 7. | 67217 | 5.1% | 3.2%(+1.89)#79 | 4.1%(+0.927)#6,910 |
| 8. | 67216 | 4.8% | 3.2%(+1.58)#86 | 4.1%(+0.613)#7,836 |
| 9. | 67213 | 4.6% | 3.2%(+1.37)#94 | 4.1%(+0.411)#8,506 |
| 10. | 67203 | 4.3% | 3.2%(+1.08)#104 | 4.1%(+0.119)#9,564 |
| 11. | 67204 | 3.9% | 3.2%(+0.703)#128 | 4.1%(-0.259)#11,156 |
| 12. | 67209 | 3.7% | 3.2%(+0.499)#145 | 4.1%(-0.464)#12,047 |
| 13. | 67226 | 3.4% | 3.2%(+0.250)#160 | 4.1%(-0.713)#13,275 |
| 14. | 67207 | 3.4% | 3.2%(+0.219)#163 | 4.1%(-0.743)#13,402 |
| 15. | 67210 | 3.4% | 3.2%(+0.169)#167 | 4.1%(-0.793)#13,660 |
| 16. | 67215 | 3.3% | 3.2%(+0.133)#173 | 4.1%(-0.830)#13,846 |
| 17. | 67235 | 3.0% | 3.2%(-0.155)#205 | 4.1%(-1.12)#15,308 |
| 18. | 67212 | 2.6% | 3.2%(-0.590)#250 | 4.1%(-1.55)#17,621 |
| 19. | 67220 | 2.4% | 3.2%(-0.768)#272 | 4.1%(-1.73)#18,549 |
| 20. | 67208 | 2.3% | 3.2%(-0.931)#290 | 4.1%(-1.89)#19,386 |
| 21. | 67206 | 1.9% | 3.2%(-1.28)#334 | 4.1%(-2.24)#21,045 |
| 22. | 67230 | 1.6% | 3.2%(-1.54)#355 | 4.1%(-2.51)#22,196 |
| 23. | 67228 | 0.48% | 3.2%(-2.71)#483 | 4.1%(-3.67)#25,905 |
1
Common Questions
What are the Top 10 Zip Codes with the Highest Percentage of Population Employed in Administrative & Support Services in Wichita, KS?
Top 10 Zip Codes with the Highest Percentage of Population Employed in Administrative & Support Services in Wichita, KS are:
What zip code has the Highest Percentage of Population Employed in Administrative & Support Services in Wichita, KS?
67211 has the Highest Percentage of Population Employed in Administrative & Support Services in Wichita, KS with 10.3%.
What is the Percentage of Population Employed in Administrative & Support Services in Wichita, KS?
Percentage of Population Employed in Administrative & Support Services in Wichita is 4.1%.
What is the Percentage of Population Employed in Administrative & Support Services in Kansas?
Percentage of Population Employed in Administrative & Support Services in Kansas is 3.2%.
What is the Percentage of Population Employed in Administrative & Support Services in the United States?
Percentage of Population Employed in Administrative & Support Services in the United States is 4.1%.