Zip Codes with the Highest Female Poverty Level in Wichita, KS

RELATED REPORTS & OPTIONS

Highest Poverty | Female
Population
Families and Households
Female Fertility
Female Fertility (Unmarried)
Race (Community Size)
Race (Percentage)
Ancestry (Community Size)
AfricanAlaska NativeAmericanApacheArabArapahoArgentineanArmenianAustralianAustrianBangladeshiBarbadianBelgianBhutaneseBlackfeetBolivianBrazilianBritishBulgarianBurmeseCajunCanadianCelticCentral AmericanCentral American IndianCherokeeCheyenneChickasawChileanChippewaChoctawColombianComancheCosta RicanCreekCroatianCubanCzechCzechoslovakianDanishDelawareDominicanDutchDutch West IndianEastern EuropeanEcuadorianEgyptianEnglishEthiopianEuropeanFilipinoFinnishFrenchFrench American IndianFrench CanadianGermanGerman RussianGhanaianGreekGuamanian / ChamorroGuatemalanHaitianHonduranHungarianIcelanderIndian (Asian)IndonesianInupiatIranianIrishIroquoisItalianJamaicanJapaneseJordanianKenyanKiowaKoreanLaotianLebaneseLithuanianLuxembourgerMalaysianMexicanMexican American IndianMongolianMoroccanNative HawaiianNavajoNicaraguanNigerianNorthern EuropeanNorwegianOsageOttawaPakistaniPalestinianPanamanianParaguayanPennsylvania GermanPeruvianPimaPolishPortuguesePotawatomiPuebloPuerto RicanRomanianRussianSalvadoranSamoanScandinavianScotch-IrishScottishSeminoleSiouxSlavicSlovakSloveneSouth AfricanSouth AmericanSpaniardSpanishSpanish AmericanSpanish American IndianSri LankanSubsaharan AfricanSwedishSwissSyrianThaiTrinidadian and TobagonianTurkishUgandanUkrainianVenezuelanWelshWest IndianYugoslavian
Ancestry (Percentage)
AfricanAlaska NativeAmericanApacheArabArapahoArgentineanArmenianAustralianAustrianBangladeshiBarbadianBelgianBhutaneseBlackfeetBolivianBrazilianBritishBulgarianBurmeseCajunCanadianCelticCentral AmericanCentral American IndianCherokeeCheyenneChickasawChileanChippewaChoctawColombianComancheCosta RicanCreekCroatianCubanCzechCzechoslovakianDanishDelawareDominicanDutchDutch West IndianEastern EuropeanEcuadorianEgyptianEnglishEthiopianEuropeanFilipinoFinnishFrenchFrench American IndianFrench CanadianGermanGerman RussianGhanaianGreekGuamanian / ChamorroGuatemalanHaitianHonduranHungarianIcelanderIndian (Asian)IndonesianInupiatIranianIrishIroquoisItalianJamaicanJapaneseJordanianKenyanKiowaKoreanLaotianLebaneseLithuanianLuxembourgerMalaysianMexicanMexican American IndianMongolianMoroccanNative HawaiianNavajoNicaraguanNigerianNorthern EuropeanNorwegianOsageOttawaPakistaniPalestinianPanamanianParaguayanPennsylvania GermanPeruvianPimaPolishPortuguesePotawatomiPuebloPuerto RicanRomanianRussianSalvadoranSamoanScandinavianScotch-IrishScottishSeminoleSiouxSlavicSlovakSloveneSouth AfricanSouth AmericanSpaniardSpanishSpanish AmericanSpanish American IndianSri LankanSubsaharan AfricanSwedishSwissSyrianThaiTrinidadian and TobagonianTurkishUgandanUkrainianVenezuelanWelshWest IndianYugoslavian
Immigrant Origin (Total)
Immigrant Origin (Percentage)
Income
Income (Families)
Income (Households)
Poverty
Poverty (Families)
Unemployment
Employment Occupations
Employment Industries
Employer Class
Commute Time
Commute Means
School Enrollment
Education by Degree Field
Occupancy
Finances
Physical Characteristics
Wichita
Compare Zip Codes
Comparison Subject

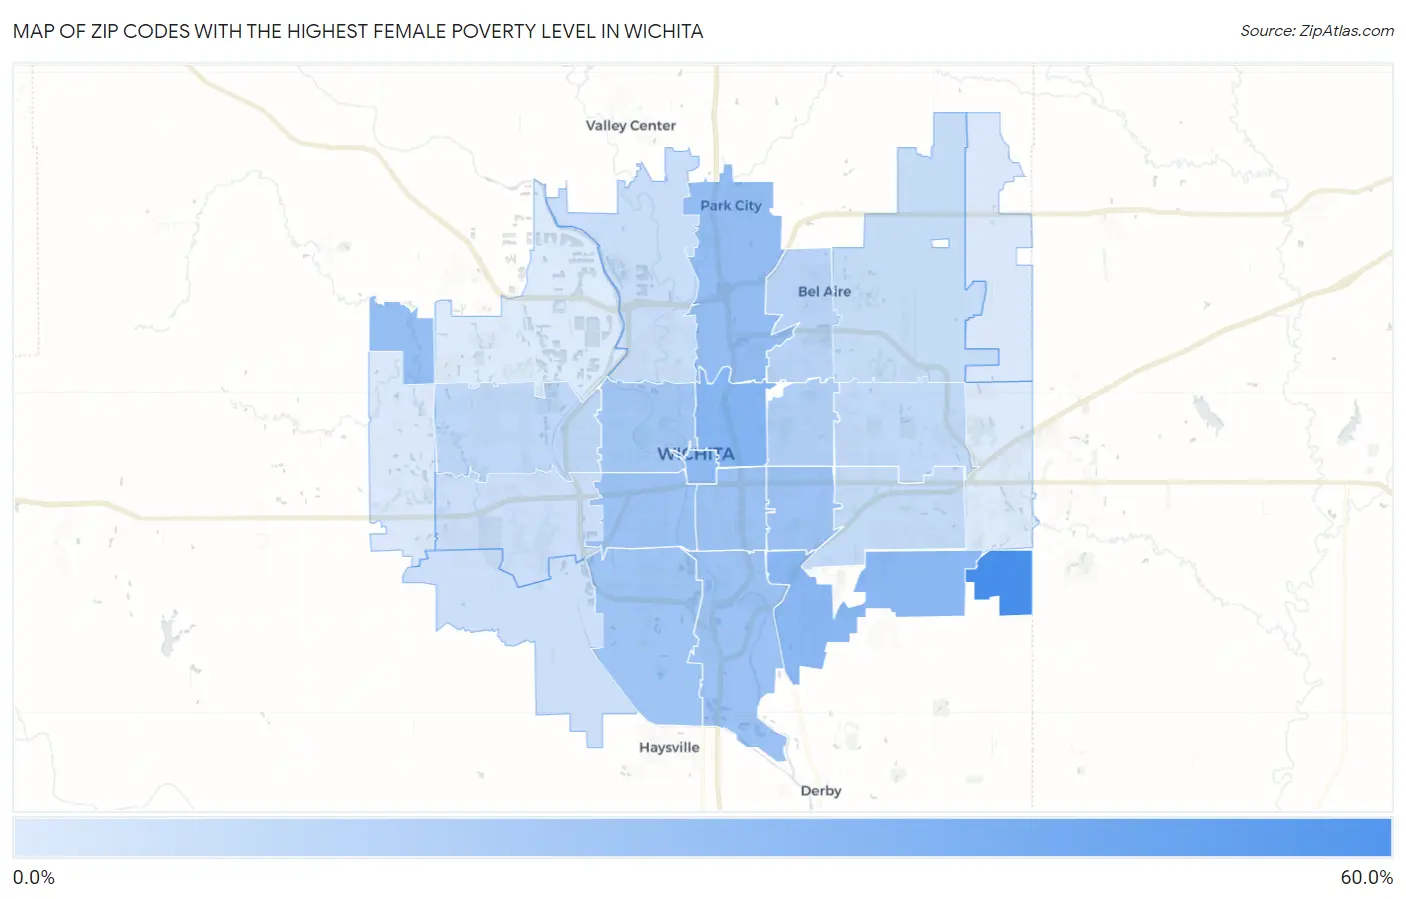
Map of Zip Codes with the Highest Female Poverty Level in Wichita

0.0%
60.0%
Zip Codes with the Highest Female Poverty Level in Wichita Map

Zip Codes with the Highest Female Poverty Level in Wichita, KS

Zip Code Female Poverty vs State vs National
1.6723259.7%12.8%(+46.9)#613.7%(+46.0)#392
2.6721432.3%12.8%(+19.5)#3513.7%(+18.6)#2,300
3.6721030.3%12.8%(+17.6)#4013.7%(+16.6)#2,725
4.6720229.1%12.8%(+16.3)#4813.7%(+15.4)#3,065
5.6721927.1%12.8%(+14.3)#6013.7%(+13.4)#3,674
6.6722326.4%12.8%(+13.7)#6313.7%(+12.7)#3,905
7.6721824.6%12.8%(+11.8)#7813.7%(+10.9)#4,663
8.6721124.4%12.8%(+11.6)#7913.7%(+10.7)#4,717
9.6721624.3%12.8%(+11.5)#8113.7%(+10.6)#4,753
10.6721323.4%12.8%(+10.7)#9213.7%(+9.74)#5,188
11.6721723.2%12.8%(+10.5)#9513.7%(+9.53)#5,294
12.6720321.0%12.8%(+8.20)#12313.7%(+7.27)#6,602
13.6720817.2%12.8%(+4.39)#17713.7%(+3.46)#9,600
14.6722014.0%12.8%(+1.18)#25213.7%(+0.257)#13,080
15.6721211.3%12.8%(-1.47)#33513.7%(-2.40)#16,669
16.6720611.0%12.8%(-1.74)#34013.7%(-2.66)#17,057
17.672079.9%12.8%(-2.87)#37013.7%(-3.80)#18,711
18.672269.4%12.8%(-3.36)#38913.7%(-4.29)#19,520
19.672048.7%12.8%(-4.04)#40913.7%(-4.97)#20,617
20.672097.5%12.8%(-5.27)#44213.7%(-6.20)#22,521
21.672157.1%12.8%(-5.66)#46013.7%(-6.59)#23,182
22.672282.9%12.8%(-9.89)#60313.7%(-10.8)#29,113
23.672352.8%12.8%(-10.0)#60713.7%(-10.9)#29,228
24.672052.0%12.8%(-10.7)#62513.7%(-11.7)#29,778
25.672301.9%12.8%(-10.8)#63113.7%(-11.8)#29,855

Common Questions

What are the Top 10 Zip Codes with the Highest Female Poverty Level in Wichita, KS?
Top 10 Zip Codes with the Highest Female Poverty Level in Wichita, KS are:
#1
59.7%
#2
32.3%
#3
30.3%
#4
29.1%
#5
27.1%
#6
26.4%
#7
24.6%
#8
24.4%
#9
24.3%
#10
23.4%
What zip code has the Highest Female Poverty Level in Wichita, KS?
67232 has the Highest Female Poverty Level in Wichita, KS with 59.7%.
What is the Poverty Level Among Females in Wichita, KS?
Poverty Level Among Females in Wichita is 16.3%.
What is the Poverty Level Among Females in Kansas?
Poverty Level Among Females in Kansas is 12.8%.
What is the Poverty Level Among Females in the United States?
Poverty Level Among Females in the United States is 13.7%.