Zip Codes with the Highest Percentage of Population Employed in Food Preparation & Serving in Wichita, KS
RELATED REPORTS & OPTIONS
Food Preparation & Serving
Wichita
Compare Zip Codes
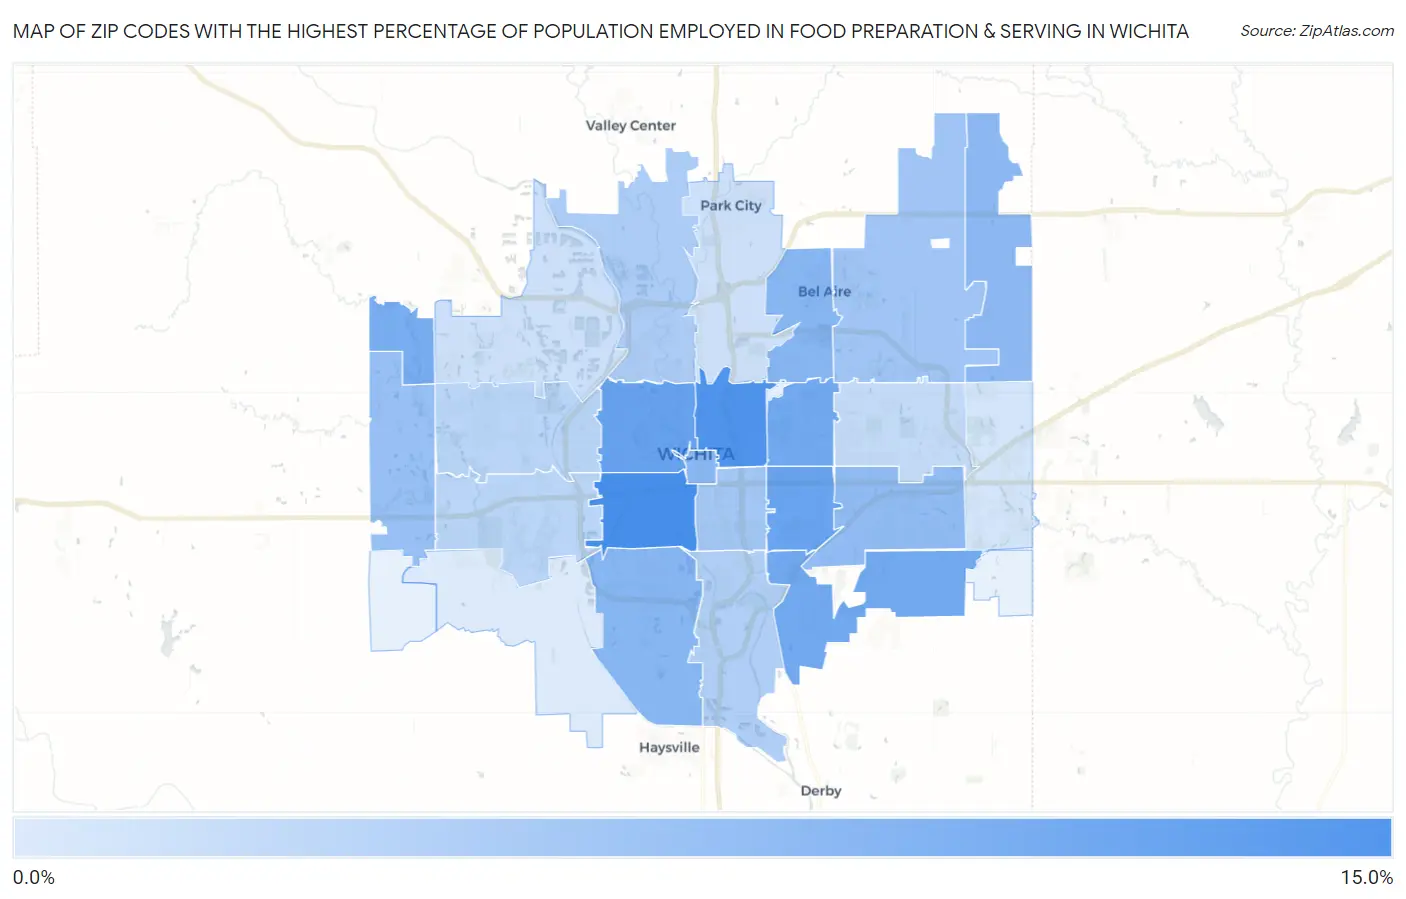
Map of Zip Codes with the Highest Percentage of Population Employed in Food Preparation & Serving in Wichita
1.2%
11.5%
Zip Codes with the Highest Percentage of Population Employed in Food Preparation & Serving in Wichita, KS
| Zip Code | % Employed | vs State | vs National | |
| 1. | 67213 | 11.5% | 5.2%(+6.29)#31 | 5.3%(+6.20)#1,846 |
| 2. | 67214 | 10.9% | 5.2%(+5.69)#37 | 5.3%(+5.60)#2,109 |
| 3. | 67203 | 9.2% | 5.2%(+3.97)#56 | 5.3%(+3.88)#3,362 |
| 4. | 67218 | 9.0% | 5.2%(+3.83)#58 | 5.3%(+3.74)#3,505 |
| 5. | 67208 | 8.4% | 5.2%(+3.24)#71 | 5.3%(+3.15)#4,128 |
| 6. | 67210 | 8.4% | 5.2%(+3.17)#74 | 5.3%(+3.08)#4,222 |
| 7. | 67223 | 8.0% | 5.2%(+2.83)#82 | 5.3%(+2.74)#4,698 |
| 8. | 67220 | 7.0% | 5.2%(+1.79)#110 | 5.3%(+1.69)#6,612 |
| 9. | 67217 | 6.9% | 5.2%(+1.72)#113 | 5.3%(+1.63)#6,776 |
| 10. | 67202 | 6.8% | 5.2%(+1.63)#116 | 5.3%(+1.54)#7,011 |
| 11. | 67228 | 6.7% | 5.2%(+1.51)#119 | 5.3%(+1.42)#7,327 |
| 12. | 67207 | 6.3% | 5.2%(+1.09)#138 | 5.3%(+0.997)#8,483 |
| 13. | 67235 | 5.8% | 5.2%(+0.603)#163 | 5.3%(+0.510)#10,048 |
| 14. | 67226 | 5.2% | 5.2%(+0.050)#203 | 5.3%(-0.042)#11,977 |
| 15. | 67211 | 5.0% | 5.2%(-0.176)#224 | 5.3%(-0.268)#12,875 |
| 16. | 67204 | 4.4% | 5.2%(-0.794)#260 | 5.3%(-0.887)#15,421 |
| 17. | 67216 | 4.2% | 5.2%(-1.04)#285 | 5.3%(-1.13)#16,496 |
| 18. | 67212 | 3.5% | 5.2%(-1.70)#342 | 5.3%(-1.79)#19,222 |
| 19. | 67209 | 3.5% | 5.2%(-1.71)#344 | 5.3%(-1.80)#19,276 |
| 20. | 67206 | 2.9% | 5.2%(-2.29)#384 | 5.3%(-2.38)#21,634 |
| 21. | 67219 | 2.3% | 5.2%(-2.89)#427 | 5.3%(-2.98)#23,758 |
| 22. | 67205 | 2.2% | 5.2%(-2.98)#434 | 5.3%(-3.07)#24,051 |
| 23. | 67230 | 1.9% | 5.2%(-3.34)#470 | 5.3%(-3.43)#25,129 |
| 24. | 67215 | 1.2% | 5.2%(-3.96)#517 | 5.3%(-4.06)#26,536 |
1
Common Questions
What are the Top 10 Zip Codes with the Highest Percentage of Population Employed in Food Preparation & Serving in Wichita, KS?
Top 10 Zip Codes with the Highest Percentage of Population Employed in Food Preparation & Serving in Wichita, KS are:
What zip code has the Highest Percentage of Population Employed in Food Preparation & Serving in Wichita, KS?
67213 has the Highest Percentage of Population Employed in Food Preparation & Serving in Wichita, KS with 11.5%.
What is the Percentage of Population Employed in Food Preparation & Serving in Wichita, KS?
Percentage of Population Employed in Food Preparation & Serving in Wichita is 6.0%.
What is the Percentage of Population Employed in Food Preparation & Serving in Kansas?
Percentage of Population Employed in Food Preparation & Serving in Kansas is 5.2%.
What is the Percentage of Population Employed in Food Preparation & Serving in the United States?
Percentage of Population Employed in Food Preparation & Serving in the United States is 5.3%.