Zip Codes with the Highest Percentage of Population Employed in Real Estate, Rental & Leasing in Wichita, KS
RELATED REPORTS & OPTIONS
Real Estate, Rental & Leasing
Wichita
Compare Zip Codes
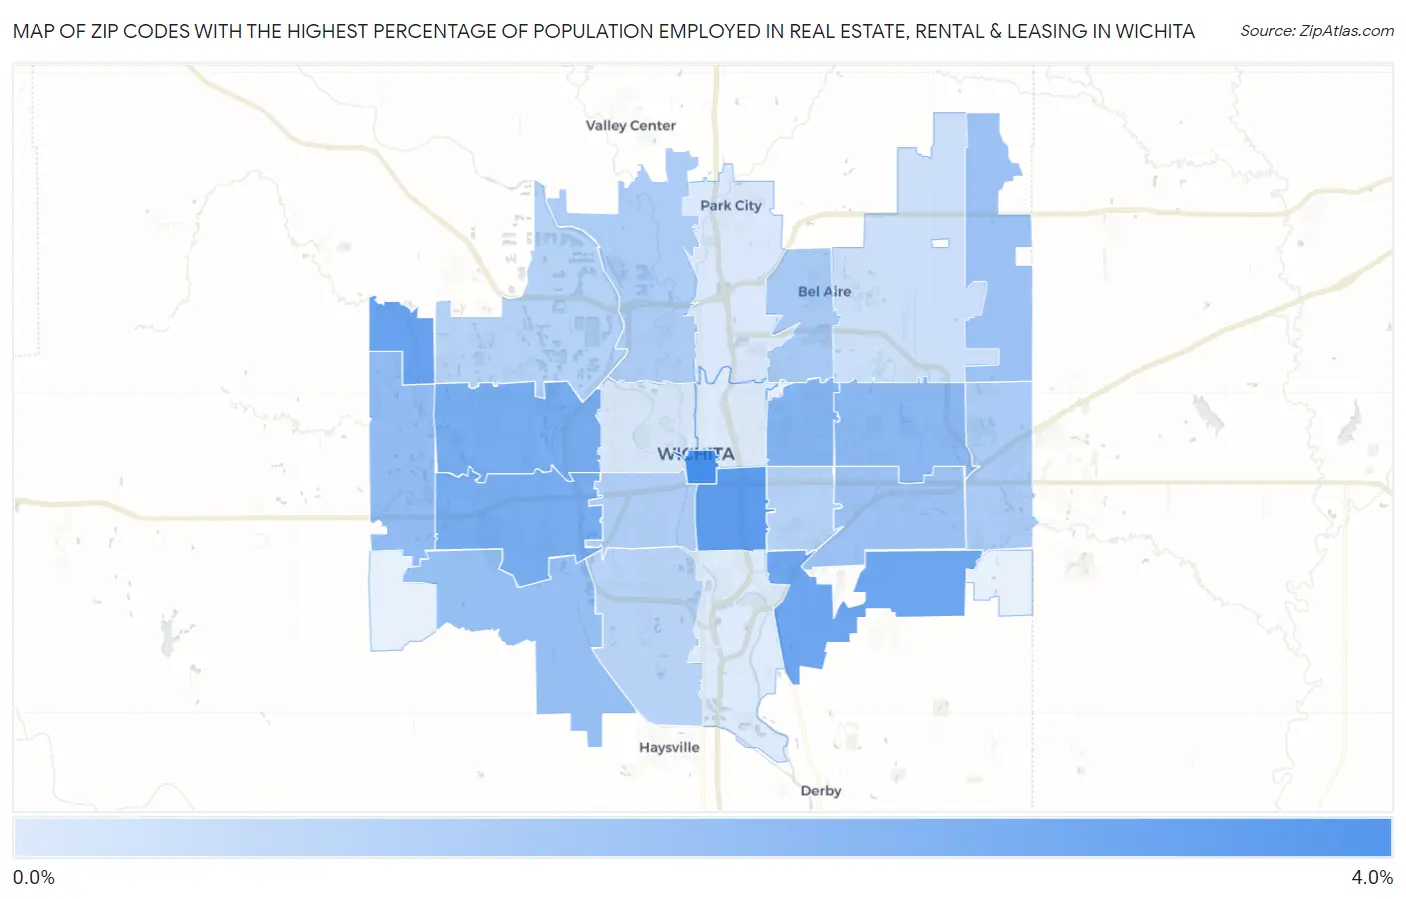
Map of Zip Codes with the Highest Percentage of Population Employed in Real Estate, Rental & Leasing in Wichita
0.70%
3.5%
Zip Codes with the Highest Percentage of Population Employed in Real Estate, Rental & Leasing in Wichita, KS
| Zip Code | % Employed | vs State | vs National | |
| 1. | 67202 | 3.5% | 1.4%(+2.08)#30 | 1.9%(+1.56)#2,924 |
| 2. | 67211 | 3.0% | 1.4%(+1.65)#40 | 1.9%(+1.13)#3,831 |
| 3. | 67223 | 2.9% | 1.4%(+1.49)#47 | 1.9%(+0.974)#4,256 |
| 4. | 67210 | 2.7% | 1.4%(+1.34)#50 | 1.9%(+0.822)#4,706 |
| 5. | 67209 | 2.6% | 1.4%(+1.19)#58 | 1.9%(+0.676)#5,217 |
| 6. | 67212 | 2.6% | 1.4%(+1.19)#59 | 1.9%(+0.674)#5,228 |
| 7. | 67208 | 2.4% | 1.4%(+0.977)#66 | 1.9%(+0.462)#6,086 |
| 8. | 67206 | 2.2% | 1.4%(+0.838)#75 | 1.9%(+0.324)#6,731 |
| 9. | 67235 | 2.1% | 1.4%(+0.716)#81 | 1.9%(+0.201)#7,355 |
| 10. | 67215 | 2.0% | 1.4%(+0.621)#86 | 1.9%(+0.106)#7,850 |
| 11. | 67228 | 1.9% | 1.4%(+0.539)#94 | 1.9%(+0.025)#8,358 |
| 12. | 67207 | 1.9% | 1.4%(+0.534)#95 | 1.9%(+0.019)#8,392 |
| 13. | 67220 | 1.7% | 1.4%(+0.299)#113 | 1.9%(-0.216)#9,931 |
| 14. | 67230 | 1.6% | 1.4%(+0.265)#117 | 1.9%(-0.249)#10,164 |
| 15. | 67204 | 1.6% | 1.4%(+0.220)#121 | 1.9%(-0.294)#10,452 |
| 16. | 67213 | 1.5% | 1.4%(+0.157)#126 | 1.9%(-0.358)#10,903 |
| 17. | 67218 | 1.4% | 1.4%(+0.048)#133 | 1.9%(-0.467)#11,786 |
| 18. | 67205 | 1.4% | 1.4%(+0.037)#135 | 1.9%(-0.477)#11,859 |
| 19. | 67217 | 1.4% | 1.4%(+0.007)#138 | 1.9%(-0.507)#12,105 |
| 20. | 67226 | 1.0% | 1.4%(-0.373)#181 | 1.9%(-0.887)#15,123 |
| 21. | 67203 | 0.80% | 1.4%(-0.577)#222 | 1.9%(-1.09)#16,715 |
| 22. | 67219 | 0.72% | 1.4%(-0.657)#237 | 1.9%(-1.17)#17,316 |
| 23. | 67214 | 0.71% | 1.4%(-0.671)#239 | 1.9%(-1.19)#17,449 |
| 24. | 67216 | 0.70% | 1.4%(-0.680)#241 | 1.9%(-1.19)#17,517 |
1
Common Questions
What are the Top 10 Zip Codes with the Highest Percentage of Population Employed in Real Estate, Rental & Leasing in Wichita, KS?
Top 10 Zip Codes with the Highest Percentage of Population Employed in Real Estate, Rental & Leasing in Wichita, KS are:
What zip code has the Highest Percentage of Population Employed in Real Estate, Rental & Leasing in Wichita, KS?
67202 has the Highest Percentage of Population Employed in Real Estate, Rental & Leasing in Wichita, KS with 3.5%.
What is the Percentage of Population Employed in Real Estate, Rental & Leasing in Wichita, KS?
Percentage of Population Employed in Real Estate, Rental & Leasing in Wichita is 1.7%.
What is the Percentage of Population Employed in Real Estate, Rental & Leasing in Kansas?
Percentage of Population Employed in Real Estate, Rental & Leasing in Kansas is 1.4%.
What is the Percentage of Population Employed in Real Estate, Rental & Leasing in the United States?
Percentage of Population Employed in Real Estate, Rental & Leasing in the United States is 1.9%.