Zip Codes with the Highest Percentage of Families with Income Above $100,000 in Wichita, KS
RELATED REPORTS & OPTIONS
Family Income | $100k+
Wichita
Compare Zip Codes
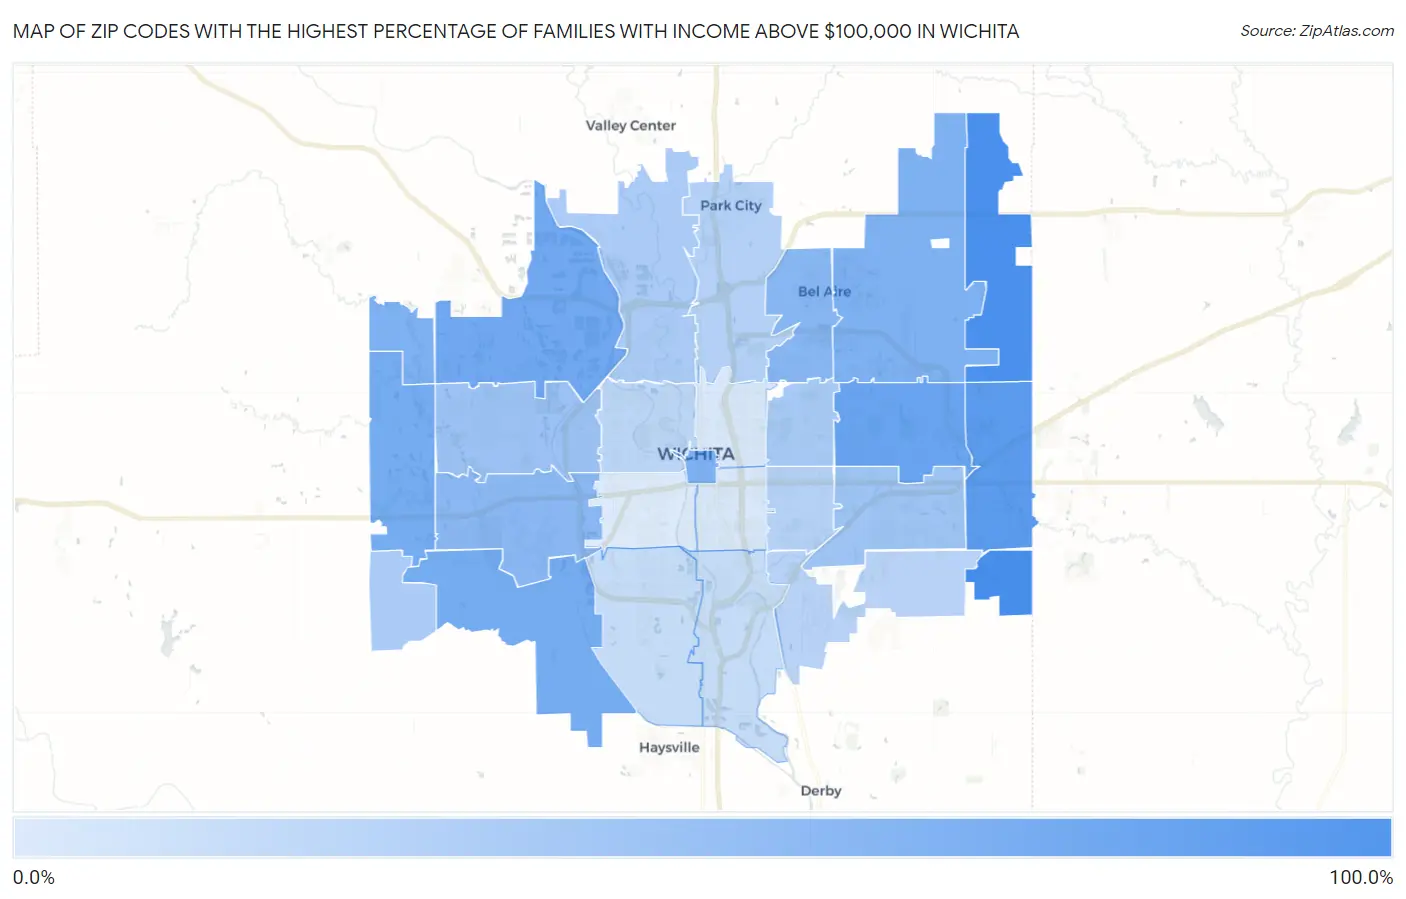
Map of Zip Codes with the Highest Percentage of Families with Income Above $100,000 in Wichita
10.5%
86.8%
Zip Codes with the Highest Percentage of Families with Income Above $100,000 in Wichita, KS
| Zip Code | Families with Income > $100k | vs State | vs National | |
| 1. | 67232 | 86.8% | 43.8%(+43.0)#3 | 46.1%(+40.7)#482 |
| 2. | 67228 | 84.7% | 43.8%(+40.9)#6 | 46.1%(+38.6)#613 |
| 3. | 67230 | 75.8% | 43.8%(+32.0)#16 | 46.1%(+29.7)#1,589 |
| 4. | 67206 | 65.3% | 43.8%(+21.5)#36 | 46.1%(+19.2)#3,671 |
| 5. | 67205 | 61.9% | 43.8%(+18.1)#50 | 46.1%(+15.8)#4,578 |
| 6. | 67215 | 58.9% | 43.8%(+15.1)#62 | 46.1%(+12.8)#5,486 |
| 7. | 67235 | 58.7% | 43.8%(+14.9)#63 | 46.1%(+12.6)#5,546 |
| 8. | 67202 | 54.2% | 43.8%(+10.4)#89 | 46.1%(+8.10)#7,111 |
| 9. | 67223 | 53.9% | 43.8%(+10.1)#94 | 46.1%(+7.80)#7,224 |
| 10. | 67226 | 53.5% | 43.8%(+9.70)#95 | 46.1%(+7.40)#7,355 |
| 11. | 67220 | 49.0% | 43.8%(+5.20)#135 | 46.1%(+2.90)#9,266 |
| 12. | 67209 | 47.3% | 43.8%(+3.50)#154 | 46.1%(+1.20)#10,137 |
| 13. | 67212 | 39.1% | 43.8%(-4.70)#263 | 46.1%(-7.00)#14,995 |
| 14. | 67207 | 37.7% | 43.8%(-6.10)#293 | 46.1%(-8.40)#15,970 |
| 15. | 67208 | 32.9% | 43.8%(-10.9)#374 | 46.1%(-13.2)#19,367 |
| 16. | 67204 | 32.5% | 43.8%(-11.3)#383 | 46.1%(-13.6)#19,671 |
| 17. | 67227 | 32.4% | 43.8%(-11.4)#386 | 46.1%(-13.7)#19,799 |
| 18. | 67219 | 27.9% | 43.8%(-15.9)#471 | 46.1%(-18.2)#22,842 |
| 19. | 67218 | 26.5% | 43.8%(-17.3)#490 | 46.1%(-19.6)#23,759 |
| 20. | 67210 | 25.9% | 43.8%(-17.9)#504 | 46.1%(-20.2)#24,169 |
| 21. | 67203 | 23.7% | 43.8%(-20.1)#541 | 46.1%(-22.4)#25,451 |
| 22. | 67217 | 20.0% | 43.8%(-23.8)#577 | 46.1%(-26.1)#27,218 |
| 23. | 67216 | 19.9% | 43.8%(-23.9)#581 | 46.1%(-26.2)#27,289 |
| 24. | 67211 | 12.6% | 43.8%(-31.2)#639 | 46.1%(-33.5)#29,803 |
| 25. | 67214 | 12.1% | 43.8%(-31.7)#643 | 46.1%(-34.0)#29,923 |
| 26. | 67213 | 10.5% | 43.8%(-33.3)#651 | 46.1%(-35.6)#30,248 |
1
Common Questions
What are the Top 10 Zip Codes with the Highest Percentage of Families with Income Above $100,000 in Wichita, KS?
Top 10 Zip Codes with the Highest Percentage of Families with Income Above $100,000 in Wichita, KS are:
What zip code has the Highest Percentage of Families with Income Above $100,000 in Wichita, KS?
67232 has the Highest Percentage of Families with Income Above $100,000 in Wichita, KS with 86.8%.
What is the Percentage of Families with Income Above $100,000 in Wichita, KS?
Percentage of Families with Income Above $100,000 in Wichita is 36.6%.
What is the Percentage of Families with Income Above $100,000 in Kansas?
Percentage of Families with Income Above $100,000 in Kansas is 43.8%.
What is the Percentage of Families with Income Above $100,000 in the United States?
Percentage of Families with Income Above $100,000 in the United States is 46.1%.