Zip Codes with the Highest Percentage of Population with a Degree in Visual and Performing Arts in Wichita, KS
RELATED REPORTS & OPTIONS
Visual and Performing Arts
Wichita
Compare Zip Codes
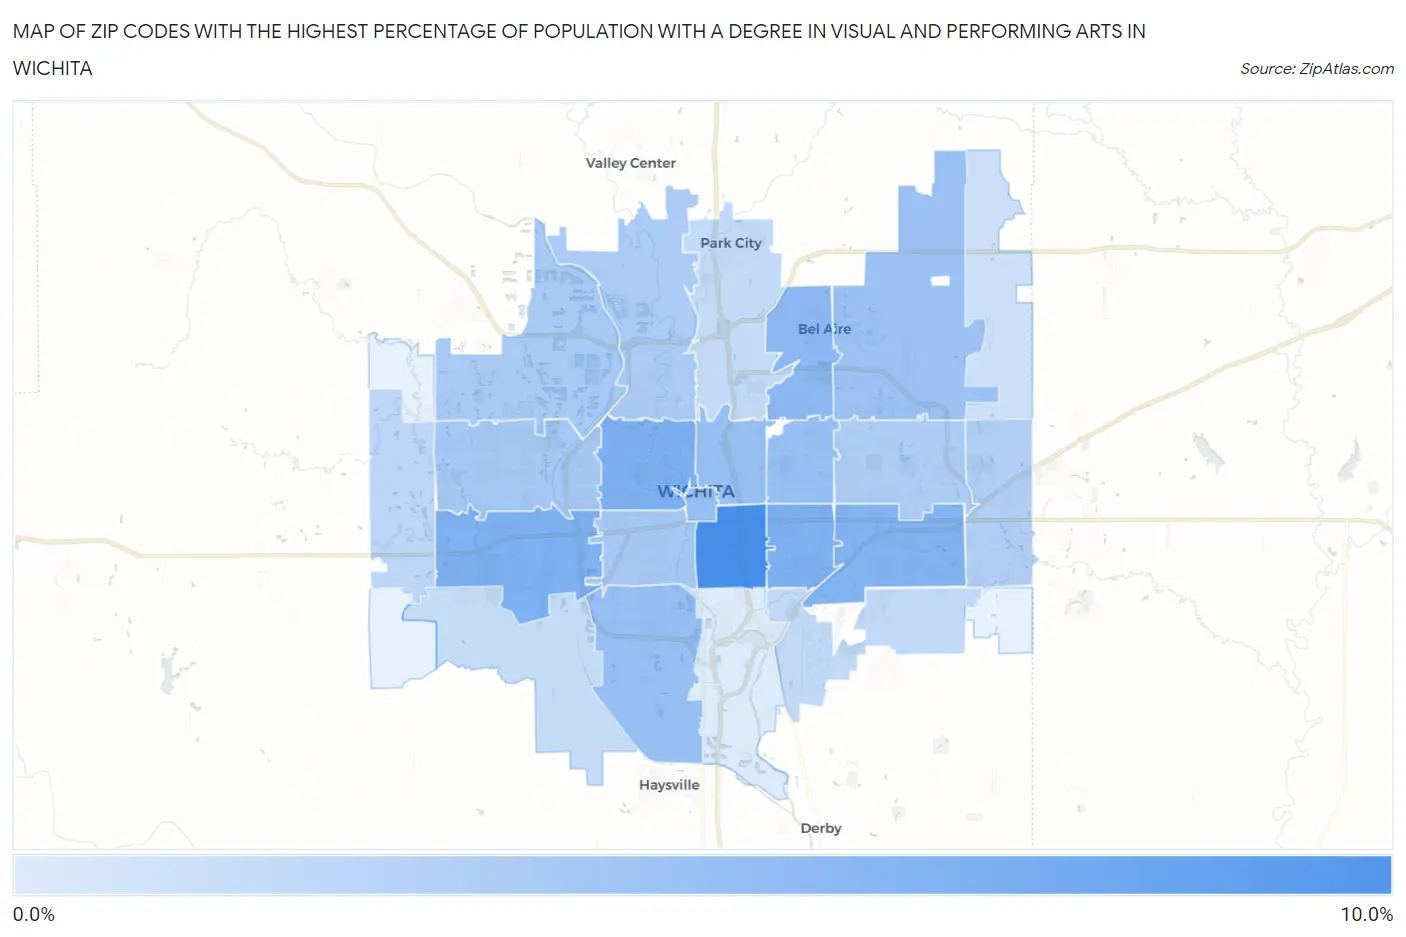
Map of Zip Codes with the Highest Percentage of Population with a Degree in Visual and Performing Arts in Wichita
0.071%
8.5%
Zip Codes with the Highest Percentage of Population with a Degree in Visual and Performing Arts in Wichita, KS
| Zip Code | % Graduates | vs State | vs National | |
| 1. | 67211 | 8.5% | 3.4%(+5.10)#35 | 4.3%(+4.26)#2,516 |
| 2. | 67218 | 5.3% | 3.4%(+1.90)#79 | 4.3%(+1.06)#6,014 |
| 3. | 67203 | 5.3% | 3.4%(+1.88)#82 | 4.3%(+1.05)#6,055 |
| 4. | 67209 | 5.3% | 3.4%(+1.84)#84 | 4.3%(+1.000)#6,150 |
| 5. | 67207 | 5.1% | 3.4%(+1.68)#86 | 4.3%(+0.844)#6,425 |
| 6. | 67220 | 4.5% | 3.4%(+1.12)#102 | 4.3%(+0.278)#7,734 |
| 7. | 67217 | 4.1% | 3.4%(+0.638)#123 | 4.3%(-0.200)#9,079 |
| 8. | 67202 | 4.0% | 3.4%(+0.597)#128 | 4.3%(-0.242)#9,225 |
| 9. | 67208 | 3.9% | 3.4%(+0.513)#134 | 4.3%(-0.326)#9,485 |
| 10. | 67214 | 3.8% | 3.4%(+0.429)#137 | 4.3%(-0.409)#9,758 |
| 11. | 67226 | 3.7% | 3.4%(+0.294)#145 | 4.3%(-0.544)#10,135 |
| 12. | 67212 | 3.1% | 3.4%(-0.333)#175 | 4.3%(-1.17)#12,406 |
| 13. | 67213 | 3.0% | 3.4%(-0.365)#181 | 4.3%(-1.20)#12,552 |
| 14. | 67205 | 3.0% | 3.4%(-0.431)#183 | 4.3%(-1.27)#12,797 |
| 15. | 67204 | 2.9% | 3.4%(-0.556)#191 | 4.3%(-1.39)#13,257 |
| 16. | 67206 | 2.7% | 3.4%(-0.666)#203 | 4.3%(-1.50)#13,709 |
| 17. | 67230 | 2.5% | 3.4%(-0.908)#219 | 4.3%(-1.75)#14,594 |
| 18. | 67235 | 1.9% | 3.4%(-1.52)#268 | 4.3%(-2.36)#16,821 |
| 19. | 67210 | 1.6% | 3.4%(-1.83)#284 | 4.3%(-2.67)#17,893 |
| 20. | 67219 | 1.5% | 3.4%(-1.92)#287 | 4.3%(-2.75)#18,167 |
| 21. | 67215 | 1.3% | 3.4%(-2.14)#305 | 4.3%(-2.98)#18,866 |
| 22. | 67228 | 0.93% | 3.4%(-2.48)#326 | 4.3%(-3.32)#19,859 |
| 23. | 67216 | 0.071% | 3.4%(-3.34)#361 | 4.3%(-4.18)#21,242 |
1
Common Questions
What are the Top 10 Zip Codes with the Highest Percentage of Population with a Degree in Visual and Performing Arts in Wichita, KS?
Top 10 Zip Codes with the Highest Percentage of Population with a Degree in Visual and Performing Arts in Wichita, KS are:
What zip code has the Highest Percentage of Population with a Degree in Visual and Performing Arts in Wichita, KS?
67211 has the Highest Percentage of Population with a Degree in Visual and Performing Arts in Wichita, KS with 8.5%.
What is the Percentage of Population with a Degree in Visual and Performing Arts in Wichita, KS?
Percentage of Population with a Degree in Visual and Performing Arts in Wichita is 3.4%.
What is the Percentage of Population with a Degree in Visual and Performing Arts in Kansas?
Percentage of Population with a Degree in Visual and Performing Arts in Kansas is 3.4%.
What is the Percentage of Population with a Degree in Visual and Performing Arts in the United States?
Percentage of Population with a Degree in Visual and Performing Arts in the United States is 4.3%.