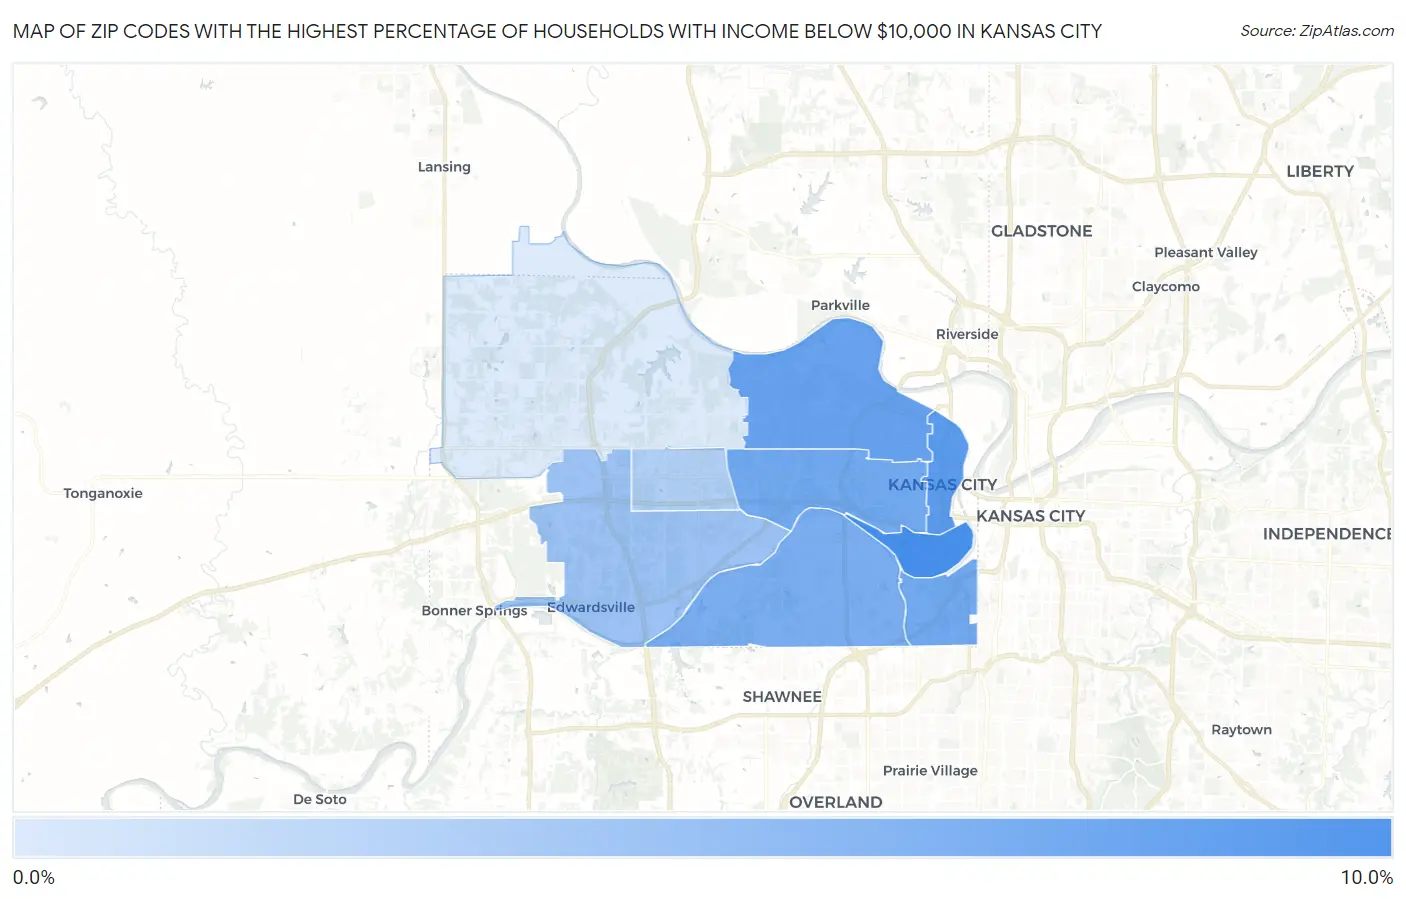
Zip Codes with the Highest Percentage of Households with Income Below $10,000 in Kansas City, KS
RELATED REPORTS & OPTIONS
Household Income | $0-10k
Kansas City
Compare Zip Codes
Map of Zip Codes with the Highest Percentage of Households with Income Below $10,000 in Kansas City
2.0%
9.2%
Zip Codes with the Highest Percentage of Households with Income Below $10,000 in Kansas City, KS
| Zip Code | Households with Income < $10k | vs State | vs National | |
| 1. | 66105 | 9.2% | 4.5%(+4.70)#53 | 4.9%(+4.30)#4,252 |
| 2. | 66101 | 8.2% | 4.5%(+3.70)#77 | 4.9%(+3.30)#5,314 |
| 3. | 66104 | 7.6% | 4.5%(+3.10)#90 | 4.9%(+2.70)#6,075 |
| 4. | 66102 | 7.0% | 4.5%(+2.50)#106 | 4.9%(+2.10)#6,956 |
| 5. | 66103 | 7.0% | 4.5%(+2.50)#107 | 4.9%(+2.10)#6,992 |
| 6. | 66106 | 6.7% | 4.5%(+2.20)#120 | 4.9%(+1.80)#7,545 |
| 7. | 66111 | 5.2% | 4.5%(+0.700)#196 | 4.9%(+0.300)#11,144 |
| 8. | 66112 | 4.0% | 4.5%(-0.500)#275 | 4.9%(-0.900)#15,326 |
| 9. | 66109 | 2.0% | 4.5%(-2.50)#468 | 4.9%(-2.90)#23,618 |
1
Common Questions
What are the Top 5 Zip Codes with the Highest Percentage of Households with Income Below $10,000 in Kansas City, KS?
Top 5 Zip Codes with the Highest Percentage of Households with Income Below $10,000 in Kansas City, KS are:
What zip code has the Highest Percentage of Households with Income Below $10,000 in Kansas City, KS?
66105 has the Highest Percentage of Households with Income Below $10,000 in Kansas City, KS with 9.2%.
What is the Percentage of Households with Income Below $10,000 in Kansas City, KS?
Percentage of Households with Income Below $10,000 in Kansas City is 6.0%.
What is the Percentage of Households with Income Below $10,000 in Kansas?
Percentage of Households with Income Below $10,000 in Kansas is 4.5%.
What is the Percentage of Households with Income Below $10,000 in the United States?
Percentage of Households with Income Below $10,000 in the United States is 4.9%.