Zip Codes with the Highest Percentage of Population with a Degree in Communications in Wichita, KS

RELATED REPORTS & OPTIONS

Communications
Population
Families and Households
Female Fertility
Female Fertility (Unmarried)
Race (Community Size)
Race (Percentage)
Ancestry (Community Size)
AfricanAlaska NativeAmericanApacheArabArapahoArgentineanArmenianAustralianAustrianBangladeshiBarbadianBelgianBhutaneseBlackfeetBolivianBrazilianBritishBulgarianBurmeseCajunCanadianCelticCentral AmericanCentral American IndianCherokeeCheyenneChickasawChileanChippewaChoctawColombianComancheCosta RicanCreekCroatianCubanCzechCzechoslovakianDanishDelawareDominicanDutchDutch West IndianEastern EuropeanEcuadorianEgyptianEnglishEthiopianEuropeanFilipinoFinnishFrenchFrench American IndianFrench CanadianGermanGerman RussianGhanaianGreekGuamanian / ChamorroGuatemalanHaitianHonduranHungarianIcelanderIndian (Asian)IndonesianInupiatIranianIrishIroquoisItalianJamaicanJapaneseJordanianKenyanKiowaKoreanLaotianLebaneseLithuanianLuxembourgerMalaysianMexicanMexican American IndianMongolianMoroccanNative HawaiianNavajoNicaraguanNigerianNorthern EuropeanNorwegianOsageOttawaPakistaniPalestinianPanamanianParaguayanPennsylvania GermanPeruvianPimaPolishPortuguesePotawatomiPuebloPuerto RicanRomanianRussianSalvadoranSamoanScandinavianScotch-IrishScottishSeminoleSiouxSlavicSlovakSloveneSouth AfricanSouth AmericanSpaniardSpanishSpanish AmericanSpanish American IndianSri LankanSubsaharan AfricanSwedishSwissSyrianThaiTrinidadian and TobagonianTurkishUgandanUkrainianVenezuelanWelshWest IndianYugoslavian
Ancestry (Percentage)
AfricanAlaska NativeAmericanApacheArabArapahoArgentineanArmenianAustralianAustrianBangladeshiBarbadianBelgianBhutaneseBlackfeetBolivianBrazilianBritishBulgarianBurmeseCajunCanadianCelticCentral AmericanCentral American IndianCherokeeCheyenneChickasawChileanChippewaChoctawColombianComancheCosta RicanCreekCroatianCubanCzechCzechoslovakianDanishDelawareDominicanDutchDutch West IndianEastern EuropeanEcuadorianEgyptianEnglishEthiopianEuropeanFilipinoFinnishFrenchFrench American IndianFrench CanadianGermanGerman RussianGhanaianGreekGuamanian / ChamorroGuatemalanHaitianHonduranHungarianIcelanderIndian (Asian)IndonesianInupiatIranianIrishIroquoisItalianJamaicanJapaneseJordanianKenyanKiowaKoreanLaotianLebaneseLithuanianLuxembourgerMalaysianMexicanMexican American IndianMongolianMoroccanNative HawaiianNavajoNicaraguanNigerianNorthern EuropeanNorwegianOsageOttawaPakistaniPalestinianPanamanianParaguayanPennsylvania GermanPeruvianPimaPolishPortuguesePotawatomiPuebloPuerto RicanRomanianRussianSalvadoranSamoanScandinavianScotch-IrishScottishSeminoleSiouxSlavicSlovakSloveneSouth AfricanSouth AmericanSpaniardSpanishSpanish AmericanSpanish American IndianSri LankanSubsaharan AfricanSwedishSwissSyrianThaiTrinidadian and TobagonianTurkishUgandanUkrainianVenezuelanWelshWest IndianYugoslavian
Immigrant Origin (Total)
Immigrant Origin (Percentage)
Income
Income (Families)
Income (Households)
Poverty
Poverty (Families)
Unemployment
Employment Occupations
Employment Industries
Employer Class
Commute Time
Commute Means
School Enrollment
Education by Degree Field
Occupancy
Finances
Physical Characteristics
Wichita
Compare Zip Codes
Comparison Subject

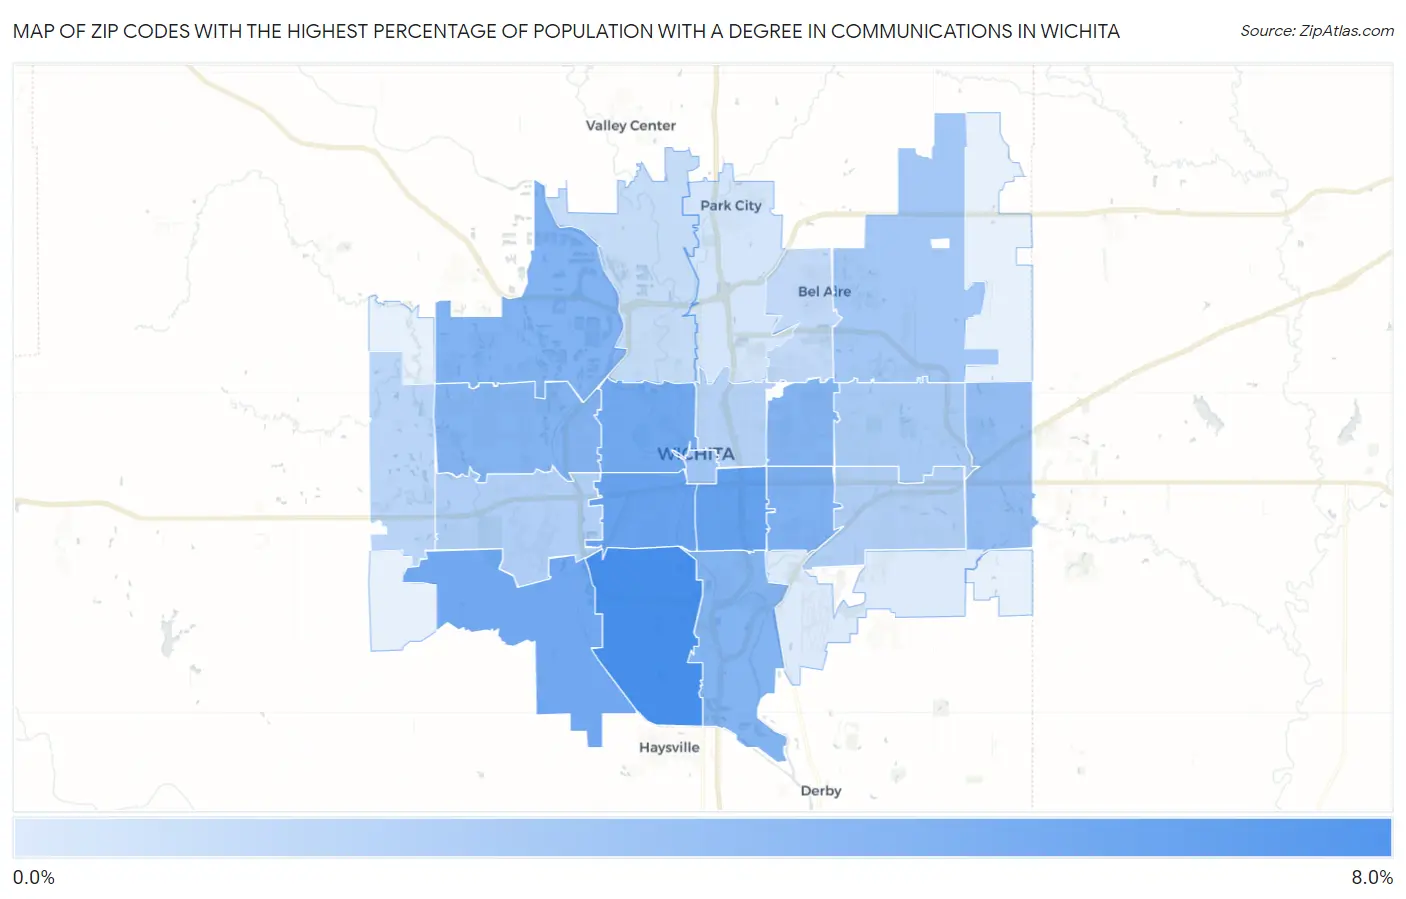
Map of Zip Codes with the Highest Percentage of Population with a Degree in Communications in Wichita

0.0%
8.0%
Zip Codes with the Highest Percentage of Population with a Degree in Communications in Wichita Map

Zip Codes with the Highest Percentage of Population with a Degree in Communications in Wichita, KS

Zip Code % Graduates vs State vs National
1.672176.7%4.1%(+2.57)#624.1%(+2.57)#2,909
2.672115.5%4.1%(+1.41)#864.1%(+1.41)#4,571
3.672135.4%4.1%(+1.31)#934.1%(+1.31)#4,743
4.672155.1%4.1%(+1.01)#1044.1%(+1.01)#5,374
5.672035.0%4.1%(+0.912)#1084.1%(+0.915)#5,579
6.672184.6%4.1%(+0.461)#1214.1%(+0.463)#6,698
7.672054.5%4.1%(+0.395)#1264.1%(+0.397)#6,874
8.672084.5%4.1%(+0.345)#1284.1%(+0.347)#7,013
9.672124.4%4.1%(+0.295)#1304.1%(+0.298)#7,160
10.672164.4%4.1%(+0.279)#1334.1%(+0.281)#7,218
11.672303.8%4.1%(-0.313)#1624.1%(-0.311)#9,189
12.672023.3%4.1%(-0.824)#1784.1%(-0.822)#11,018
13.672263.2%4.1%(-0.934)#1884.1%(-0.932)#11,449
14.672063.1%4.1%(-1.05)#1974.1%(-1.04)#11,855
15.672072.8%4.1%(-1.33)#2134.1%(-1.33)#12,952
16.672092.7%4.1%(-1.39)#2194.1%(-1.39)#13,217
17.672142.6%4.1%(-1.55)#2304.1%(-1.55)#13,822
18.672352.4%4.1%(-1.73)#2434.1%(-1.73)#14,470
19.672202.1%4.1%(-2.00)#2574.1%(-2.00)#15,394
20.672042.0%4.1%(-2.16)#2704.1%(-2.15)#15,959
21.672191.5%4.1%(-2.64)#2984.1%(-2.64)#17,508
22.672101.1%4.1%(-3.00)#3234.1%(-3.00)#18,609

Common Questions

What are the Top 10 Zip Codes with the Highest Percentage of Population with a Degree in Communications in Wichita, KS?
Top 10 Zip Codes with the Highest Percentage of Population with a Degree in Communications in Wichita, KS are:
#1
6.7%
#2
5.5%
#3
5.4%
#4
5.1%
#5
5.0%
#6
4.6%
#7
4.5%
#8
4.5%
#9
4.4%
#10
4.4%
What zip code has the Highest Percentage of Population with a Degree in Communications in Wichita, KS?
67217 has the Highest Percentage of Population with a Degree in Communications in Wichita, KS with 6.7%.
What is the Percentage of Population with a Degree in Communications in Wichita, KS?
Percentage of Population with a Degree in Communications in Wichita is 3.7%.
What is the Percentage of Population with a Degree in Communications in Kansas?
Percentage of Population with a Degree in Communications in Kansas is 4.1%.
What is the Percentage of Population with a Degree in Communications in the United States?
Percentage of Population with a Degree in Communications in the United States is 4.1%.