Zip Codes with the Highest Percentage of Households with Income Below $10,000 in Overland Park, KS
RELATED REPORTS & OPTIONS
Household Income | $0-10k
Overland Park
Compare Zip Codes
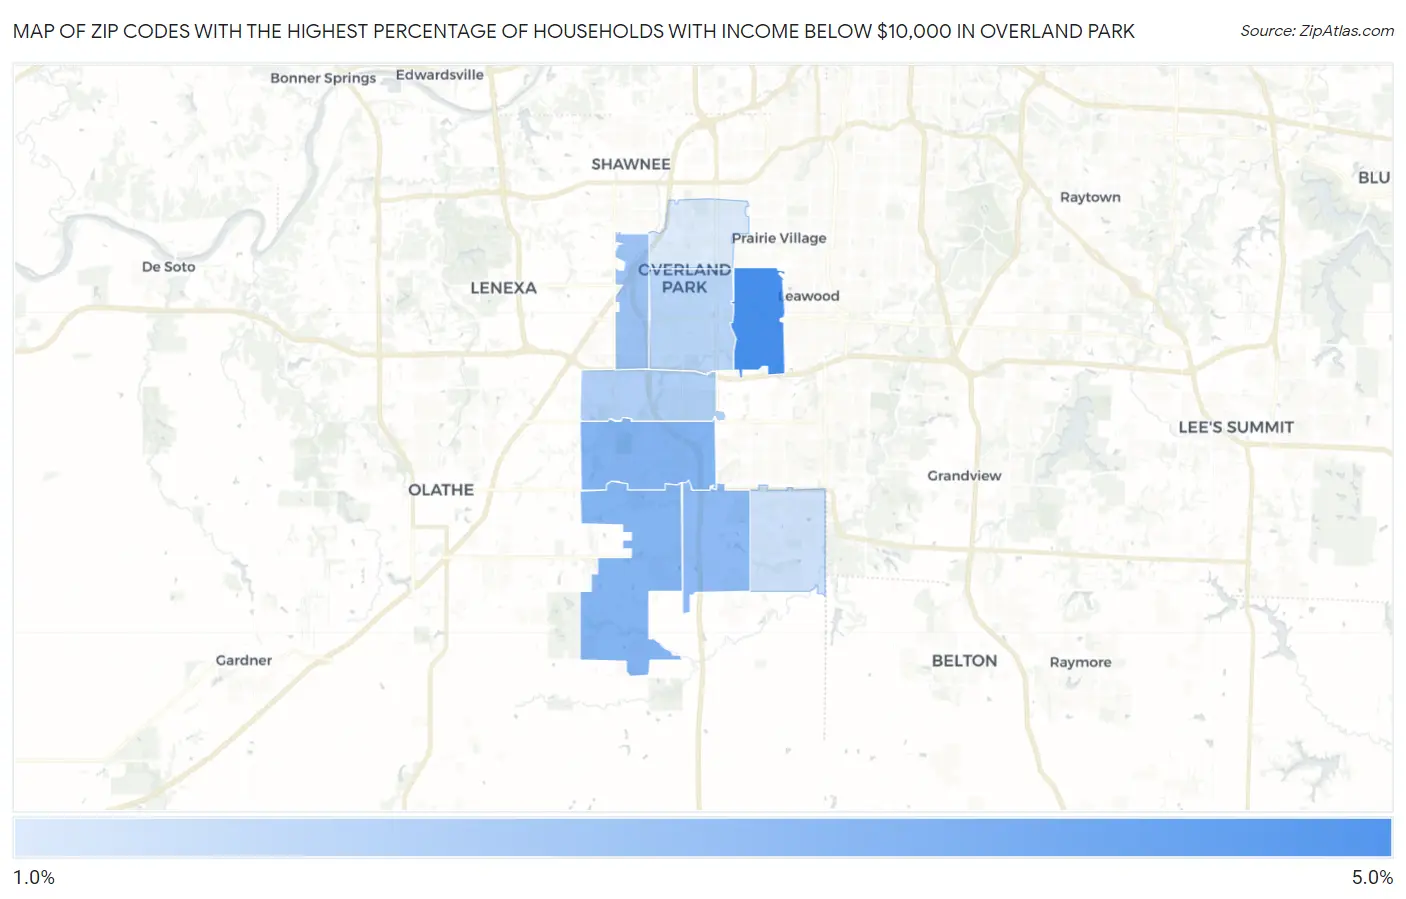
Map of Zip Codes with the Highest Percentage of Households with Income Below $10,000 in Overland Park
1.4%
4.1%
Zip Codes with the Highest Percentage of Households with Income Below $10,000 in Overland Park, KS
| Zip Code | Households with Income < $10k | vs State | vs National | |
| 1. | 66207 | 4.1% | 4.5%(-0.400)#272 | 4.9%(-0.800)#14,915 |
| 2. | 66213 | 3.0% | 4.5%(-1.50)#366 | 4.9%(-1.90)#19,353 |
| 3. | 66221 | 3.0% | 4.5%(-1.50)#367 | 4.9%(-1.90)#19,382 |
| 4. | 66223 | 2.8% | 4.5%(-1.70)#381 | 4.9%(-2.10)#20,305 |
| 5. | 66214 | 2.6% | 4.5%(-1.90)#407 | 4.9%(-2.30)#21,211 |
| 6. | 66210 | 2.2% | 4.5%(-2.30)#441 | 4.9%(-2.70)#22,903 |
| 7. | 66212 | 2.0% | 4.5%(-2.50)#467 | 4.9%(-2.90)#23,603 |
| 8. | 66224 | 1.7% | 4.5%(-2.80)#500 | 4.9%(-3.20)#24,783 |
| 9. | 66204 | 1.4% | 4.5%(-3.10)#528 | 4.9%(-3.50)#25,738 |
1
Common Questions
What are the Top 5 Zip Codes with the Highest Percentage of Households with Income Below $10,000 in Overland Park, KS?
Top 5 Zip Codes with the Highest Percentage of Households with Income Below $10,000 in Overland Park, KS are:
What zip code has the Highest Percentage of Households with Income Below $10,000 in Overland Park, KS?
66207 has the Highest Percentage of Households with Income Below $10,000 in Overland Park, KS with 4.1%.
What is the Percentage of Households with Income Below $10,000 in Overland Park, KS?
Percentage of Households with Income Below $10,000 in Overland Park is 2.5%.
What is the Percentage of Households with Income Below $10,000 in Kansas?
Percentage of Households with Income Below $10,000 in Kansas is 4.5%.
What is the Percentage of Households with Income Below $10,000 in the United States?
Percentage of Households with Income Below $10,000 in the United States is 4.9%.