Zip Codes with the Highest Percentage of Population Employed in Security & Protection in Wichita, KS
RELATED REPORTS & OPTIONS
Security & Protection
Wichita
Compare Zip Codes
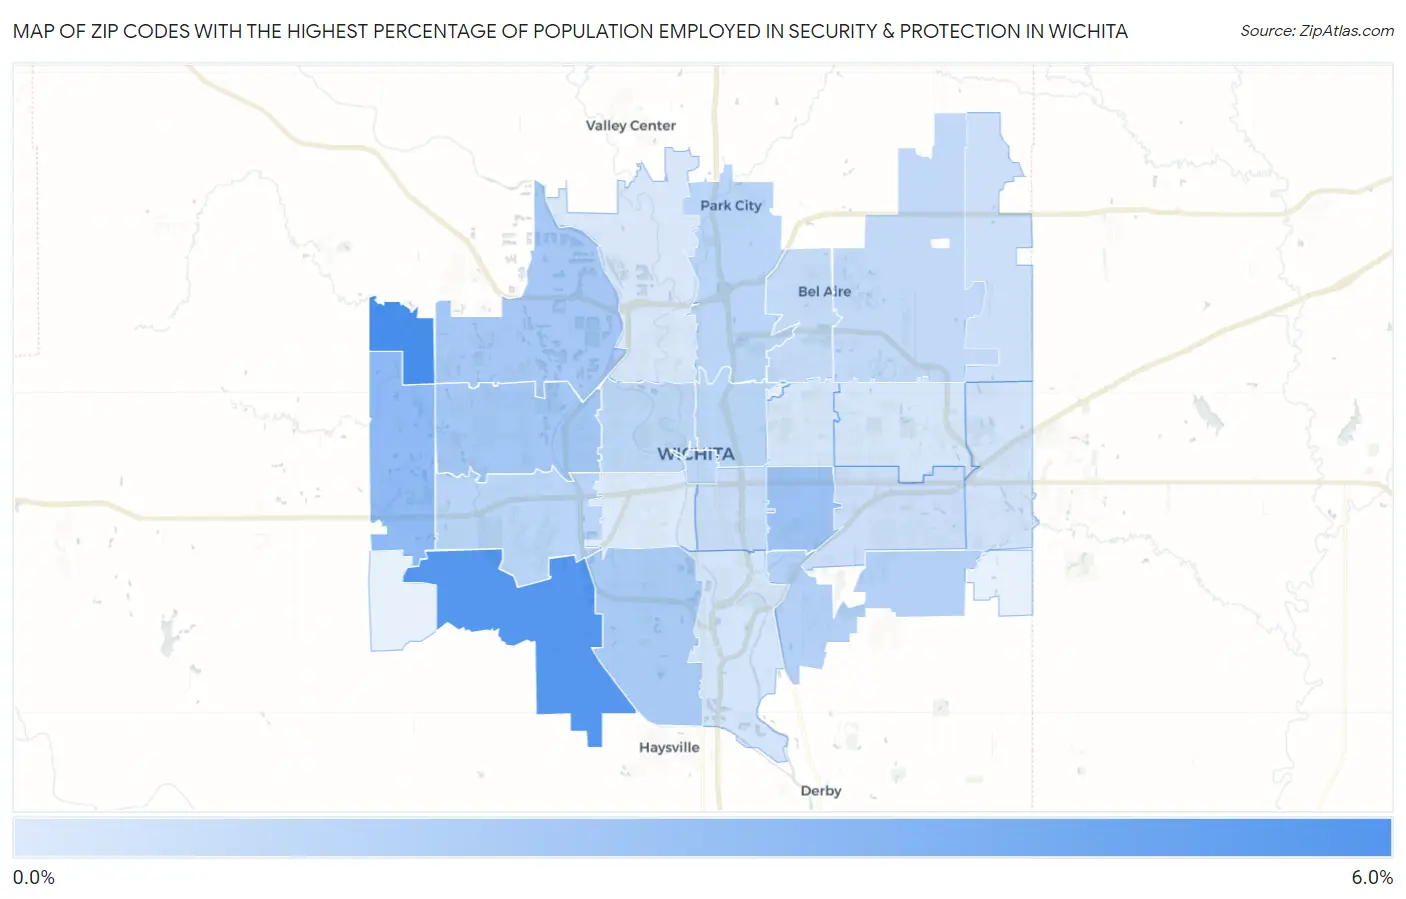
Map of Zip Codes with the Highest Percentage of Population Employed in Security & Protection in Wichita
0.47%
5.4%
Zip Codes with the Highest Percentage of Population Employed in Security & Protection in Wichita, KS
| Zip Code | % Employed | vs State | vs National | |
| 1. | 67223 | 5.4% | 1.8%(+3.67)#34 | 2.1%(+3.30)#2,494 |
| 2. | 67215 | 5.0% | 1.8%(+3.24)#40 | 2.1%(+2.86)#2,915 |
| 3. | 67235 | 3.0% | 1.8%(+1.24)#119 | 2.1%(+0.870)#7,152 |
| 4. | 67218 | 2.6% | 1.8%(+0.872)#142 | 2.1%(+0.499)#8,776 |
| 5. | 67212 | 2.4% | 1.8%(+0.575)#161 | 2.1%(+0.202)#10,324 |
| 6. | 67205 | 2.3% | 1.8%(+0.482)#171 | 2.1%(+0.109)#10,898 |
| 7. | 67217 | 2.2% | 1.8%(+0.465)#177 | 2.1%(+0.091)#11,012 |
| 8. | 67210 | 1.8% | 1.8%(+0.015)#229 | 2.1%(-0.358)#14,024 |
| 9. | 67209 | 1.6% | 1.8%(-0.169)#252 | 2.1%(-0.542)#15,368 |
| 10. | 67214 | 1.6% | 1.8%(-0.178)#253 | 2.1%(-0.551)#15,438 |
| 11. | 67219 | 1.6% | 1.8%(-0.209)#259 | 2.1%(-0.582)#15,674 |
| 12. | 67202 | 1.6% | 1.8%(-0.221)#260 | 2.1%(-0.594)#15,770 |
| 13. | 67203 | 1.5% | 1.8%(-0.234)#264 | 2.1%(-0.607)#15,870 |
| 14. | 67226 | 1.4% | 1.8%(-0.418)#289 | 2.1%(-0.791)#17,283 |
| 15. | 67220 | 1.3% | 1.8%(-0.477)#301 | 2.1%(-0.851)#17,749 |
| 16. | 67211 | 1.1% | 1.8%(-0.646)#325 | 2.1%(-1.02)#19,065 |
| 17. | 67207 | 1.1% | 1.8%(-0.721)#342 | 2.1%(-1.09)#19,625 |
| 18. | 67228 | 1.0% | 1.8%(-0.749)#347 | 2.1%(-1.12)#19,833 |
| 19. | 67230 | 0.88% | 1.8%(-0.892)#369 | 2.1%(-1.27)#20,900 |
| 20. | 67216 | 0.81% | 1.8%(-0.967)#379 | 2.1%(-1.34)#21,363 |
| 21. | 67208 | 0.70% | 1.8%(-1.08)#397 | 2.1%(-1.45)#22,109 |
| 22. | 67206 | 0.66% | 1.8%(-1.11)#404 | 2.1%(-1.49)#22,317 |
| 23. | 67204 | 0.62% | 1.8%(-1.15)#408 | 2.1%(-1.52)#22,523 |
| 24. | 67213 | 0.47% | 1.8%(-1.30)#427 | 2.1%(-1.67)#23,374 |
1
Common Questions
What are the Top 10 Zip Codes with the Highest Percentage of Population Employed in Security & Protection in Wichita, KS?
Top 10 Zip Codes with the Highest Percentage of Population Employed in Security & Protection in Wichita, KS are:
What zip code has the Highest Percentage of Population Employed in Security & Protection in Wichita, KS?
67223 has the Highest Percentage of Population Employed in Security & Protection in Wichita, KS with 5.4%.
What is the Percentage of Population Employed in Security & Protection in Wichita, KS?
Percentage of Population Employed in Security & Protection in Wichita is 1.7%.
What is the Percentage of Population Employed in Security & Protection in Kansas?
Percentage of Population Employed in Security & Protection in Kansas is 1.8%.
What is the Percentage of Population Employed in Security & Protection in the United States?
Percentage of Population Employed in Security & Protection in the United States is 2.1%.