Zip Codes with the Highest Percentage of Population with a Degree in Business in Wichita, KS
RELATED REPORTS & OPTIONS
Business
Wichita
Compare Zip Codes
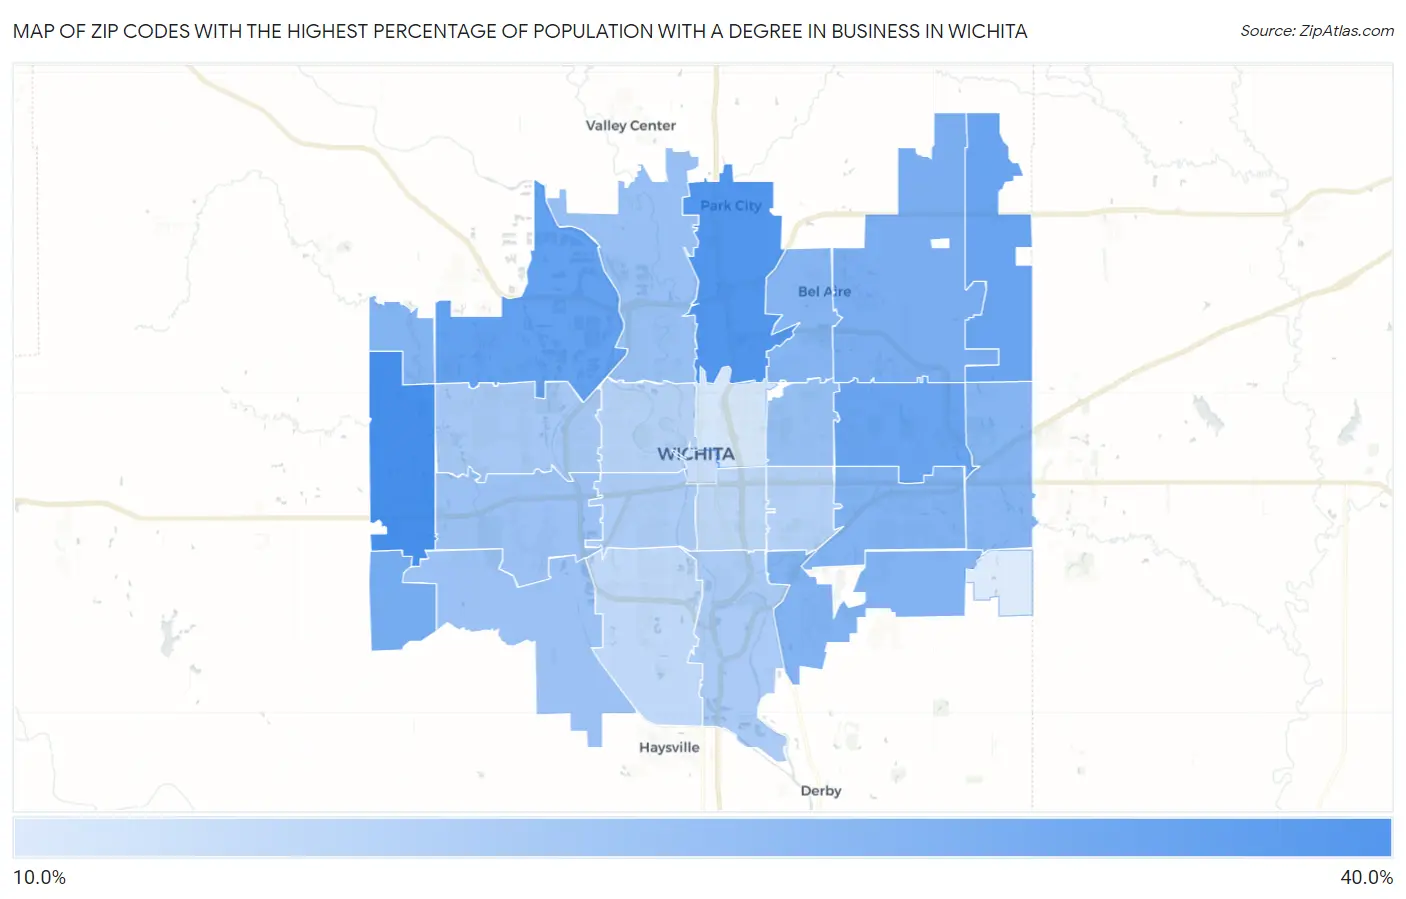
Map of Zip Codes with the Highest Percentage of Population with a Degree in Business in Wichita
12.3%
33.3%
Zip Codes with the Highest Percentage of Population with a Degree in Business in Wichita, KS
| Zip Code | % Graduates | vs State | vs National | |
| 1. | 67235 | 33.3% | 21.0%(+12.2)#48 | 19.5%(+13.8)#2,050 |
| 2. | 67219 | 31.4% | 21.0%(+10.4)#58 | 19.5%(+11.9)#2,418 |
| 3. | 67205 | 29.0% | 21.0%(+8.02)#70 | 19.5%(+9.54)#3,188 |
| 4. | 67228 | 28.2% | 21.0%(+7.15)#80 | 19.5%(+8.66)#3,592 |
| 5. | 67206 | 28.1% | 21.0%(+7.07)#82 | 19.5%(+8.58)#3,634 |
| 6. | 67227 | 26.5% | 21.0%(+5.52)#98 | 19.5%(+7.03)#4,526 |
| 7. | 67226 | 25.8% | 21.0%(+4.82)#108 | 19.5%(+6.33)#4,990 |
| 8. | 67210 | 24.9% | 21.0%(+3.91)#117 | 19.5%(+5.43)#5,756 |
| 9. | 67207 | 24.8% | 21.0%(+3.82)#118 | 19.5%(+5.33)#5,845 |
| 10. | 67223 | 24.4% | 21.0%(+3.43)#126 | 19.5%(+4.95)#6,181 |
| 11. | 67230 | 24.2% | 21.0%(+3.22)#132 | 19.5%(+4.73)#6,376 |
| 12. | 67220 | 24.1% | 21.0%(+3.07)#135 | 19.5%(+4.59)#6,520 |
| 13. | 67208 | 21.9% | 21.0%(+0.880)#182 | 19.5%(+2.39)#8,963 |
| 14. | 67204 | 21.4% | 21.0%(+0.380)#188 | 19.5%(+1.89)#9,625 |
| 15. | 67215 | 21.3% | 21.0%(+0.282)#192 | 19.5%(+1.80)#9,747 |
| 16. | 67209 | 21.0% | 21.0%(-0.034)#204 | 19.5%(+1.48)#10,187 |
| 17. | 67212 | 19.7% | 21.0%(-1.28)#232 | 19.5%(+0.236)#12,017 |
| 18. | 67216 | 19.2% | 21.0%(-1.85)#247 | 19.5%(-0.339)#12,889 |
| 19. | 67213 | 18.7% | 21.0%(-2.27)#260 | 19.5%(-0.758)#13,531 |
| 20. | 67218 | 17.9% | 21.0%(-3.12)#275 | 19.5%(-1.61)#14,740 |
| 21. | 67203 | 17.4% | 21.0%(-3.58)#290 | 19.5%(-2.06)#15,443 |
| 22. | 67211 | 16.4% | 21.0%(-4.59)#319 | 19.5%(-3.08)#17,008 |
| 23. | 67217 | 16.3% | 21.0%(-4.70)#321 | 19.5%(-3.18)#17,170 |
| 24. | 67202 | 14.9% | 21.0%(-6.10)#358 | 19.5%(-4.59)#19,094 |
| 25. | 67214 | 13.3% | 21.0%(-7.68)#403 | 19.5%(-6.17)#21,036 |
| 26. | 67232 | 12.3% | 21.0%(-8.67)#435 | 19.5%(-7.16)#22,143 |
1
Common Questions
What are the Top 10 Zip Codes with the Highest Percentage of Population with a Degree in Business in Wichita, KS?
Top 10 Zip Codes with the Highest Percentage of Population with a Degree in Business in Wichita, KS are:
What zip code has the Highest Percentage of Population with a Degree in Business in Wichita, KS?
67235 has the Highest Percentage of Population with a Degree in Business in Wichita, KS with 33.3%.
What is the Percentage of Population with a Degree in Business in Wichita, KS?
Percentage of Population with a Degree in Business in Wichita is 23.1%.
What is the Percentage of Population with a Degree in Business in Kansas?
Percentage of Population with a Degree in Business in Kansas is 21.0%.
What is the Percentage of Population with a Degree in Business in the United States?
Percentage of Population with a Degree in Business in the United States is 19.5%.