Zip Codes with the Highest Percentage of Households with Income Below $10,000 in Topeka, KS
RELATED REPORTS & OPTIONS
Household Income | $0-10k
Topeka
Compare Zip Codes
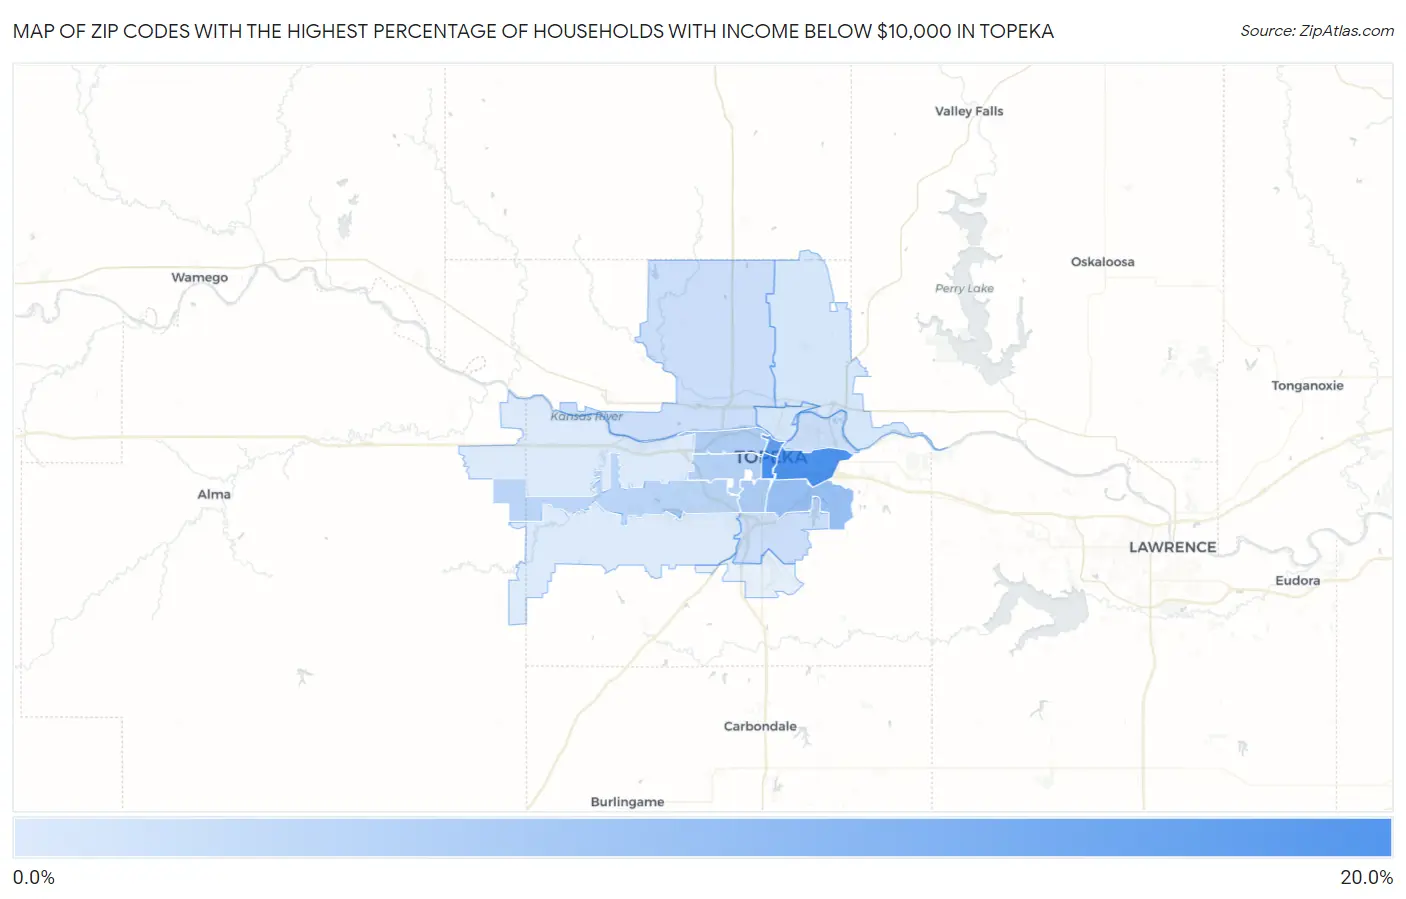
Map of Zip Codes with the Highest Percentage of Households with Income Below $10,000 in Topeka
2.1%
17.3%
Zip Codes with the Highest Percentage of Households with Income Below $10,000 in Topeka, KS
| Zip Code | Households with Income < $10k | vs State | vs National | |
| 1. | 66612 | 17.3% | 4.5%(+12.8)#17 | 4.9%(+12.4)#1,116 |
| 2. | 66607 | 16.9% | 4.5%(+12.4)#18 | 4.9%(+12.0)#1,169 |
| 3. | 66603 | 14.6% | 4.5%(+10.1)#25 | 4.9%(+9.70)#1,630 |
| 4. | 66605 | 8.8% | 4.5%(+4.30)#63 | 4.9%(+3.90)#4,618 |
| 5. | 66611 | 6.8% | 4.5%(+2.30)#117 | 4.9%(+1.90)#7,376 |
| 6. | 66606 | 6.6% | 4.5%(+2.10)#126 | 4.9%(+1.70)#7,764 |
| 7. | 66604 | 5.8% | 4.5%(+1.30)#167 | 4.9%(+0.900)#9,497 |
| 8. | 66614 | 5.5% | 4.5%(+1.00)#176 | 4.9%(+0.600)#10,220 |
| 9. | 66618 | 3.9% | 4.5%(-0.600)#284 | 4.9%(-1.00)#15,735 |
| 10. | 66609 | 3.9% | 4.5%(-0.600)#286 | 4.9%(-1.00)#15,760 |
| 11. | 66616 | 3.9% | 4.5%(-0.600)#287 | 4.9%(-1.00)#15,774 |
| 12. | 66617 | 2.7% | 4.5%(-1.80)#395 | 4.9%(-2.20)#20,809 |
| 13. | 66608 | 2.7% | 4.5%(-1.80)#396 | 4.9%(-2.20)#20,854 |
| 14. | 66615 | 2.2% | 4.5%(-2.30)#444 | 4.9%(-2.70)#23,046 |
| 15. | 66610 | 2.1% | 4.5%(-2.40)#457 | 4.9%(-2.80)#23,317 |
1
Common Questions
What are the Top 10 Zip Codes with the Highest Percentage of Households with Income Below $10,000 in Topeka, KS?
Top 10 Zip Codes with the Highest Percentage of Households with Income Below $10,000 in Topeka, KS are:
What zip code has the Highest Percentage of Households with Income Below $10,000 in Topeka, KS?
66612 has the Highest Percentage of Households with Income Below $10,000 in Topeka, KS with 17.3%.
What is the Percentage of Households with Income Below $10,000 in Topeka, KS?
Percentage of Households with Income Below $10,000 in Topeka is 7.2%.
What is the Percentage of Households with Income Below $10,000 in Kansas?
Percentage of Households with Income Below $10,000 in Kansas is 4.5%.
What is the Percentage of Households with Income Below $10,000 in the United States?
Percentage of Households with Income Below $10,000 in the United States is 4.9%.