Zip Codes with the Largest French Community in Wichita, KS

RELATED REPORTS & OPTIONS

French
Population
Families and Households
Female Fertility
Female Fertility (Unmarried)
Race (Community Size)
Race (Percentage)
Ancestry (Community Size)
AfricanAlaska NativeAmericanApacheArabArapahoArgentineanArmenianAustralianAustrianBangladeshiBarbadianBelgianBhutaneseBlackfeetBolivianBrazilianBritishBulgarianBurmeseCajunCanadianCelticCentral AmericanCentral American IndianCherokeeCheyenneChickasawChileanChippewaChoctawColombianComancheCosta RicanCreekCroatianCubanCzechCzechoslovakianDanishDelawareDominicanDutchDutch West IndianEastern EuropeanEcuadorianEgyptianEnglishEthiopianEuropeanFilipinoFinnishFrenchFrench American IndianFrench CanadianGermanGerman RussianGhanaianGreekGuamanian / ChamorroGuatemalanHaitianHonduranHungarianIcelanderIndian (Asian)IndonesianInupiatIranianIrishIroquoisItalianJamaicanJapaneseJordanianKenyanKiowaKoreanLaotianLebaneseLithuanianLuxembourgerMalaysianMexicanMexican American IndianMongolianMoroccanNative HawaiianNavajoNicaraguanNigerianNorthern EuropeanNorwegianOsageOttawaPakistaniPalestinianPanamanianParaguayanPennsylvania GermanPeruvianPimaPolishPortuguesePotawatomiPuebloPuerto RicanRomanianRussianSalvadoranSamoanScandinavianScotch-IrishScottishSeminoleSiouxSlavicSlovakSloveneSouth AfricanSouth AmericanSpaniardSpanishSpanish AmericanSpanish American IndianSri LankanSubsaharan AfricanSwedishSwissSyrianThaiTrinidadian and TobagonianTurkishUgandanUkrainianVenezuelanWelshWest IndianYugoslavian
Ancestry (Percentage)
AfricanAlaska NativeAmericanApacheArabArapahoArgentineanArmenianAustralianAustrianBangladeshiBarbadianBelgianBhutaneseBlackfeetBolivianBrazilianBritishBulgarianBurmeseCajunCanadianCelticCentral AmericanCentral American IndianCherokeeCheyenneChickasawChileanChippewaChoctawColombianComancheCosta RicanCreekCroatianCubanCzechCzechoslovakianDanishDelawareDominicanDutchDutch West IndianEastern EuropeanEcuadorianEgyptianEnglishEthiopianEuropeanFilipinoFinnishFrenchFrench American IndianFrench CanadianGermanGerman RussianGhanaianGreekGuamanian / ChamorroGuatemalanHaitianHonduranHungarianIcelanderIndian (Asian)IndonesianInupiatIranianIrishIroquoisItalianJamaicanJapaneseJordanianKenyanKiowaKoreanLaotianLebaneseLithuanianLuxembourgerMalaysianMexicanMexican American IndianMongolianMoroccanNative HawaiianNavajoNicaraguanNigerianNorthern EuropeanNorwegianOsageOttawaPakistaniPalestinianPanamanianParaguayanPennsylvania GermanPeruvianPimaPolishPortuguesePotawatomiPuebloPuerto RicanRomanianRussianSalvadoranSamoanScandinavianScotch-IrishScottishSeminoleSiouxSlavicSlovakSloveneSouth AfricanSouth AmericanSpaniardSpanishSpanish AmericanSpanish American IndianSri LankanSubsaharan AfricanSwedishSwissSyrianThaiTrinidadian and TobagonianTurkishUgandanUkrainianVenezuelanWelshWest IndianYugoslavian
Immigrant Origin (Total)
Immigrant Origin (Percentage)
Income
Income (Families)
Income (Households)
Poverty
Poverty (Families)
Unemployment
Employment Occupations
Employment Industries
Employer Class
Commute Time
Commute Means
School Enrollment
Education by Degree Field
Occupancy
Finances
Physical Characteristics
Wichita
Compare Zip Codes
Comparison Subject

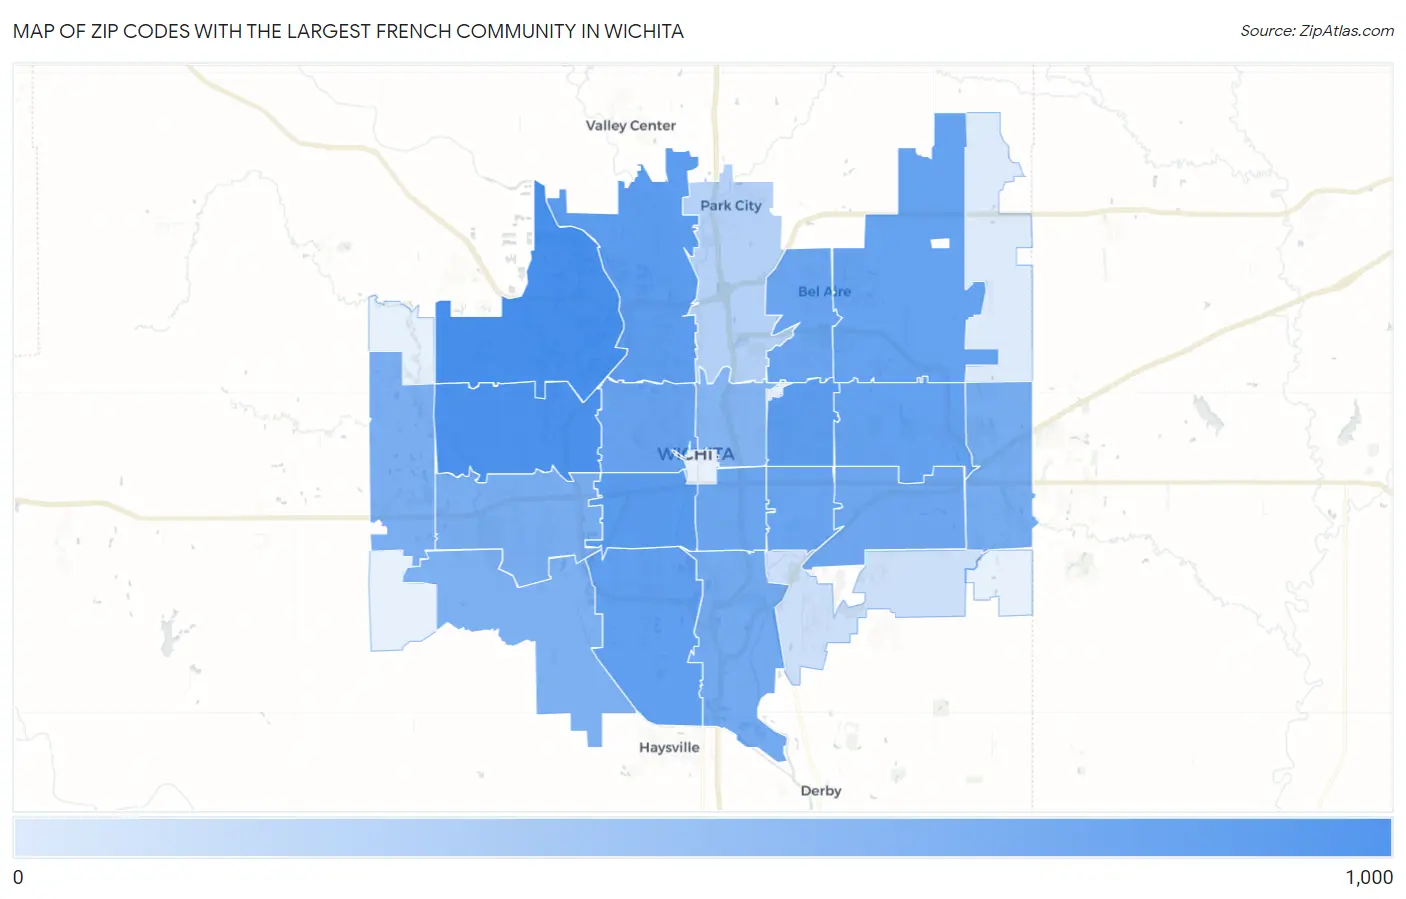
Map of Zip Codes with the Largest French Community in Wichita

0
1,000
Zip Codes with the Largest French Community in Wichita Map

Zip Codes with the Largest French Community in Wichita, KS

Zip Code French vs State vs National
1.6720597861,088(1.60%)#46,841,915(0.01%)#1,406
2.6721288161,088(1.44%)#66,841,915(0.01%)#1,767
3.6721359761,088(0.98%)#206,841,915(0.01%)#3,508
4.6720855361,088(0.91%)#256,841,915(0.01%)#3,867
5.6720452961,088(0.87%)#286,841,915(0.01%)#4,097
6.6721747161,088(0.77%)#356,841,915(0.01%)#4,739
7.6720643061,088(0.70%)#406,841,915(0.01%)#5,213
8.6722641561,088(0.68%)#456,841,915(0.01%)#5,403
9.6720337961,088(0.62%)#496,841,915(0.01%)#5,884
10.6722035061,088(0.57%)#586,841,915(0.01%)#6,307
11.6721834261,088(0.56%)#606,841,915(0.00%)#6,435
12.6721133961,088(0.55%)#616,841,915(0.00%)#6,481
13.6720731561,088(0.52%)#696,841,915(0.00%)#6,873
14.6721627561,088(0.45%)#726,841,915(0.00%)#7,525
15.6723024461,088(0.40%)#806,841,915(0.00%)#8,162
16.6720923361,088(0.38%)#826,841,915(0.00%)#8,387
17.6723521461,088(0.35%)#896,841,915(0.00%)#8,789
18.6721521161,088(0.35%)#916,841,915(0.00%)#8,872
19.6721417161,088(0.28%)#1036,841,915(0.00%)#9,905
20.672194161,088(0.07%)#2316,841,915(0.00%)#17,101
21.672101861,088(0.03%)#3446,841,915(0.00%)#20,809
22.672281161,088(0.02%)#4106,841,915(0.00%)#22,700

Common Questions

What are the Top 10 Zip Codes with the Largest French Community in Wichita, KS?
Top 10 Zip Codes with the Largest French Community in Wichita, KS are:
#1
978
#2
881
#3
597
#4
553
#5
529
#6
471
#7
430
#8
415
#9
379
#10
350
What zip code has the Largest French Community in Wichita, KS?
67205 has the Largest French Community in Wichita, KS with 978.
What is the Total French Population in Wichita, KS?
Total French Population in Wichita is 7,693.
What is the Total French Population in Kansas?
Total French Population in Kansas is 61,088.
What is the Total French Population in the United States?
Total French Population in the United States is 6,841,915.