Zip Codes with the Highest Percentage of Population Employed in Computer, Engineering & Science in Wichita, KS
RELATED REPORTS & OPTIONS
Computer, Engineering & Science
Wichita
Compare Zip Codes
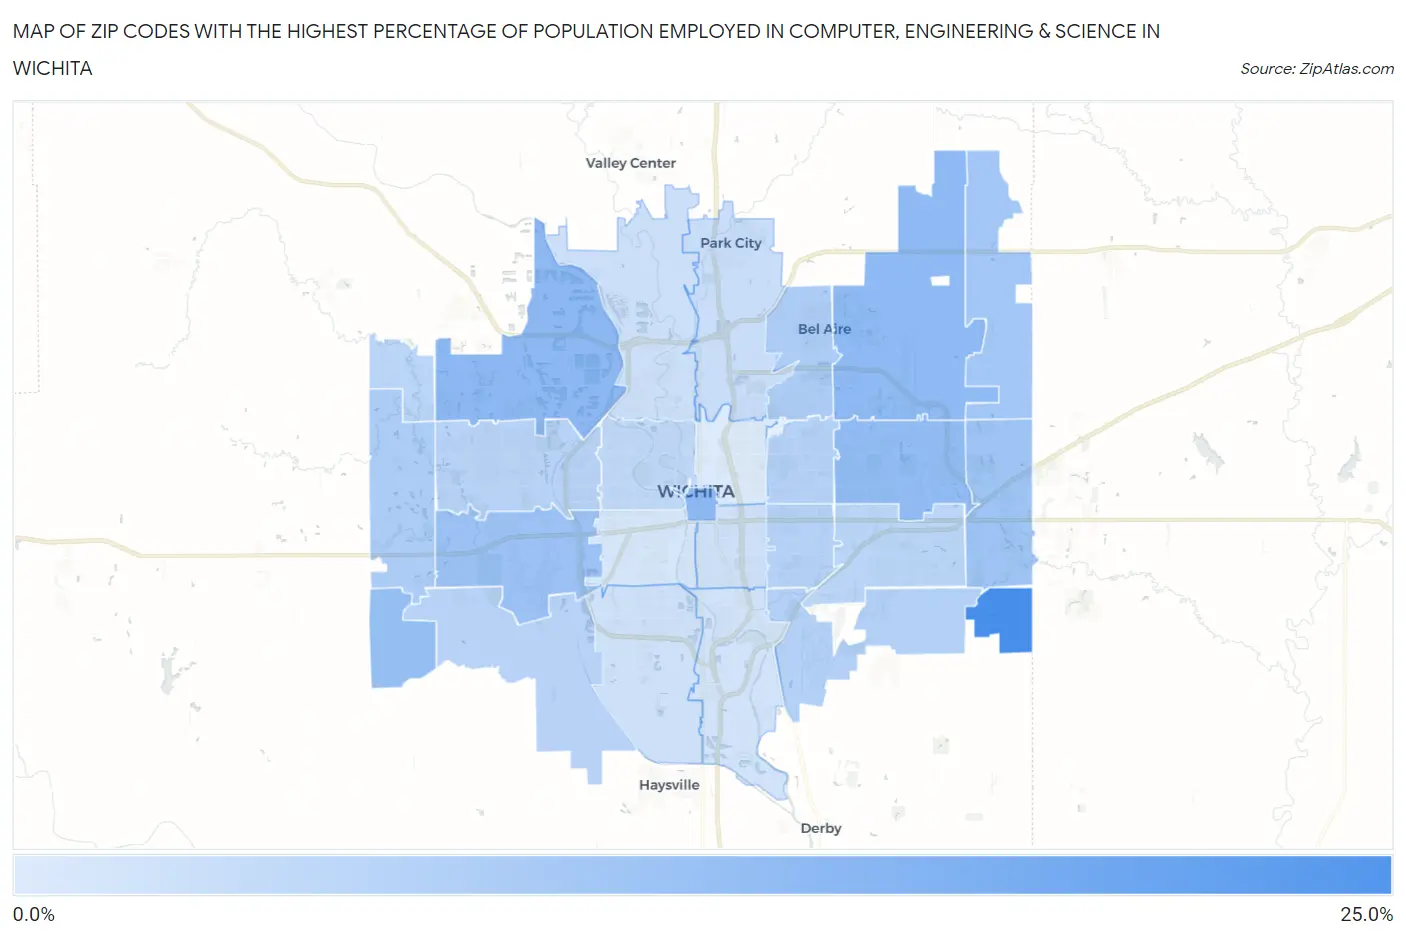
Map of Zip Codes with the Highest Percentage of Population Employed in Computer, Engineering & Science in Wichita
0.88%
22.0%
Zip Codes with the Highest Percentage of Population Employed in Computer, Engineering & Science in Wichita, KS
| Zip Code | % Employed | vs State | vs National | |
| 1. | 67232 | 22.0% | 6.0%(+16.0)#4 | 6.8%(+15.2)#390 |
| 2. | 67202 | 11.7% | 6.0%(+5.78)#26 | 6.8%(+4.98)#2,152 |
| 3. | 67205 | 11.7% | 6.0%(+5.71)#28 | 6.8%(+4.91)#2,192 |
| 4. | 67226 | 11.3% | 6.0%(+5.30)#34 | 6.8%(+4.50)#2,429 |
| 5. | 67206 | 11.0% | 6.0%(+5.01)#35 | 6.8%(+4.21)#2,588 |
| 6. | 67227 | 10.6% | 6.0%(+4.61)#40 | 6.8%(+3.81)#2,814 |
| 7. | 67209 | 9.3% | 6.0%(+3.38)#49 | 6.8%(+2.58)#3,743 |
| 8. | 67230 | 9.2% | 6.0%(+3.27)#50 | 6.8%(+2.47)#3,834 |
| 9. | 67228 | 8.6% | 6.0%(+2.66)#64 | 6.8%(+1.86)#4,451 |
| 10. | 67220 | 7.4% | 6.0%(+1.46)#90 | 6.8%(+0.657)#6,121 |
| 11. | 67235 | 7.1% | 6.0%(+1.18)#95 | 6.8%(+0.373)#6,570 |
| 12. | 67210 | 6.2% | 6.0%(+0.220)#126 | 6.8%(-0.583)#8,393 |
| 13. | 67208 | 6.1% | 6.0%(+0.152)#129 | 6.8%(-0.651)#8,554 |
| 14. | 67218 | 6.0% | 6.0%(+0.011)#137 | 6.8%(-0.792)#8,902 |
| 15. | 67212 | 5.9% | 6.0%(-0.099)#144 | 6.8%(-0.902)#9,161 |
| 16. | 67215 | 5.7% | 6.0%(-0.306)#154 | 6.8%(-1.11)#9,658 |
| 17. | 67223 | 5.4% | 6.0%(-0.518)#165 | 6.8%(-1.32)#10,203 |
| 18. | 67207 | 5.3% | 6.0%(-0.708)#171 | 6.8%(-1.51)#10,688 |
| 19. | 67203 | 4.3% | 6.0%(-1.61)#206 | 6.8%(-2.42)#13,330 |
| 20. | 67219 | 3.7% | 6.0%(-2.25)#244 | 6.8%(-3.06)#15,428 |
| 21. | 67204 | 2.9% | 6.0%(-3.07)#298 | 6.8%(-3.87)#18,525 |
| 22. | 67217 | 2.8% | 6.0%(-3.16)#308 | 6.8%(-3.96)#18,853 |
| 23. | 67211 | 2.7% | 6.0%(-3.29)#317 | 6.8%(-4.10)#19,371 |
| 24. | 67216 | 2.4% | 6.0%(-3.56)#337 | 6.8%(-4.36)#20,392 |
| 25. | 67213 | 1.9% | 6.0%(-4.10)#385 | 6.8%(-4.90)#22,375 |
| 26. | 67214 | 0.88% | 6.0%(-5.09)#471 | 6.8%(-5.89)#25,382 |
1
Common Questions
What are the Top 10 Zip Codes with the Highest Percentage of Population Employed in Computer, Engineering & Science in Wichita, KS?
Top 10 Zip Codes with the Highest Percentage of Population Employed in Computer, Engineering & Science in Wichita, KS are:
What zip code has the Highest Percentage of Population Employed in Computer, Engineering & Science in Wichita, KS?
67232 has the Highest Percentage of Population Employed in Computer, Engineering & Science in Wichita, KS with 22.0%.
What is the Percentage of Population Employed in Computer, Engineering & Science in Wichita, KS?
Percentage of Population Employed in Computer, Engineering & Science in Wichita is 5.8%.
What is the Percentage of Population Employed in Computer, Engineering & Science in Kansas?
Percentage of Population Employed in Computer, Engineering & Science in Kansas is 6.0%.
What is the Percentage of Population Employed in Computer, Engineering & Science in the United States?
Percentage of Population Employed in Computer, Engineering & Science in the United States is 6.8%.