Zip Codes with the Lowest Poverty Level in Wichita, KS

RELATED REPORTS & OPTIONS

Lowest Poverty
Population
Families and Households
Female Fertility
Female Fertility (Unmarried)
Race (Community Size)
Race (Percentage)
Ancestry (Community Size)
AfricanAlaska NativeAmericanApacheArabArapahoArgentineanArmenianAustralianAustrianBangladeshiBarbadianBelgianBhutaneseBlackfeetBolivianBrazilianBritishBulgarianBurmeseCajunCanadianCelticCentral AmericanCentral American IndianCherokeeCheyenneChickasawChileanChippewaChoctawColombianComancheCosta RicanCreekCroatianCubanCzechCzechoslovakianDanishDelawareDominicanDutchDutch West IndianEastern EuropeanEcuadorianEgyptianEnglishEthiopianEuropeanFilipinoFinnishFrenchFrench American IndianFrench CanadianGermanGerman RussianGhanaianGreekGuamanian / ChamorroGuatemalanHaitianHonduranHungarianIcelanderIndian (Asian)IndonesianInupiatIranianIrishIroquoisItalianJamaicanJapaneseJordanianKenyanKiowaKoreanLaotianLebaneseLithuanianLuxembourgerMalaysianMexicanMexican American IndianMongolianMoroccanNative HawaiianNavajoNicaraguanNigerianNorthern EuropeanNorwegianOsageOttawaPakistaniPalestinianPanamanianParaguayanPennsylvania GermanPeruvianPimaPolishPortuguesePotawatomiPuebloPuerto RicanRomanianRussianSalvadoranSamoanScandinavianScotch-IrishScottishSeminoleSiouxSlavicSlovakSloveneSouth AfricanSouth AmericanSpaniardSpanishSpanish AmericanSpanish American IndianSri LankanSubsaharan AfricanSwedishSwissSyrianThaiTrinidadian and TobagonianTurkishUgandanUkrainianVenezuelanWelshWest IndianYugoslavian
Ancestry (Percentage)
AfricanAlaska NativeAmericanApacheArabArapahoArgentineanArmenianAustralianAustrianBangladeshiBarbadianBelgianBhutaneseBlackfeetBolivianBrazilianBritishBulgarianBurmeseCajunCanadianCelticCentral AmericanCentral American IndianCherokeeCheyenneChickasawChileanChippewaChoctawColombianComancheCosta RicanCreekCroatianCubanCzechCzechoslovakianDanishDelawareDominicanDutchDutch West IndianEastern EuropeanEcuadorianEgyptianEnglishEthiopianEuropeanFilipinoFinnishFrenchFrench American IndianFrench CanadianGermanGerman RussianGhanaianGreekGuamanian / ChamorroGuatemalanHaitianHonduranHungarianIcelanderIndian (Asian)IndonesianInupiatIranianIrishIroquoisItalianJamaicanJapaneseJordanianKenyanKiowaKoreanLaotianLebaneseLithuanianLuxembourgerMalaysianMexicanMexican American IndianMongolianMoroccanNative HawaiianNavajoNicaraguanNigerianNorthern EuropeanNorwegianOsageOttawaPakistaniPalestinianPanamanianParaguayanPennsylvania GermanPeruvianPimaPolishPortuguesePotawatomiPuebloPuerto RicanRomanianRussianSalvadoranSamoanScandinavianScotch-IrishScottishSeminoleSiouxSlavicSlovakSloveneSouth AfricanSouth AmericanSpaniardSpanishSpanish AmericanSpanish American IndianSri LankanSubsaharan AfricanSwedishSwissSyrianThaiTrinidadian and TobagonianTurkishUgandanUkrainianVenezuelanWelshWest IndianYugoslavian
Immigrant Origin (Total)
Immigrant Origin (Percentage)
Income
Income (Families)
Income (Households)
Poverty
Poverty (Families)
Unemployment
Employment Occupations
Employment Industries
Employer Class
Commute Time
Commute Means
School Enrollment
Education by Degree Field
Occupancy
Finances
Physical Characteristics
Wichita
Compare Zip Codes
Comparison Subject

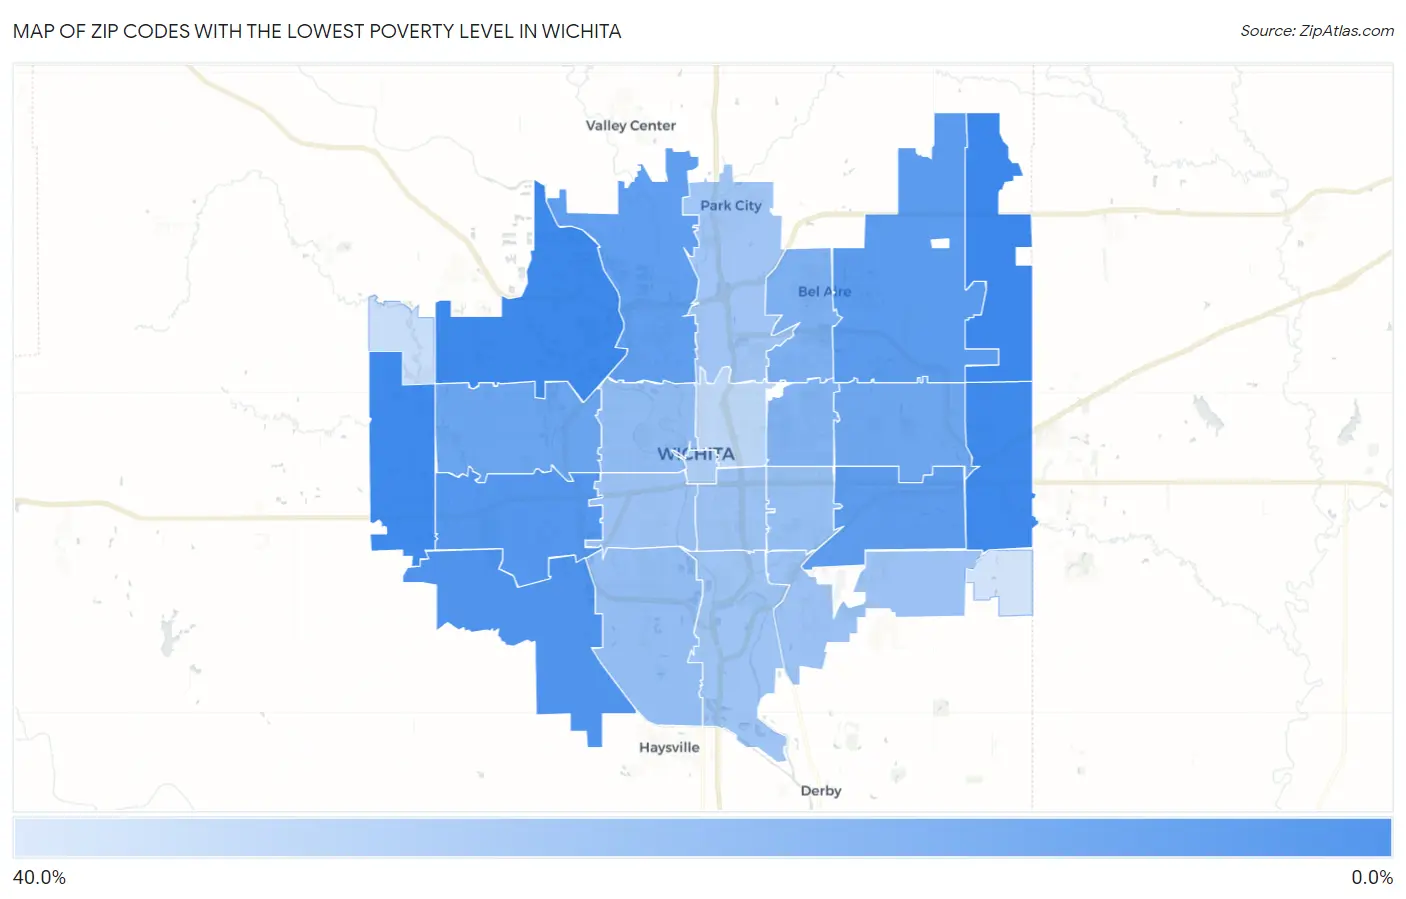
Map of Zip Codes with the Lowest Poverty Level in Wichita

40.0%
0.0%
Zip Codes with the Lowest Poverty Level in Wichita Map

Zip Codes with the Lowest Poverty Level in Wichita, KS

Zip Code Poverty vs State vs National
1.672281.4%11.6%(-10.2)#1312.5%(-11.2)#380
2.672051.6%11.6%(-9.95)#2012.5%(-10.9)#539
3.672352.3%11.6%(-9.24)#3612.5%(-10.2)#1,084
4.672302.3%11.6%(-9.24)#3712.5%(-10.2)#1,086
5.672155.0%11.6%(-6.60)#13812.5%(-7.55)#4,792
6.672096.9%11.6%(-4.64)#22812.5%(-5.60)#8,242
7.672268.4%11.6%(-3.17)#28212.5%(-4.12)#10,942
8.672078.7%11.6%(-2.93)#29312.5%(-3.88)#11,395
9.672049.0%11.6%(-2.58)#30712.5%(-3.53)#12,032
10.6721211.9%11.6%(+0.325)#40012.5%(-0.629)#16,778
11.6720612.4%11.6%(+0.797)#41012.5%(-0.157)#17,456
12.6722015.8%11.6%(+4.22)#50212.5%(+3.27)#21,617
13.6720816.4%11.6%(+4.80)#52012.5%(+3.85)#22,221
14.6720320.5%11.6%(+8.93)#58212.5%(+7.97)#25,427
15.6721720.8%11.6%(+9.21)#58412.5%(+8.26)#25,612
16.6721821.7%11.6%(+10.1)#59212.5%(+9.15)#26,141
17.6721323.2%11.6%(+11.6)#60612.5%(+10.6)#26,828
18.6721023.5%11.6%(+11.9)#60712.5%(+10.9)#26,945
19.6721123.5%11.6%(+11.9)#60812.5%(+10.9)#26,959
20.6721623.8%11.6%(+12.2)#61112.5%(+11.2)#27,065
21.6721924.7%11.6%(+13.1)#61712.5%(+12.1)#27,402
22.6720227.5%11.6%(+16.0)#63012.5%(+15.0)#28,285
23.6721432.1%11.6%(+20.5)#64712.5%(+19.5)#29,184
24.6722334.5%11.6%(+22.9)#65412.5%(+22.0)#29,582
25.6723237.3%11.6%(+25.7)#65912.5%(+24.7)#29,897

Common Questions

What are the Top 10 Zip Codes with the Lowest Poverty Level in Wichita, KS?
Top 10 Zip Codes with the Lowest Poverty Level in Wichita, KS are:
#1
1.4%
#2
1.6%
#3
2.3%
#4
2.3%
#5
5.0%
#6
6.9%
#7
8.4%
#8
8.7%
#9
9.0%
#10
11.9%
What zip code has the Lowest Poverty Level in Wichita, KS?
67228 has the Lowest Poverty Level in Wichita, KS with 1.4%.
What is the Poverty Level in Wichita, KS?
Poverty Level in Wichita is 15.5%.
What is the Poverty Level in Kansas?
Poverty Level in Kansas is 11.6%.
What is the Poverty Level in the United States?
Poverty Level in the United States is 12.5%.