Zip Codes with the Highest Percentage of Households with Income Below $10,000 in Mission, KS
RELATED REPORTS & OPTIONS
Household Income | $0-10k
Mission
Compare Zip Codes
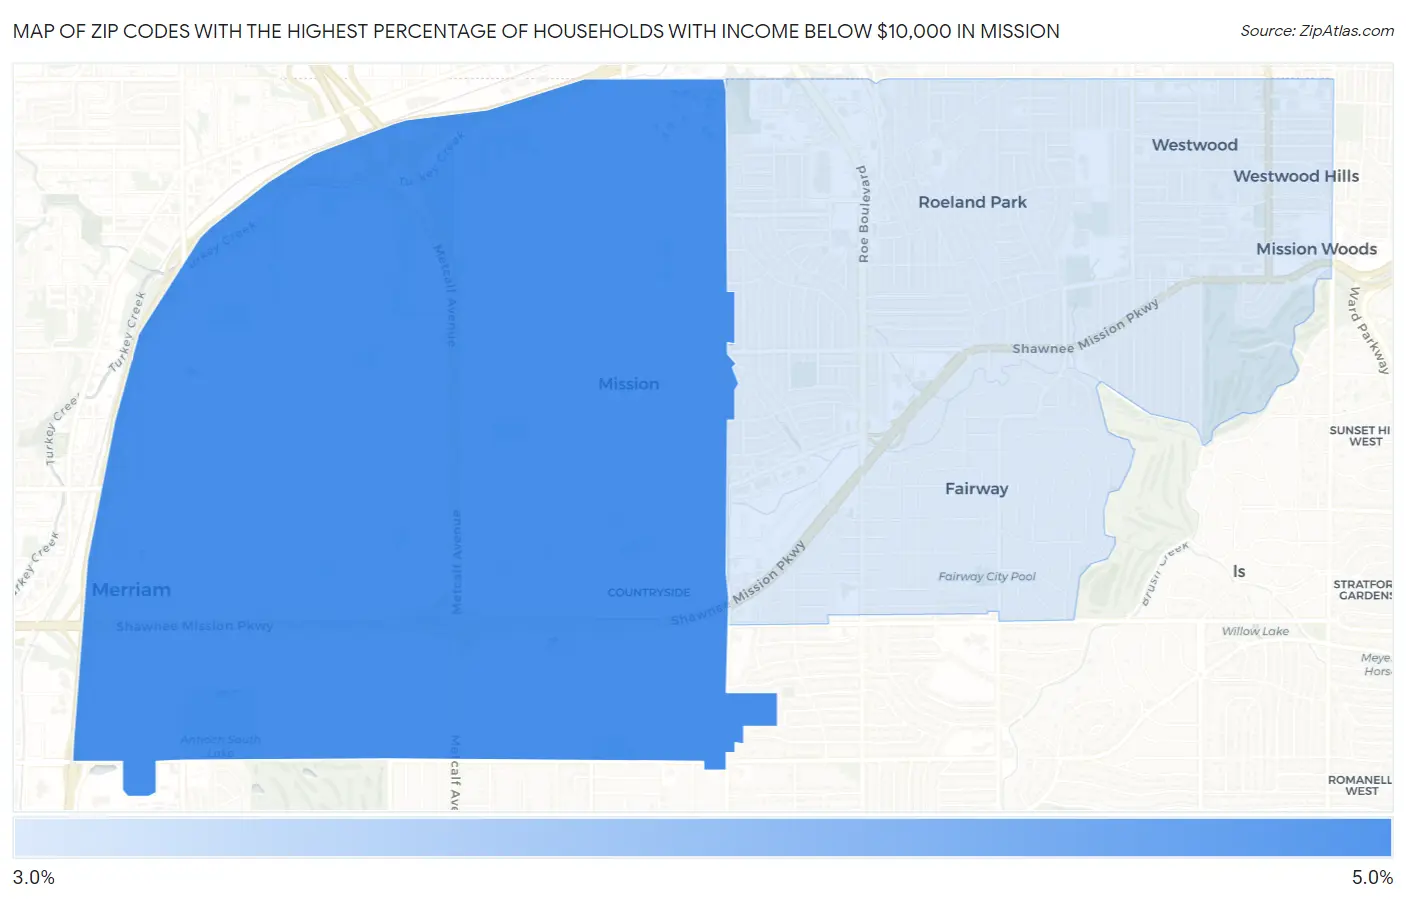
Map of Zip Codes with the Highest Percentage of Households with Income Below $10,000 in Mission
3.1%
5.0%
Zip Codes with the Highest Percentage of Households with Income Below $10,000 in Mission, KS
| Zip Code | Households with Income < $10k | vs State | vs National | |
| 1. | 66202 | 5.0% | 4.5%(+0.500)#211 | 4.9%(+0.100)#11,736 |
| 2. | 66205 | 3.1% | 4.5%(-1.40)#361 | 4.9%(-1.80)#18,987 |
1
Common Questions
What are the Top Zip Codes with the Highest Percentage of Households with Income Below $10,000 in Mission, KS?
Top Zip Codes with the Highest Percentage of Households with Income Below $10,000 in Mission, KS are:
What zip code has the Highest Percentage of Households with Income Below $10,000 in Mission, KS?
66202 has the Highest Percentage of Households with Income Below $10,000 in Mission, KS with 5.0%.
What is the Percentage of Households with Income Below $10,000 in Mission, KS?
Percentage of Households with Income Below $10,000 in Mission is 5.8%.
What is the Percentage of Households with Income Below $10,000 in Kansas?
Percentage of Households with Income Below $10,000 in Kansas is 4.5%.
What is the Percentage of Households with Income Below $10,000 in the United States?
Percentage of Households with Income Below $10,000 in the United States is 4.9%.