Zip Codes with the Highest Percentage of Population with a Degree in Computers and Mathematics in Wichita, KS
RELATED REPORTS & OPTIONS
Computers and Mathematics
Wichita
Compare Zip Codes
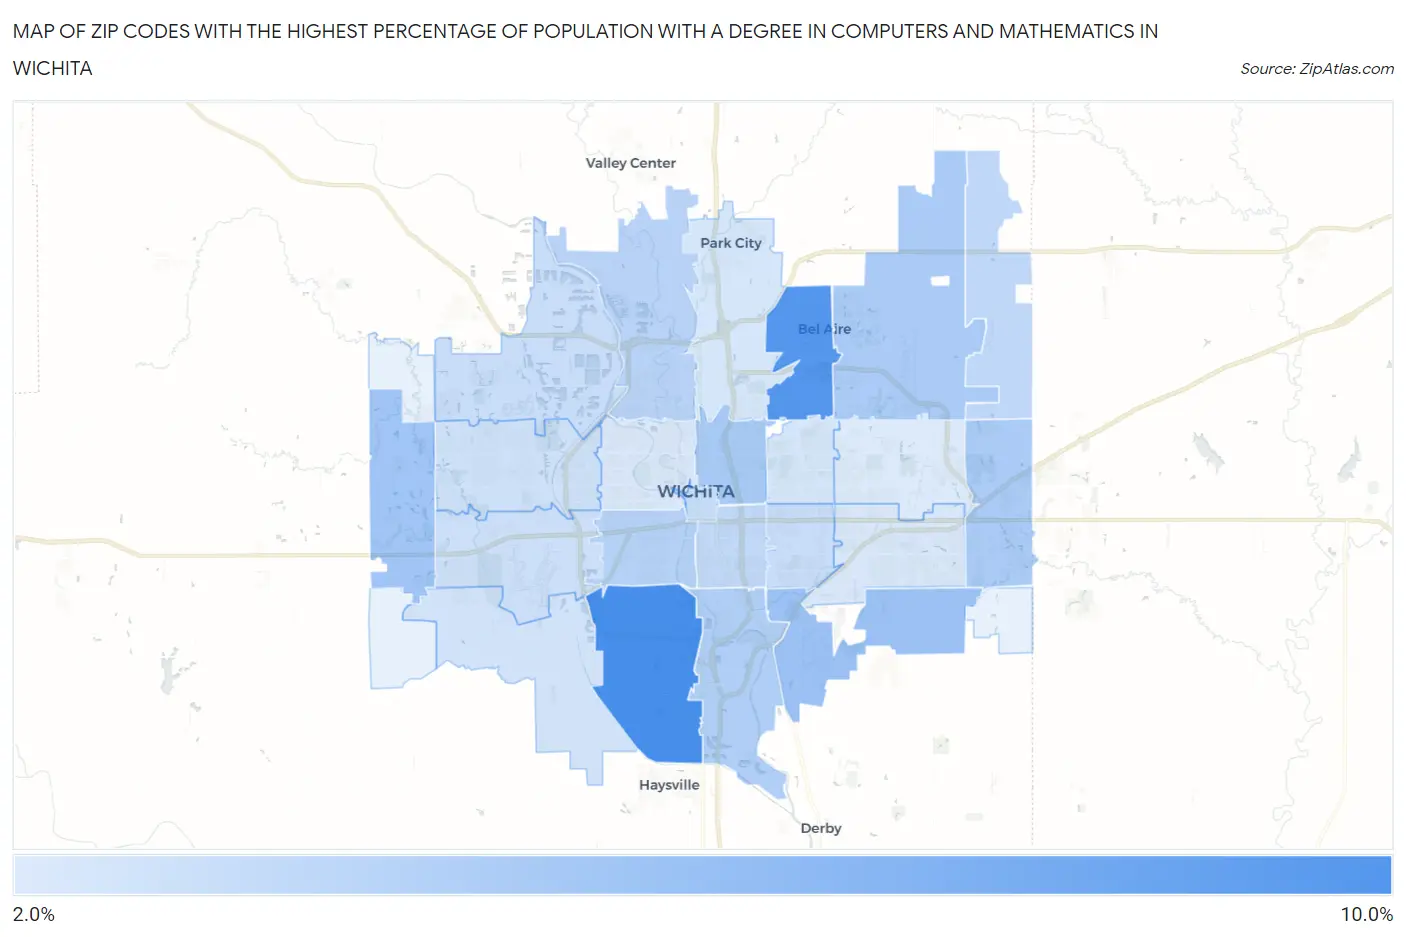
Map of Zip Codes with the Highest Percentage of Population with a Degree in Computers and Mathematics in Wichita
2.3%
8.6%
Zip Codes with the Highest Percentage of Population with a Degree in Computers and Mathematics in Wichita, KS
| Zip Code | % Graduates | vs State | vs National | |
| 1. | 67217 | 8.6% | 4.0%(+4.65)#29 | 4.9%(+3.71)#2,469 |
| 2. | 67220 | 8.0% | 4.0%(+4.03)#36 | 4.9%(+3.10)#2,909 |
| 3. | 67210 | 5.0% | 4.0%(+1.02)#97 | 4.9%(+0.091)#7,491 |
| 4. | 67235 | 4.8% | 4.0%(+0.831)#103 | 4.9%(-0.103)#8,013 |
| 5. | 67214 | 4.5% | 4.0%(+0.589)#115 | 4.9%(-0.345)#8,700 |
| 6. | 67226 | 4.5% | 4.0%(+0.499)#121 | 4.9%(-0.435)#9,000 |
| 7. | 67230 | 4.4% | 4.0%(+0.411)#128 | 4.9%(-0.523)#9,288 |
| 8. | 67216 | 4.1% | 4.0%(+0.171)#140 | 4.9%(-0.763)#10,048 |
| 9. | 67213 | 3.9% | 4.0%(-0.012)#150 | 4.9%(-0.946)#10,624 |
| 10. | 67204 | 3.8% | 4.0%(-0.140)#160 | 4.9%(-1.07)#11,109 |
| 11. | 67228 | 3.5% | 4.0%(-0.440)#171 | 4.9%(-1.37)#12,213 |
| 12. | 67211 | 3.5% | 4.0%(-0.500)#175 | 4.9%(-1.43)#12,445 |
| 13. | 67202 | 3.3% | 4.0%(-0.647)#182 | 4.9%(-1.58)#12,976 |
| 14. | 67218 | 3.2% | 4.0%(-0.757)#186 | 4.9%(-1.69)#13,382 |
| 15. | 67205 | 3.1% | 4.0%(-0.817)#191 | 4.9%(-1.75)#13,572 |
| 16. | 67209 | 3.0% | 4.0%(-0.972)#203 | 4.9%(-1.91)#14,129 |
| 17. | 67212 | 2.9% | 4.0%(-1.10)#222 | 4.9%(-2.03)#14,565 |
| 18. | 67215 | 2.8% | 4.0%(-1.12)#223 | 4.9%(-2.05)#14,644 |
| 19. | 67208 | 2.6% | 4.0%(-1.32)#235 | 4.9%(-2.25)#15,371 |
| 20. | 67219 | 2.6% | 4.0%(-1.32)#237 | 4.9%(-2.26)#15,397 |
| 21. | 67207 | 2.5% | 4.0%(-1.44)#243 | 4.9%(-2.37)#15,813 |
| 22. | 67203 | 2.4% | 4.0%(-1.57)#251 | 4.9%(-2.50)#16,296 |
| 23. | 67206 | 2.3% | 4.0%(-1.63)#256 | 4.9%(-2.56)#16,477 |
1
Common Questions
What are the Top 10 Zip Codes with the Highest Percentage of Population with a Degree in Computers and Mathematics in Wichita, KS?
Top 10 Zip Codes with the Highest Percentage of Population with a Degree in Computers and Mathematics in Wichita, KS are:
What zip code has the Highest Percentage of Population with a Degree in Computers and Mathematics in Wichita, KS?
67217 has the Highest Percentage of Population with a Degree in Computers and Mathematics in Wichita, KS with 8.6%.
What is the Percentage of Population with a Degree in Computers and Mathematics in Wichita, KS?
Percentage of Population with a Degree in Computers and Mathematics in Wichita is 3.7%.
What is the Percentage of Population with a Degree in Computers and Mathematics in Kansas?
Percentage of Population with a Degree in Computers and Mathematics in Kansas is 4.0%.
What is the Percentage of Population with a Degree in Computers and Mathematics in the United States?
Percentage of Population with a Degree in Computers and Mathematics in the United States is 4.9%.