Zip Codes with the Highest Percentage of Population Employed in Accommodation & Food Services in Wichita, KS
RELATED REPORTS & OPTIONS
Accommodation & Food Services
Wichita
Compare Zip Codes
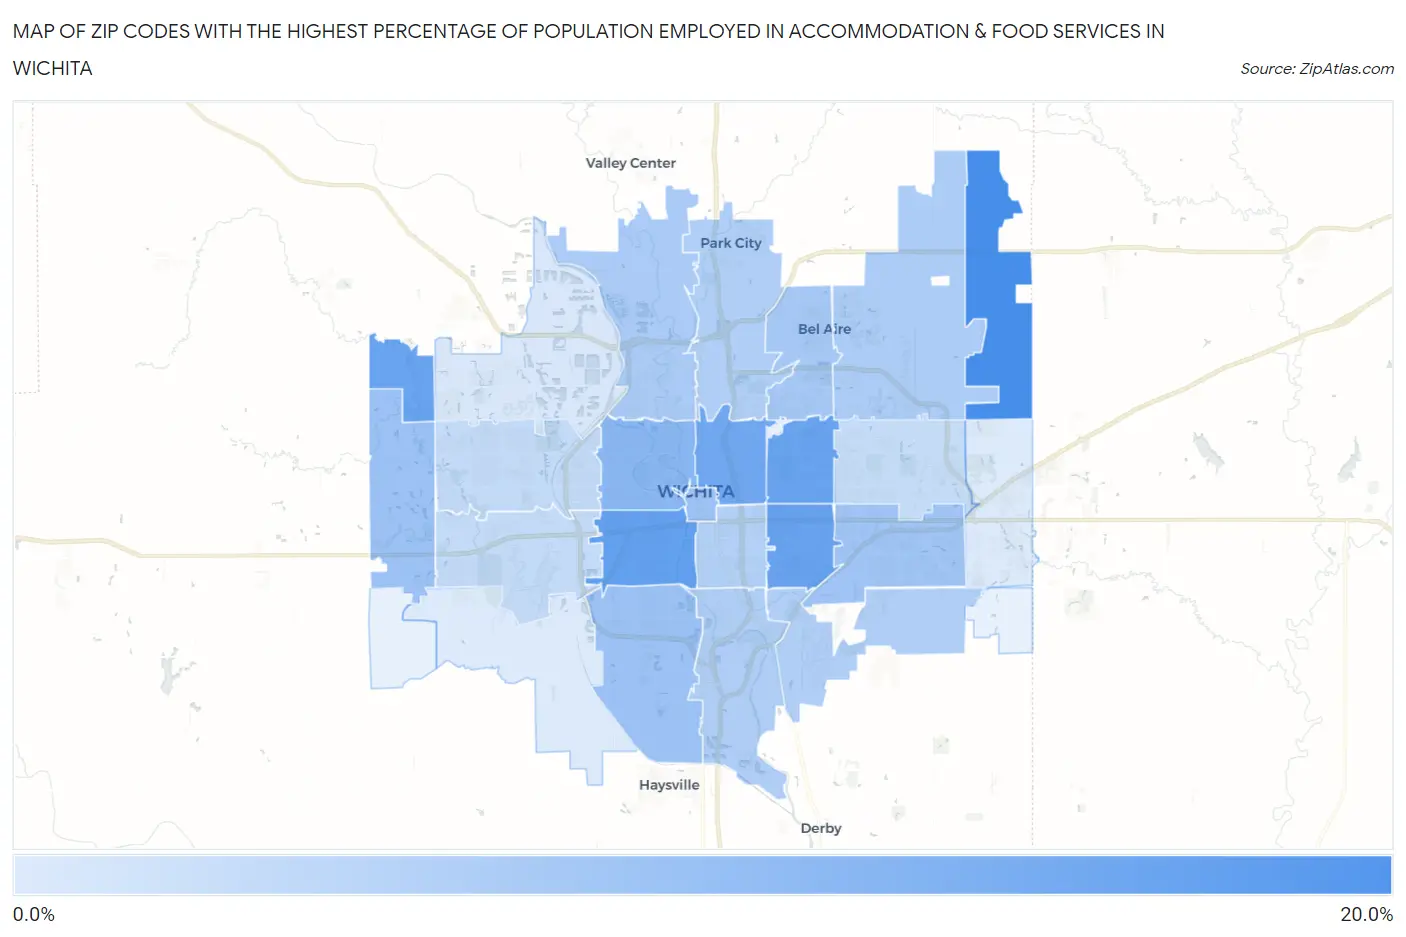
Map of Zip Codes with the Highest Percentage of Population Employed in Accommodation & Food Services in Wichita
3.2%
15.9%
Zip Codes with the Highest Percentage of Population Employed in Accommodation & Food Services in Wichita, KS
| Zip Code | % Employed | vs State | vs National | |
| 1. | 67228 | 15.9% | 6.2%(+9.72)#21 | 6.9%(+9.07)#1,467 |
| 2. | 67213 | 13.4% | 6.2%(+7.16)#30 | 6.9%(+6.50)#2,185 |
| 3. | 67218 | 13.2% | 6.2%(+6.94)#34 | 6.9%(+6.29)#2,280 |
| 4. | 67223 | 12.9% | 6.2%(+6.67)#36 | 6.9%(+6.01)#2,387 |
| 5. | 67208 | 12.8% | 6.2%(+6.62)#37 | 6.9%(+5.97)#2,412 |
| 6. | 67214 | 12.3% | 6.2%(+6.05)#41 | 6.9%(+5.39)#2,678 |
| 7. | 67203 | 10.0% | 6.2%(+3.78)#59 | 6.9%(+3.12)#4,534 |
| 8. | 67202 | 8.7% | 6.2%(+2.50)#76 | 6.9%(+1.84)#6,436 |
| 9. | 67217 | 8.5% | 6.2%(+2.31)#81 | 6.9%(+1.65)#6,765 |
| 10. | 67235 | 8.5% | 6.2%(+2.28)#82 | 6.9%(+1.63)#6,812 |
| 11. | 67207 | 8.2% | 6.2%(+1.94)#90 | 6.9%(+1.29)#7,497 |
| 12. | 67220 | 7.7% | 6.2%(+1.49)#101 | 6.9%(+0.831)#8,465 |
| 13. | 67204 | 7.3% | 6.2%(+1.04)#115 | 6.9%(+0.383)#9,636 |
| 14. | 67226 | 7.1% | 6.2%(+0.862)#120 | 6.9%(+0.205)#10,085 |
| 15. | 67216 | 7.0% | 6.2%(+0.754)#130 | 6.9%(+0.097)#10,387 |
| 16. | 67219 | 6.7% | 6.2%(+0.493)#143 | 6.9%(-0.164)#11,154 |
| 17. | 67210 | 6.7% | 6.2%(+0.489)#144 | 6.9%(-0.168)#11,165 |
| 18. | 67211 | 6.5% | 6.2%(+0.266)#152 | 6.9%(-0.391)#11,880 |
| 19. | 67212 | 5.3% | 6.2%(-0.946)#218 | 6.9%(-1.60)#15,856 |
| 20. | 67209 | 5.2% | 6.2%(-1.04)#220 | 6.9%(-1.70)#16,167 |
| 21. | 67206 | 5.1% | 6.2%(-1.09)#223 | 6.9%(-1.75)#16,353 |
| 22. | 67205 | 3.5% | 6.2%(-2.71)#326 | 6.9%(-3.37)#21,734 |
| 23. | 67215 | 3.2% | 6.2%(-3.03)#353 | 6.9%(-3.68)#22,715 |
| 24. | 67230 | 3.2% | 6.2%(-3.03)#354 | 6.9%(-3.68)#22,716 |
1
Common Questions
What are the Top 10 Zip Codes with the Highest Percentage of Population Employed in Accommodation & Food Services in Wichita, KS?
Top 10 Zip Codes with the Highest Percentage of Population Employed in Accommodation & Food Services in Wichita, KS are:
What zip code has the Highest Percentage of Population Employed in Accommodation & Food Services in Wichita, KS?
67228 has the Highest Percentage of Population Employed in Accommodation & Food Services in Wichita, KS with 15.9%.
What is the Percentage of Population Employed in Accommodation & Food Services in Wichita, KS?
Percentage of Population Employed in Accommodation & Food Services in Wichita is 8.1%.
What is the Percentage of Population Employed in Accommodation & Food Services in Kansas?
Percentage of Population Employed in Accommodation & Food Services in Kansas is 6.2%.
What is the Percentage of Population Employed in Accommodation & Food Services in the United States?
Percentage of Population Employed in Accommodation & Food Services in the United States is 6.9%.