Zip Codes with the Highest Percentage of Population with a Degree in Liberal Arts and History in Wichita, KS
RELATED REPORTS & OPTIONS
Liberal Arts and History
Wichita
Compare Zip Codes
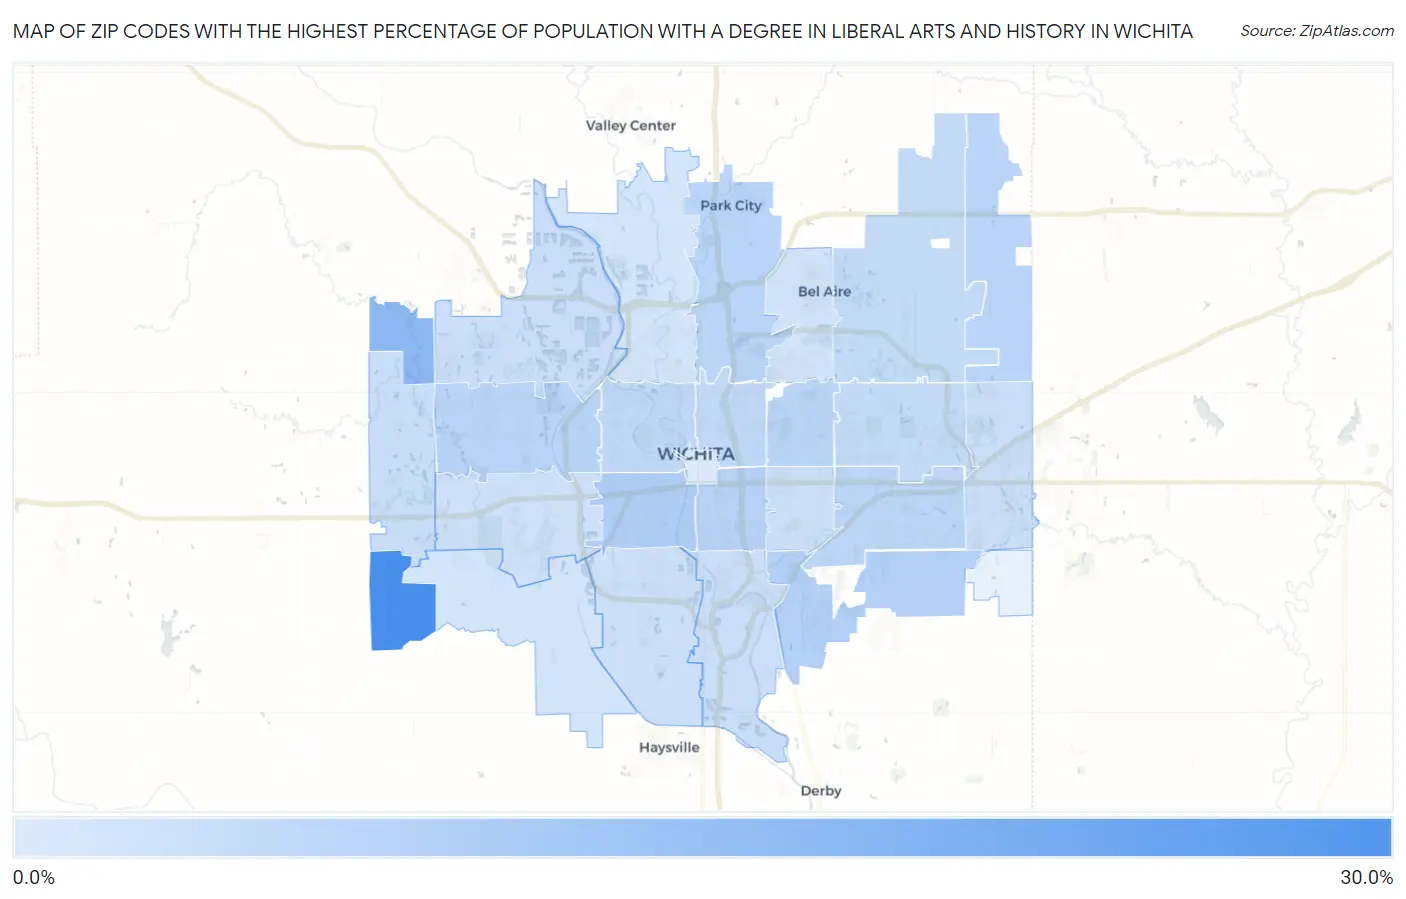
Map of Zip Codes with the Highest Percentage of Population with a Degree in Liberal Arts and History in Wichita
0.70%
28.6%
Zip Codes with the Highest Percentage of Population with a Degree in Liberal Arts and History in Wichita, KS
| Zip Code | % Graduates | vs State | vs National | |
| 1. | 67227 | 28.6% | 4.6%(+24.0)#10 | 4.9%(+23.7)#450 |
| 2. | 67223 | 14.8% | 4.6%(+10.3)#39 | 4.9%(+9.94)#1,458 |
| 3. | 67213 | 8.7% | 4.6%(+4.14)#86 | 4.9%(+3.82)#4,124 |
| 4. | 67210 | 7.6% | 4.6%(+2.99)#110 | 4.9%(+2.68)#5,509 |
| 5. | 67211 | 6.9% | 4.6%(+2.30)#129 | 4.9%(+1.99)#6,611 |
| 6. | 67212 | 6.7% | 4.6%(+2.16)#136 | 4.9%(+1.85)#6,896 |
| 7. | 67228 | 6.7% | 4.6%(+2.12)#142 | 4.9%(+1.81)#6,982 |
| 8. | 67208 | 6.6% | 4.6%(+2.05)#147 | 4.9%(+1.74)#7,129 |
| 9. | 67219 | 6.6% | 4.6%(+2.00)#148 | 4.9%(+1.69)#7,225 |
| 10. | 67207 | 6.1% | 4.6%(+1.58)#155 | 4.9%(+1.27)#8,154 |
| 11. | 67214 | 5.3% | 4.6%(+0.773)#190 | 4.9%(+0.461)#10,330 |
| 12. | 67203 | 5.2% | 4.6%(+0.613)#197 | 4.9%(+0.301)#10,802 |
| 13. | 67226 | 5.1% | 4.6%(+0.502)#202 | 4.9%(+0.191)#11,156 |
| 14. | 67206 | 5.0% | 4.6%(+0.425)#207 | 4.9%(+0.114)#11,398 |
| 15. | 67235 | 4.3% | 4.6%(-0.243)#239 | 4.9%(-0.554)#13,577 |
| 16. | 67216 | 3.8% | 4.6%(-0.786)#276 | 4.9%(-1.10)#15,616 |
| 17. | 67230 | 3.7% | 4.6%(-0.811)#280 | 4.9%(-1.12)#15,710 |
| 18. | 67205 | 3.7% | 4.6%(-0.832)#282 | 4.9%(-1.14)#15,786 |
| 19. | 67217 | 3.5% | 4.6%(-1.01)#294 | 4.9%(-1.32)#16,409 |
| 20. | 67218 | 3.3% | 4.6%(-1.23)#307 | 4.9%(-1.54)#17,179 |
| 21. | 67209 | 2.8% | 4.6%(-1.75)#344 | 4.9%(-2.07)#18,990 |
| 22. | 67220 | 2.7% | 4.6%(-1.88)#353 | 4.9%(-2.19)#19,390 |
| 23. | 67204 | 2.3% | 4.6%(-2.24)#375 | 4.9%(-2.55)#20,503 |
| 24. | 67215 | 2.3% | 4.6%(-2.26)#377 | 4.9%(-2.57)#20,547 |
| 25. | 67202 | 0.70% | 4.6%(-3.86)#463 | 4.9%(-4.17)#23,822 |
1
Common Questions
What are the Top 10 Zip Codes with the Highest Percentage of Population with a Degree in Liberal Arts and History in Wichita, KS?
Top 10 Zip Codes with the Highest Percentage of Population with a Degree in Liberal Arts and History in Wichita, KS are:
What zip code has the Highest Percentage of Population with a Degree in Liberal Arts and History in Wichita, KS?
67227 has the Highest Percentage of Population with a Degree in Liberal Arts and History in Wichita, KS with 28.6%.
What is the Percentage of Population with a Degree in Liberal Arts and History in Wichita, KS?
Percentage of Population with a Degree in Liberal Arts and History in Wichita is 4.9%.
What is the Percentage of Population with a Degree in Liberal Arts and History in Kansas?
Percentage of Population with a Degree in Liberal Arts and History in Kansas is 4.6%.
What is the Percentage of Population with a Degree in Liberal Arts and History in the United States?
Percentage of Population with a Degree in Liberal Arts and History in the United States is 4.9%.