Zip Codes with the Highest Percentage of Population Enrolled in Nursery / Preschool in Wichita, KS

RELATED REPORTS & OPTIONS

Nursery / Preschool
Population
Families and Households
Female Fertility
Female Fertility (Unmarried)
Race (Community Size)
Race (Percentage)
Ancestry (Community Size)
AfricanAlaska NativeAmericanApacheArabArapahoArgentineanArmenianAustralianAustrianBangladeshiBarbadianBelgianBhutaneseBlackfeetBolivianBrazilianBritishBulgarianBurmeseCajunCanadianCelticCentral AmericanCentral American IndianCherokeeCheyenneChickasawChileanChippewaChoctawColombianComancheCosta RicanCreekCroatianCubanCzechCzechoslovakianDanishDelawareDominicanDutchDutch West IndianEastern EuropeanEcuadorianEgyptianEnglishEthiopianEuropeanFilipinoFinnishFrenchFrench American IndianFrench CanadianGermanGerman RussianGhanaianGreekGuamanian / ChamorroGuatemalanHaitianHonduranHungarianIcelanderIndian (Asian)IndonesianInupiatIranianIrishIroquoisItalianJamaicanJapaneseJordanianKenyanKiowaKoreanLaotianLebaneseLithuanianLuxembourgerMalaysianMexicanMexican American IndianMongolianMoroccanNative HawaiianNavajoNicaraguanNigerianNorthern EuropeanNorwegianOsageOttawaPakistaniPalestinianPanamanianParaguayanPennsylvania GermanPeruvianPimaPolishPortuguesePotawatomiPuebloPuerto RicanRomanianRussianSalvadoranSamoanScandinavianScotch-IrishScottishSeminoleSiouxSlavicSlovakSloveneSouth AfricanSouth AmericanSpaniardSpanishSpanish AmericanSpanish American IndianSri LankanSubsaharan AfricanSwedishSwissSyrianThaiTrinidadian and TobagonianTurkishUgandanUkrainianVenezuelanWelshWest IndianYugoslavian
Ancestry (Percentage)
AfricanAlaska NativeAmericanApacheArabArapahoArgentineanArmenianAustralianAustrianBangladeshiBarbadianBelgianBhutaneseBlackfeetBolivianBrazilianBritishBulgarianBurmeseCajunCanadianCelticCentral AmericanCentral American IndianCherokeeCheyenneChickasawChileanChippewaChoctawColombianComancheCosta RicanCreekCroatianCubanCzechCzechoslovakianDanishDelawareDominicanDutchDutch West IndianEastern EuropeanEcuadorianEgyptianEnglishEthiopianEuropeanFilipinoFinnishFrenchFrench American IndianFrench CanadianGermanGerman RussianGhanaianGreekGuamanian / ChamorroGuatemalanHaitianHonduranHungarianIcelanderIndian (Asian)IndonesianInupiatIranianIrishIroquoisItalianJamaicanJapaneseJordanianKenyanKiowaKoreanLaotianLebaneseLithuanianLuxembourgerMalaysianMexicanMexican American IndianMongolianMoroccanNative HawaiianNavajoNicaraguanNigerianNorthern EuropeanNorwegianOsageOttawaPakistaniPalestinianPanamanianParaguayanPennsylvania GermanPeruvianPimaPolishPortuguesePotawatomiPuebloPuerto RicanRomanianRussianSalvadoranSamoanScandinavianScotch-IrishScottishSeminoleSiouxSlavicSlovakSloveneSouth AfricanSouth AmericanSpaniardSpanishSpanish AmericanSpanish American IndianSri LankanSubsaharan AfricanSwedishSwissSyrianThaiTrinidadian and TobagonianTurkishUgandanUkrainianVenezuelanWelshWest IndianYugoslavian
Immigrant Origin (Total)
Immigrant Origin (Percentage)
Income
Income (Families)
Income (Households)
Poverty
Poverty (Families)
Unemployment
Employment Occupations
Employment Industries
Employer Class
Commute Time
Commute Means
School Enrollment
Education by Degree Field
Occupancy
Finances
Physical Characteristics
Wichita
Compare Zip Codes
Comparison Subject

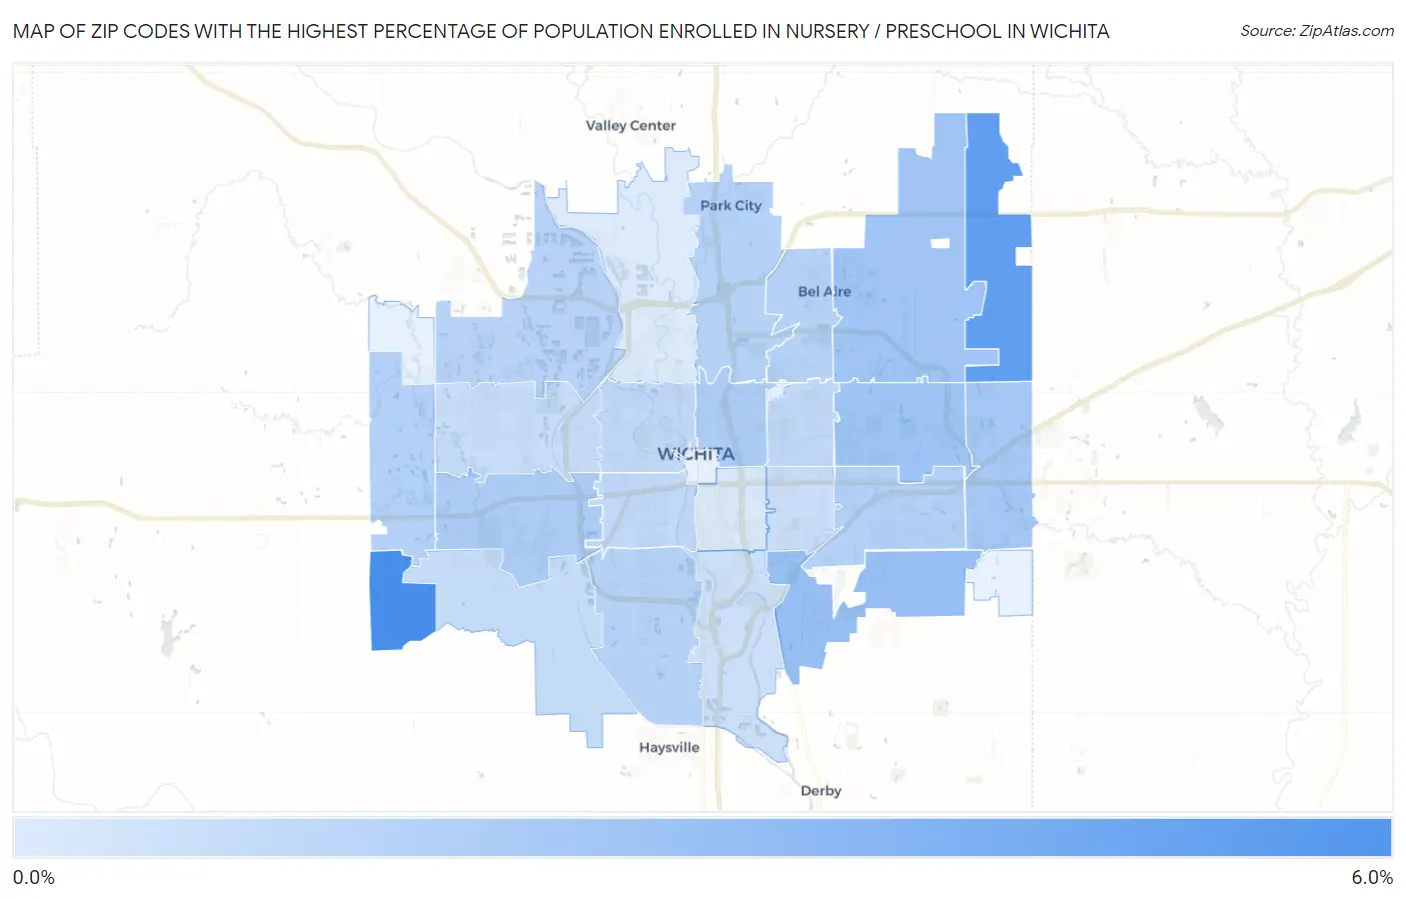
Map of Zip Codes with the Highest Percentage of Population Enrolled in Nursery / Preschool in Wichita

0.0%
6.0%
Zip Codes with the Highest Percentage of Population Enrolled in Nursery / Preschool in Wichita Map

Zip Codes with the Highest Percentage of Population Enrolled in Nursery / Preschool in Wichita, KS

Zip Code % in Nursery vs State vs National
1.672275.9%1.7%(+4.20)#201.4%(+4.43)#451
2.672284.9%1.7%(+3.23)#291.4%(+3.47)#666
3.672102.8%1.7%(+1.15)#951.4%(+1.38)#2,580
4.672062.6%1.7%(+0.960)#1081.4%(+1.19)#3,049
5.672262.6%1.7%(+0.885)#1191.4%(+1.12)#3,283
6.672302.4%1.7%(+0.669)#1391.4%(+0.902)#4,125
7.672092.1%1.7%(+0.454)#1661.4%(+0.687)#5,180
8.672142.1%1.7%(+0.442)#1681.4%(+0.676)#5,252
9.672071.8%1.7%(+0.153)#2211.4%(+0.386)#7,409
10.672351.8%1.7%(+0.137)#2251.4%(+0.370)#7,568
11.672171.8%1.7%(+0.112)#2331.4%(+0.345)#7,796
12.672191.8%1.7%(+0.099)#2381.4%(+0.333)#7,921
13.672201.8%1.7%(+0.078)#2431.4%(+0.311)#8,126
14.672051.7%1.7%(-0.018)#2651.4%(+0.215)#9,145
15.672031.4%1.7%(-0.283)#3221.4%(-0.049)#12,269
16.672131.4%1.7%(-0.312)#3251.4%(-0.078)#12,616
17.672081.4%1.7%(-0.321)#3281.4%(-0.087)#12,734
18.672151.2%1.7%(-0.484)#3711.4%(-0.250)#14,910
19.672121.1%1.7%(-0.564)#3841.4%(-0.330)#15,962
20.672181.0%1.7%(-0.676)#4091.4%(-0.443)#17,488
21.672160.97%1.7%(-0.707)#4151.4%(-0.474)#17,886
22.672110.46%1.7%(-1.22)#5101.4%(-0.985)#23,364
23.672040.36%1.7%(-1.32)#5301.4%(-1.09)#24,164

Common Questions

What are the Top 10 Zip Codes with the Highest Percentage of Population Enrolled in Nursery / Preschool in Wichita, KS?
Top 10 Zip Codes with the Highest Percentage of Population Enrolled in Nursery / Preschool in Wichita, KS are:
#1
5.9%
#2
4.9%
#3
2.8%
#4
2.6%
#5
2.6%
#6
2.4%
#7
2.1%
#8
2.1%
#9
1.8%
#10
1.8%
What zip code has the Highest Percentage of Population Enrolled in Nursery / Preschool in Wichita, KS?
67227 has the Highest Percentage of Population Enrolled in Nursery / Preschool in Wichita, KS with 5.9%.
What is the Percentage of Population Enrolled in Nursery / Preschool in Wichita, KS?
Percentage of Population Enrolled in Nursery / Preschool in Wichita is 1.5%.
What is the Percentage of Population Enrolled in Nursery / Preschool in Kansas?
Percentage of Population Enrolled in Nursery / Preschool in Kansas is 1.7%.
What is the Percentage of Population Enrolled in Nursery / Preschool in the United States?
Percentage of Population Enrolled in Nursery / Preschool in the United States is 1.4%.