Ugandan vs Immigrants from Congo 2 or more Vehicles in Household
COMPARE
Ugandan
Immigrants from Congo
2 or more Vehicles in Household
2 or more Vehicles in Household Comparison
Ugandans
Immigrants from Congo
53.5%
2 OR MORE VEHICLES IN HOUSEHOLD
3.2/ 100
METRIC RATING
233rd/ 347
METRIC RANK
52.1%
2 OR MORE VEHICLES IN HOUSEHOLD
0.3/ 100
METRIC RATING
265th/ 347
METRIC RANK
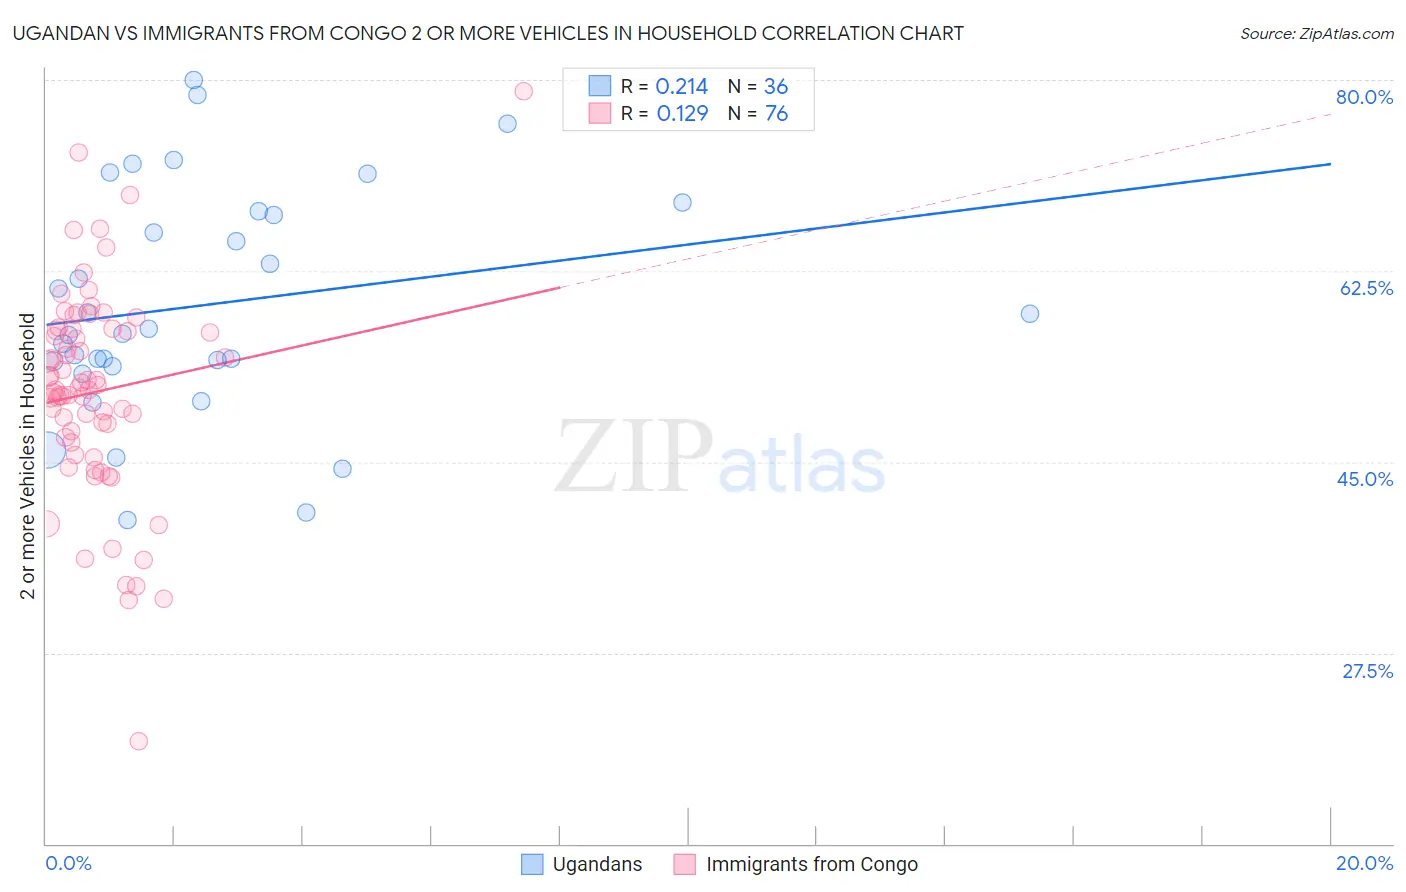
Ugandan vs Immigrants from Congo 2 or more Vehicles in Household Correlation Chart
The statistical analysis conducted on geographies consisting of 93,998,632 people shows a weak positive correlation between the proportion of Ugandans and percentage of households with 2 or more vehicles available in the United States with a correlation coefficient (R) of 0.214 and weighted average of 53.5%. Similarly, the statistical analysis conducted on geographies consisting of 92,104,745 people shows a poor positive correlation between the proportion of Immigrants from Congo and percentage of households with 2 or more vehicles available in the United States with a correlation coefficient (R) of 0.129 and weighted average of 52.1%, a difference of 2.6%.
2 or more Vehicles in Household Correlation Summary
| Measurement | Ugandan | Immigrants from Congo |
| Minimum | 39.7% | 19.4% |
| Maximum | 80.0% | 79.0% |
| Range | 40.3% | 59.6% |
| Mean | 59.4% | 51.4% |
| Median | 57.0% | 51.7% |
| Interquartile 25% (IQ1) | 54.0% | 47.0% |
| Interquartile 75% (IQ3) | 67.8% | 57.1% |
| Interquartile Range (IQR) | 13.8% | 10.1% |
| Standard Deviation (Sample) | 10.4% | 9.7% |
| Standard Deviation (Population) | 10.3% | 9.6% |
Similar Demographics by 2 or more Vehicles in Household
Demographics Similar to Ugandans by 2 or more Vehicles in Household
In terms of 2 or more vehicles in household, the demographic groups most similar to Ugandans are Immigrants from Guatemala (53.5%, a difference of 0.010%), Immigrants from Switzerland (53.4%, a difference of 0.060%), Panamanian (53.5%, a difference of 0.080%), Immigrants from Middle Africa (53.4%, a difference of 0.090%), and Immigrants from Nepal (53.5%, a difference of 0.13%).
| Demographics | Rating | Rank | 2 or more Vehicles in Household |
| Immigrants | Eastern Africa | 5.1 /100 | #226 | Tragic 53.7% |
| Sudanese | 4.1 /100 | #227 | Tragic 53.6% |
| Alaska Natives | 3.9 /100 | #228 | Tragic 53.6% |
| Immigrants | Turkey | 3.8 /100 | #229 | Tragic 53.6% |
| Immigrants | Nepal | 3.6 /100 | #230 | Tragic 53.5% |
| Panamanians | 3.4 /100 | #231 | Tragic 53.5% |
| Immigrants | Guatemala | 3.2 /100 | #232 | Tragic 53.5% |
| Ugandans | 3.2 /100 | #233 | Tragic 53.5% |
| Immigrants | Switzerland | 3.0 /100 | #234 | Tragic 53.4% |
| Immigrants | Middle Africa | 3.0 /100 | #235 | Tragic 53.4% |
| Indonesians | 2.7 /100 | #236 | Tragic 53.4% |
| Macedonians | 2.4 /100 | #237 | Tragic 53.3% |
| Immigrants | Armenia | 2.3 /100 | #238 | Tragic 53.3% |
| Cambodians | 2.3 /100 | #239 | Tragic 53.3% |
| Immigrants | Europe | 2.1 /100 | #240 | Tragic 53.2% |
Demographics Similar to Immigrants from Congo by 2 or more Vehicles in Household
In terms of 2 or more vehicles in household, the demographic groups most similar to Immigrants from Congo are Immigrants from France (52.0%, a difference of 0.14%), Immigrants from Colombia (52.0%, a difference of 0.19%), Pima (52.0%, a difference of 0.20%), Honduran (52.0%, a difference of 0.20%), and Immigrants from Ireland (52.0%, a difference of 0.22%).
| Demographics | Rating | Rank | 2 or more Vehicles in Household |
| Central American Indians | 0.6 /100 | #258 | Tragic 52.5% |
| Alsatians | 0.6 /100 | #259 | Tragic 52.5% |
| Immigrants | Bahamas | 0.5 /100 | #260 | Tragic 52.5% |
| Immigrants | Australia | 0.5 /100 | #261 | Tragic 52.4% |
| Immigrants | Northern Africa | 0.4 /100 | #262 | Tragic 52.3% |
| Immigrants | Southern Europe | 0.4 /100 | #263 | Tragic 52.3% |
| Immigrants | Latvia | 0.4 /100 | #264 | Tragic 52.2% |
| Immigrants | Congo | 0.3 /100 | #265 | Tragic 52.1% |
| Immigrants | France | 0.2 /100 | #266 | Tragic 52.0% |
| Immigrants | Colombia | 0.2 /100 | #267 | Tragic 52.0% |
| Pima | 0.2 /100 | #268 | Tragic 52.0% |
| Hondurans | 0.2 /100 | #269 | Tragic 52.0% |
| Immigrants | Ireland | 0.2 /100 | #270 | Tragic 52.0% |
| South Americans | 0.2 /100 | #271 | Tragic 51.9% |
| Sub-Saharan Africans | 0.2 /100 | #272 | Tragic 51.9% |