Pakistani vs Immigrants from Congo 2 or more Vehicles in Household
COMPARE
Pakistani
Immigrants from Congo
2 or more Vehicles in Household
2 or more Vehicles in Household Comparison
Pakistanis
Immigrants from Congo
57.9%
2 OR MORE VEHICLES IN HOUSEHOLD
99.0/ 100
METRIC RATING
91st/ 347
METRIC RANK
52.1%
2 OR MORE VEHICLES IN HOUSEHOLD
0.3/ 100
METRIC RATING
265th/ 347
METRIC RANK
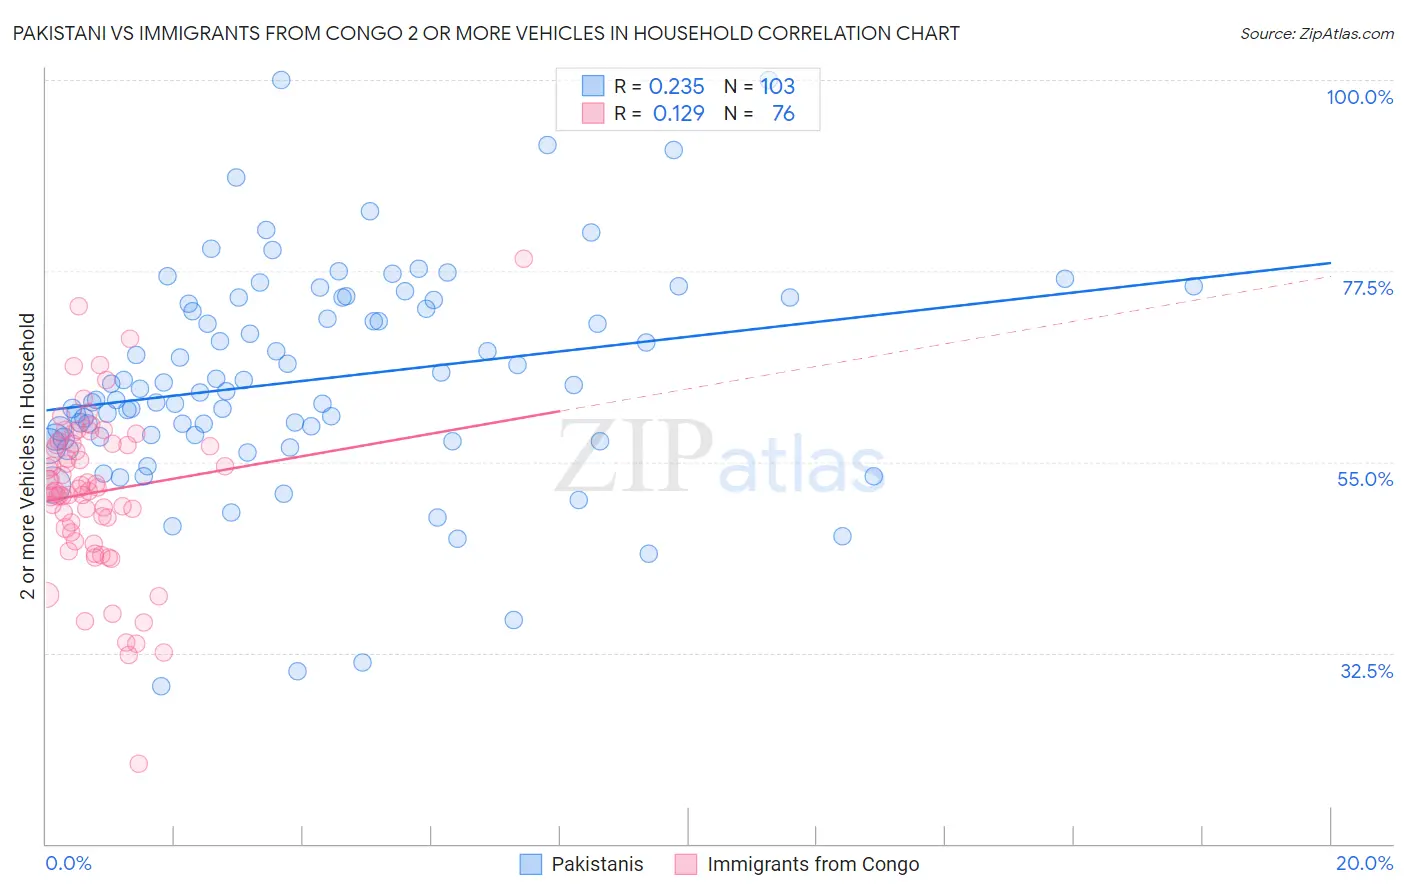
Pakistani vs Immigrants from Congo 2 or more Vehicles in Household Correlation Chart
The statistical analysis conducted on geographies consisting of 335,209,780 people shows a weak positive correlation between the proportion of Pakistanis and percentage of households with 2 or more vehicles available in the United States with a correlation coefficient (R) of 0.235 and weighted average of 57.9%. Similarly, the statistical analysis conducted on geographies consisting of 92,104,745 people shows a poor positive correlation between the proportion of Immigrants from Congo and percentage of households with 2 or more vehicles available in the United States with a correlation coefficient (R) of 0.129 and weighted average of 52.1%, a difference of 11.1%.
2 or more Vehicles in Household Correlation Summary
| Measurement | Pakistani | Immigrants from Congo |
| Minimum | 28.5% | 19.4% |
| Maximum | 100.0% | 79.0% |
| Range | 71.5% | 59.6% |
| Mean | 64.7% | 51.4% |
| Median | 63.3% | 51.7% |
| Interquartile 25% (IQ1) | 57.9% | 47.0% |
| Interquartile 75% (IQ3) | 74.1% | 57.1% |
| Interquartile Range (IQR) | 16.1% | 10.1% |
| Standard Deviation (Sample) | 12.9% | 9.7% |
| Standard Deviation (Population) | 12.9% | 9.6% |
Similar Demographics by 2 or more Vehicles in Household
Demographics Similar to Pakistanis by 2 or more Vehicles in Household
In terms of 2 or more vehicles in household, the demographic groups most similar to Pakistanis are Shoshone (57.9%, a difference of 0.020%), Immigrants from Germany (57.9%, a difference of 0.030%), Hispanic or Latino (57.9%, a difference of 0.030%), Ottawa (57.9%, a difference of 0.030%), and Immigrants from Iran (57.9%, a difference of 0.090%).
| Demographics | Rating | Rank | 2 or more Vehicles in Household |
| Maltese | 99.2 /100 | #84 | Exceptional 58.0% |
| Slovaks | 99.2 /100 | #85 | Exceptional 58.0% |
| Potawatomi | 99.1 /100 | #86 | Exceptional 58.0% |
| Thais | 99.1 /100 | #87 | Exceptional 57.9% |
| Immigrants | Iran | 99.1 /100 | #88 | Exceptional 57.9% |
| Immigrants | Germany | 99.0 /100 | #89 | Exceptional 57.9% |
| Hispanics or Latinos | 99.0 /100 | #90 | Exceptional 57.9% |
| Pakistanis | 99.0 /100 | #91 | Exceptional 57.9% |
| Shoshone | 99.0 /100 | #92 | Exceptional 57.9% |
| Ottawa | 99.0 /100 | #93 | Exceptional 57.9% |
| Filipinos | 98.9 /100 | #94 | Exceptional 57.8% |
| Hmong | 98.9 /100 | #95 | Exceptional 57.8% |
| Burmese | 98.8 /100 | #96 | Exceptional 57.8% |
| Slavs | 98.8 /100 | #97 | Exceptional 57.8% |
| Palestinians | 98.6 /100 | #98 | Exceptional 57.7% |
Demographics Similar to Immigrants from Congo by 2 or more Vehicles in Household
In terms of 2 or more vehicles in household, the demographic groups most similar to Immigrants from Congo are Immigrants from France (52.0%, a difference of 0.14%), Immigrants from Colombia (52.0%, a difference of 0.19%), Pima (52.0%, a difference of 0.20%), Honduran (52.0%, a difference of 0.20%), and Immigrants from Ireland (52.0%, a difference of 0.22%).
| Demographics | Rating | Rank | 2 or more Vehicles in Household |
| Central American Indians | 0.6 /100 | #258 | Tragic 52.5% |
| Alsatians | 0.6 /100 | #259 | Tragic 52.5% |
| Immigrants | Bahamas | 0.5 /100 | #260 | Tragic 52.5% |
| Immigrants | Australia | 0.5 /100 | #261 | Tragic 52.4% |
| Immigrants | Northern Africa | 0.4 /100 | #262 | Tragic 52.3% |
| Immigrants | Southern Europe | 0.4 /100 | #263 | Tragic 52.3% |
| Immigrants | Latvia | 0.4 /100 | #264 | Tragic 52.2% |
| Immigrants | Congo | 0.3 /100 | #265 | Tragic 52.1% |
| Immigrants | France | 0.2 /100 | #266 | Tragic 52.0% |
| Immigrants | Colombia | 0.2 /100 | #267 | Tragic 52.0% |
| Pima | 0.2 /100 | #268 | Tragic 52.0% |
| Hondurans | 0.2 /100 | #269 | Tragic 52.0% |
| Immigrants | Ireland | 0.2 /100 | #270 | Tragic 52.0% |
| South Americans | 0.2 /100 | #271 | Tragic 51.9% |
| Sub-Saharan Africans | 0.2 /100 | #272 | Tragic 51.9% |