Ugandan vs Ghanaian 2 or more Vehicles in Household
COMPARE
Ugandan
Ghanaian
2 or more Vehicles in Household
2 or more Vehicles in Household Comparison
Ugandans
Ghanaians
53.5%
2 OR MORE VEHICLES IN HOUSEHOLD
3.2/ 100
METRIC RATING
233rd/ 347
METRIC RANK
48.0%
2 OR MORE VEHICLES IN HOUSEHOLD
0.0/ 100
METRIC RATING
310th/ 347
METRIC RANK
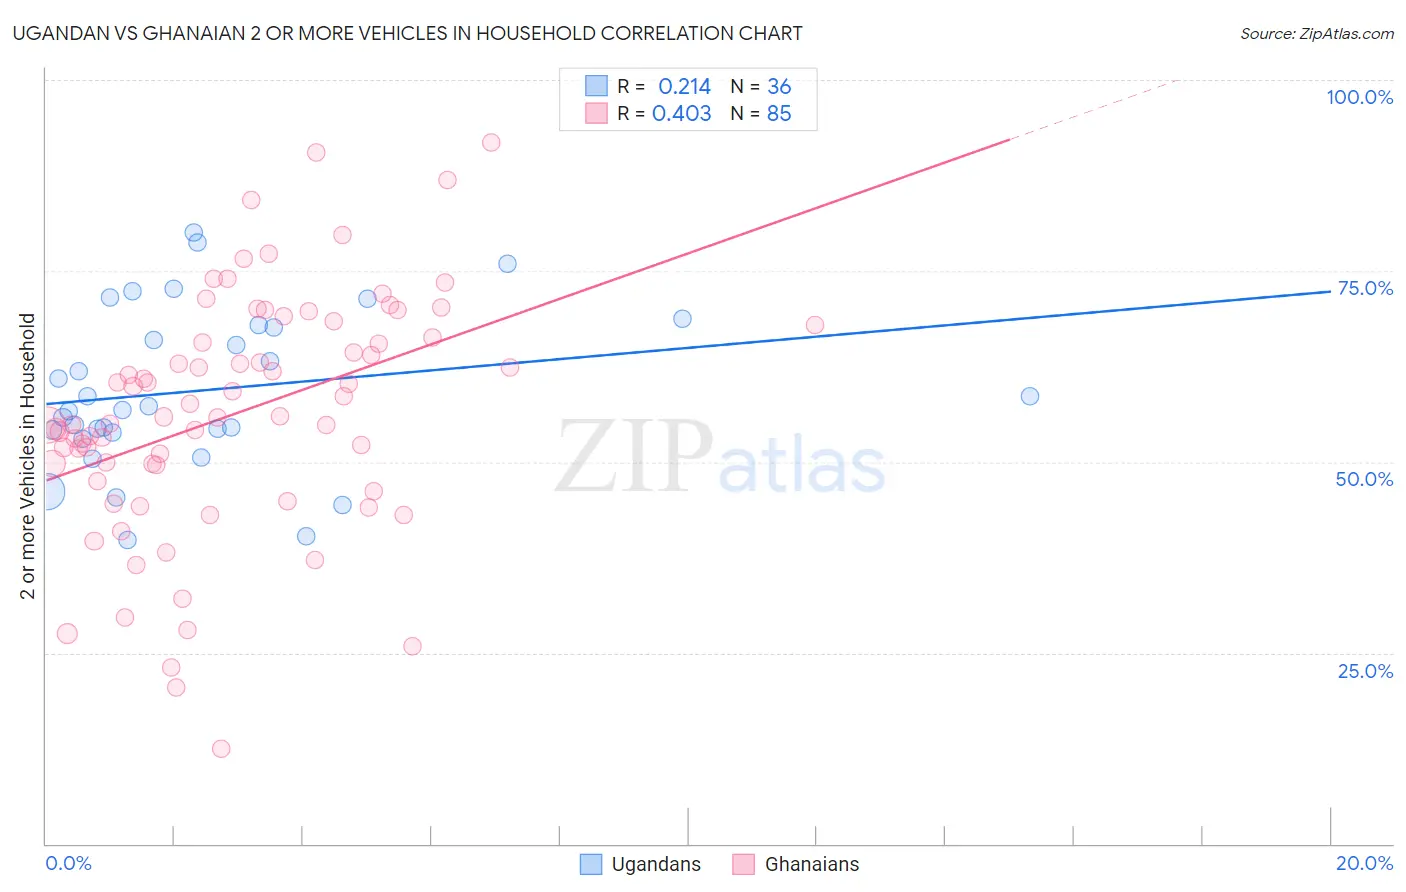
Ugandan vs Ghanaian 2 or more Vehicles in Household Correlation Chart
The statistical analysis conducted on geographies consisting of 93,998,632 people shows a weak positive correlation between the proportion of Ugandans and percentage of households with 2 or more vehicles available in the United States with a correlation coefficient (R) of 0.214 and weighted average of 53.5%. Similarly, the statistical analysis conducted on geographies consisting of 190,548,121 people shows a moderate positive correlation between the proportion of Ghanaians and percentage of households with 2 or more vehicles available in the United States with a correlation coefficient (R) of 0.403 and weighted average of 48.0%, a difference of 11.5%.
2 or more Vehicles in Household Correlation Summary
| Measurement | Ugandan | Ghanaian |
| Minimum | 39.7% | 12.4% |
| Maximum | 80.0% | 91.9% |
| Range | 40.3% | 79.5% |
| Mean | 59.4% | 56.3% |
| Median | 57.0% | 55.9% |
| Interquartile 25% (IQ1) | 54.0% | 48.5% |
| Interquartile 75% (IQ3) | 67.8% | 67.2% |
| Interquartile Range (IQR) | 13.8% | 18.7% |
| Standard Deviation (Sample) | 10.4% | 15.6% |
| Standard Deviation (Population) | 10.3% | 15.5% |
Similar Demographics by 2 or more Vehicles in Household
Demographics Similar to Ugandans by 2 or more Vehicles in Household
In terms of 2 or more vehicles in household, the demographic groups most similar to Ugandans are Immigrants from Guatemala (53.5%, a difference of 0.010%), Immigrants from Switzerland (53.4%, a difference of 0.060%), Panamanian (53.5%, a difference of 0.080%), Immigrants from Middle Africa (53.4%, a difference of 0.090%), and Immigrants from Nepal (53.5%, a difference of 0.13%).
| Demographics | Rating | Rank | 2 or more Vehicles in Household |
| Immigrants | Eastern Africa | 5.1 /100 | #226 | Tragic 53.7% |
| Sudanese | 4.1 /100 | #227 | Tragic 53.6% |
| Alaska Natives | 3.9 /100 | #228 | Tragic 53.6% |
| Immigrants | Turkey | 3.8 /100 | #229 | Tragic 53.6% |
| Immigrants | Nepal | 3.6 /100 | #230 | Tragic 53.5% |
| Panamanians | 3.4 /100 | #231 | Tragic 53.5% |
| Immigrants | Guatemala | 3.2 /100 | #232 | Tragic 53.5% |
| Ugandans | 3.2 /100 | #233 | Tragic 53.5% |
| Immigrants | Switzerland | 3.0 /100 | #234 | Tragic 53.4% |
| Immigrants | Middle Africa | 3.0 /100 | #235 | Tragic 53.4% |
| Indonesians | 2.7 /100 | #236 | Tragic 53.4% |
| Macedonians | 2.4 /100 | #237 | Tragic 53.3% |
| Immigrants | Armenia | 2.3 /100 | #238 | Tragic 53.3% |
| Cambodians | 2.3 /100 | #239 | Tragic 53.3% |
| Immigrants | Europe | 2.1 /100 | #240 | Tragic 53.2% |
Demographics Similar to Ghanaians by 2 or more Vehicles in Household
In terms of 2 or more vehicles in household, the demographic groups most similar to Ghanaians are Immigrants from Belarus (47.9%, a difference of 0.12%), Haitian (47.6%, a difference of 0.86%), U.S. Virgin Islander (47.5%, a difference of 1.0%), Immigrants from Ghana (47.4%, a difference of 1.3%), and Moroccan (48.8%, a difference of 1.8%).
| Demographics | Rating | Rank | 2 or more Vehicles in Household |
| Tohono O'odham | 0.0 /100 | #303 | Tragic 50.0% |
| Immigrants | Belize | 0.0 /100 | #304 | Tragic 49.9% |
| Immigrants | Western Africa | 0.0 /100 | #305 | Tragic 49.4% |
| Immigrants | Israel | 0.0 /100 | #306 | Tragic 49.2% |
| Hopi | 0.0 /100 | #307 | Tragic 49.0% |
| Albanians | 0.0 /100 | #308 | Tragic 49.0% |
| Moroccans | 0.0 /100 | #309 | Tragic 48.8% |
| Ghanaians | 0.0 /100 | #310 | Tragic 48.0% |
| Immigrants | Belarus | 0.0 /100 | #311 | Tragic 47.9% |
| Haitians | 0.0 /100 | #312 | Tragic 47.6% |
| U.S. Virgin Islanders | 0.0 /100 | #313 | Tragic 47.5% |
| Immigrants | Ghana | 0.0 /100 | #314 | Tragic 47.4% |
| Puerto Ricans | 0.0 /100 | #315 | Tragic 47.1% |
| Cape Verdeans | 0.0 /100 | #316 | Tragic 46.8% |
| Immigrants | Haiti | 0.0 /100 | #317 | Tragic 46.5% |