Ugandan vs Immigrants from Congo 9th Grade
COMPARE
Ugandan
Immigrants from Congo
9th Grade
9th Grade Comparison
Ugandans
Immigrants from Congo
95.1%
9TH GRADE
77.0/ 100
METRIC RATING
152nd/ 347
METRIC RANK
93.9%
9TH GRADE
0.4/ 100
METRIC RATING
264th/ 347
METRIC RANK
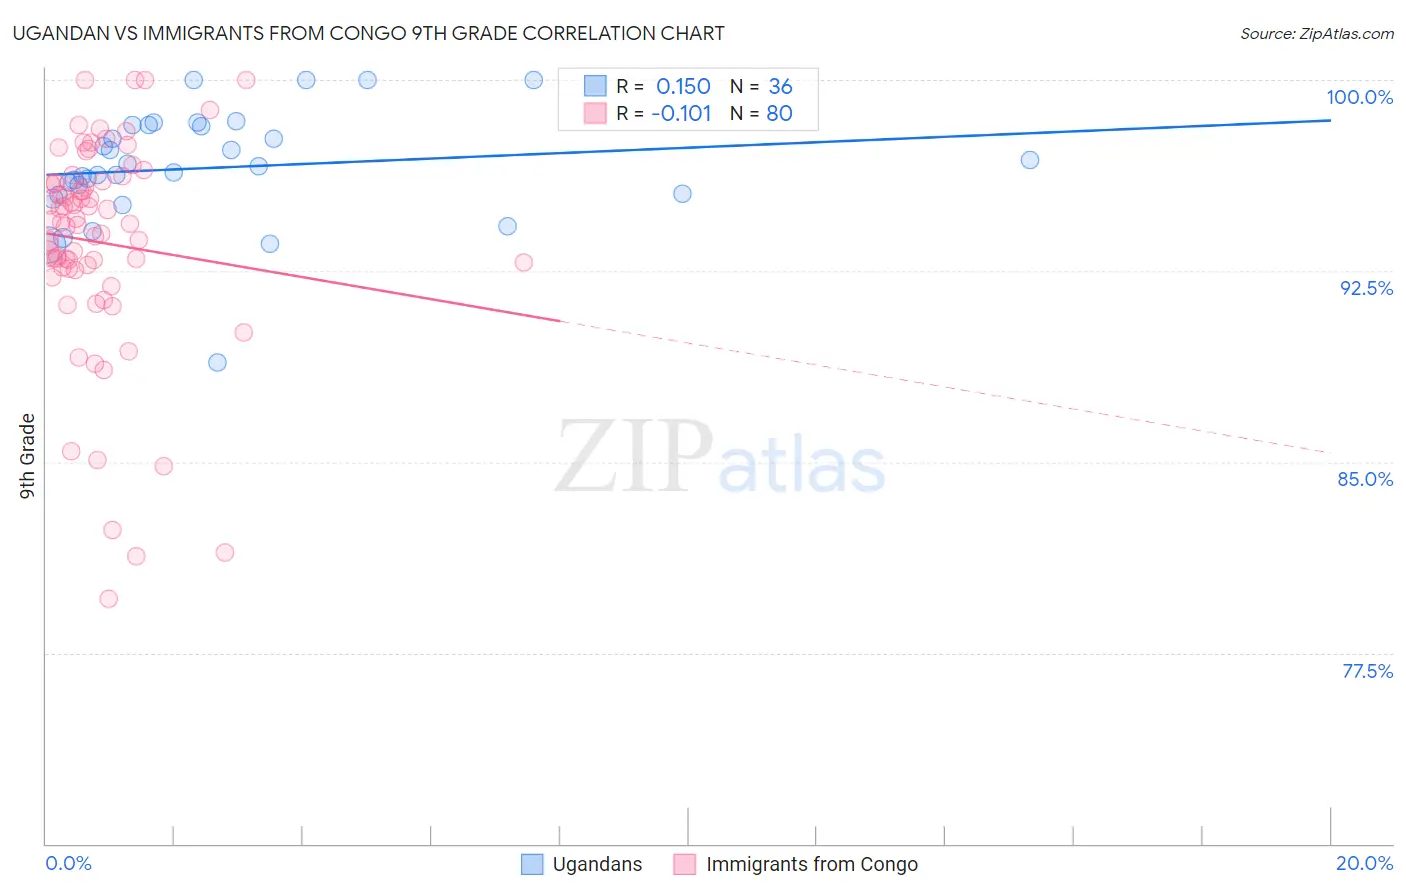
Ugandan vs Immigrants from Congo 9th Grade Correlation Chart
The statistical analysis conducted on geographies consisting of 93,991,892 people shows a poor positive correlation between the proportion of Ugandans and percentage of population with at least 9th grade education in the United States with a correlation coefficient (R) of 0.150 and weighted average of 95.1%. Similarly, the statistical analysis conducted on geographies consisting of 92,132,988 people shows a poor negative correlation between the proportion of Immigrants from Congo and percentage of population with at least 9th grade education in the United States with a correlation coefficient (R) of -0.101 and weighted average of 93.9%, a difference of 1.3%.
9th Grade Correlation Summary
| Measurement | Ugandan | Immigrants from Congo |
| Minimum | 88.9% | 79.6% |
| Maximum | 100.0% | 100.0% |
| Range | 11.1% | 20.4% |
| Mean | 96.6% | 93.6% |
| Median | 96.5% | 94.4% |
| Interquartile 25% (IQ1) | 95.5% | 92.6% |
| Interquartile 75% (IQ3) | 98.2% | 96.0% |
| Interquartile Range (IQR) | 2.7% | 3.4% |
| Standard Deviation (Sample) | 2.2% | 4.2% |
| Standard Deviation (Population) | 2.2% | 4.2% |
Similar Demographics by 9th Grade
Demographics Similar to Ugandans by 9th Grade
In terms of 9th grade, the demographic groups most similar to Ugandans are Cajun (95.1%, a difference of 0.0%), Albanian (95.1%, a difference of 0.010%), Kenyan (95.1%, a difference of 0.020%), Arab (95.1%, a difference of 0.020%), and Immigrants from Kazakhstan (95.1%, a difference of 0.020%).
| Demographics | Rating | Rank | 9th Grade |
| Pueblo | 82.2 /100 | #145 | Excellent 95.1% |
| Immigrants | Sri Lanka | 82.1 /100 | #146 | Excellent 95.1% |
| Choctaw | 81.9 /100 | #147 | Excellent 95.1% |
| Immigrants | Jordan | 81.2 /100 | #148 | Excellent 95.1% |
| Immigrants | Korea | 79.6 /100 | #149 | Good 95.1% |
| Kenyans | 79.1 /100 | #150 | Good 95.1% |
| Cajuns | 77.3 /100 | #151 | Good 95.1% |
| Ugandans | 77.0 /100 | #152 | Good 95.1% |
| Albanians | 76.1 /100 | #153 | Good 95.1% |
| Arabs | 74.9 /100 | #154 | Good 95.1% |
| Immigrants | Kazakhstan | 74.7 /100 | #155 | Good 95.1% |
| Immigrants | Kenya | 73.1 /100 | #156 | Good 95.0% |
| Mongolians | 73.0 /100 | #157 | Good 95.0% |
| Egyptians | 70.1 /100 | #158 | Good 95.0% |
| Immigrants | Ukraine | 67.4 /100 | #159 | Good 95.0% |
Demographics Similar to Immigrants from Congo by 9th Grade
In terms of 9th grade, the demographic groups most similar to Immigrants from Congo are Immigrants from Uzbekistan (93.9%, a difference of 0.0%), Native/Alaskan (93.9%, a difference of 0.0%), Immigrants from Jamaica (93.9%, a difference of 0.010%), Navajo (93.9%, a difference of 0.010%), and South American (93.9%, a difference of 0.030%).
| Demographics | Rating | Rank | 9th Grade |
| Immigrants | Costa Rica | 0.5 /100 | #257 | Tragic 94.0% |
| Immigrants | Thailand | 0.5 /100 | #258 | Tragic 93.9% |
| Ghanaians | 0.5 /100 | #259 | Tragic 93.9% |
| Pima | 0.4 /100 | #260 | Tragic 93.9% |
| South Americans | 0.4 /100 | #261 | Tragic 93.9% |
| Immigrants | Jamaica | 0.4 /100 | #262 | Tragic 93.9% |
| Immigrants | Uzbekistan | 0.4 /100 | #263 | Tragic 93.9% |
| Immigrants | Congo | 0.4 /100 | #264 | Tragic 93.9% |
| Natives/Alaskans | 0.4 /100 | #265 | Tragic 93.9% |
| Navajo | 0.3 /100 | #266 | Tragic 93.9% |
| Armenians | 0.3 /100 | #267 | Tragic 93.9% |
| Immigrants | Bolivia | 0.3 /100 | #268 | Tragic 93.9% |
| Immigrants | Uruguay | 0.2 /100 | #269 | Tragic 93.8% |
| Yuman | 0.2 /100 | #270 | Tragic 93.8% |
| Immigrants | Ghana | 0.2 /100 | #271 | Tragic 93.8% |