Ugandan vs Immigrants from Congo Male Poverty
COMPARE
Ugandan
Immigrants from Congo
Male Poverty
Male Poverty Comparison
Ugandans
Immigrants from Congo
12.2%
MALE POVERTY
2.2/ 100
METRIC RATING
221st/ 347
METRIC RANK
14.7%
MALE POVERTY
0.0/ 100
METRIC RATING
320th/ 347
METRIC RANK
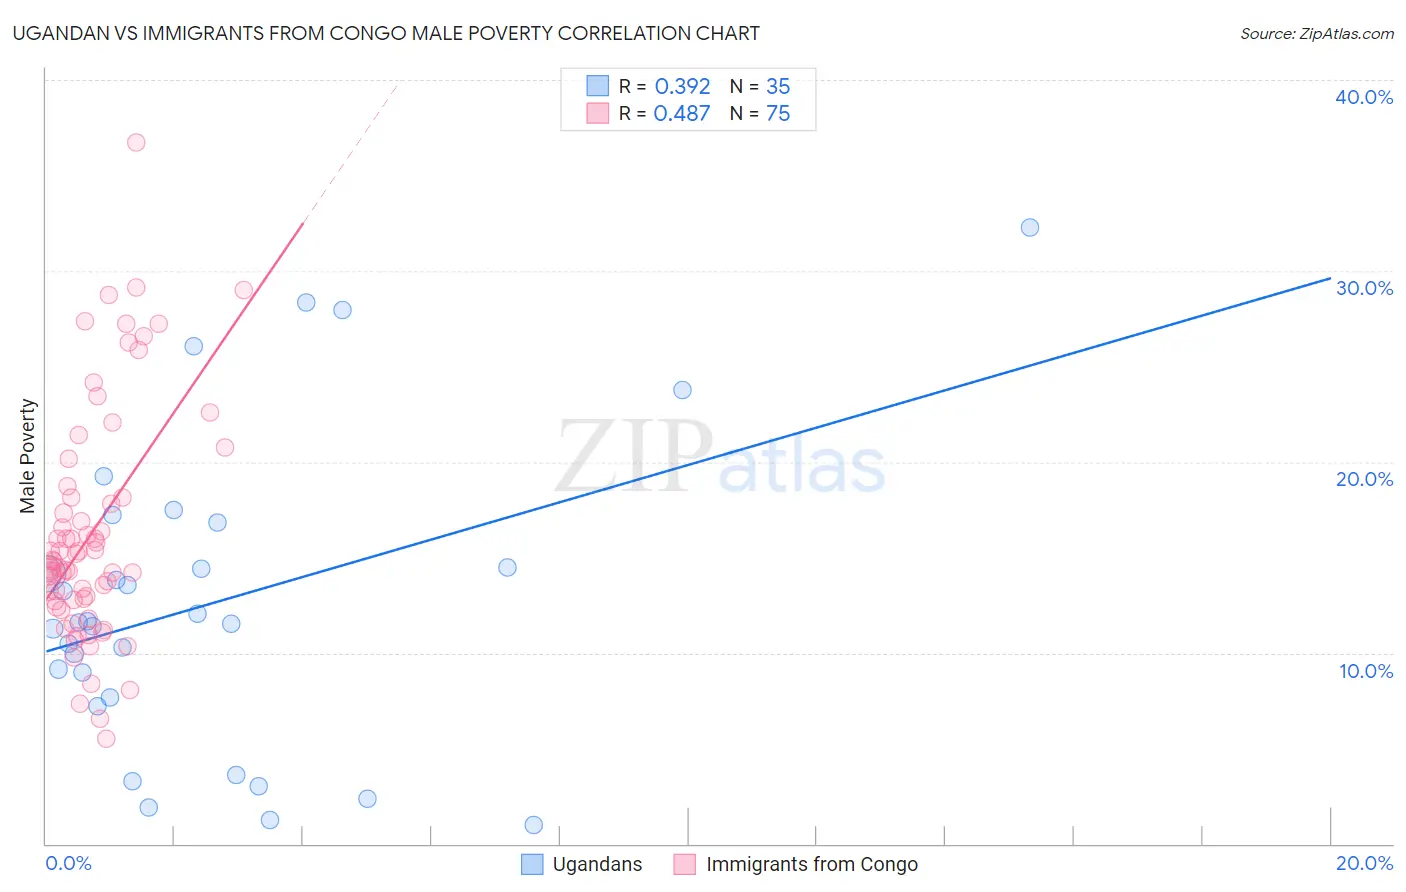
Ugandan vs Immigrants from Congo Male Poverty Correlation Chart
The statistical analysis conducted on geographies consisting of 93,987,101 people shows a mild positive correlation between the proportion of Ugandans and poverty level among males in the United States with a correlation coefficient (R) of 0.392 and weighted average of 12.2%. Similarly, the statistical analysis conducted on geographies consisting of 92,079,849 people shows a moderate positive correlation between the proportion of Immigrants from Congo and poverty level among males in the United States with a correlation coefficient (R) of 0.487 and weighted average of 14.7%, a difference of 20.4%.
Male Poverty Correlation Summary
| Measurement | Ugandan | Immigrants from Congo |
| Minimum | 0.96% | 5.5% |
| Maximum | 32.3% | 36.7% |
| Range | 31.3% | 31.2% |
| Mean | 12.6% | 16.3% |
| Median | 11.6% | 14.8% |
| Interquartile 25% (IQ1) | 7.6% | 12.7% |
| Interquartile 75% (IQ3) | 16.8% | 18.1% |
| Interquartile Range (IQR) | 9.2% | 5.4% |
| Standard Deviation (Sample) | 7.9% | 6.1% |
| Standard Deviation (Population) | 7.8% | 6.0% |
Similar Demographics by Male Poverty
Demographics Similar to Ugandans by Male Poverty
In terms of male poverty, the demographic groups most similar to Ugandans are Immigrants from Africa (12.2%, a difference of 0.020%), Immigrants from Micronesia (12.2%, a difference of 0.040%), Immigrants from Eritrea (12.2%, a difference of 0.21%), Bermudan (12.2%, a difference of 0.23%), and German Russian (12.2%, a difference of 0.29%).
| Demographics | Rating | Rank | Male Poverty |
| Japanese | 2.7 /100 | #214 | Tragic 12.2% |
| Immigrants | Uzbekistan | 2.6 /100 | #215 | Tragic 12.2% |
| Immigrants | Cambodia | 2.5 /100 | #216 | Tragic 12.2% |
| Immigrants | Thailand | 2.5 /100 | #217 | Tragic 12.2% |
| German Russians | 2.5 /100 | #218 | Tragic 12.2% |
| Bermudans | 2.4 /100 | #219 | Tragic 12.2% |
| Immigrants | Eritrea | 2.4 /100 | #220 | Tragic 12.2% |
| Ugandans | 2.2 /100 | #221 | Tragic 12.2% |
| Immigrants | Africa | 2.1 /100 | #222 | Tragic 12.2% |
| Immigrants | Micronesia | 2.1 /100 | #223 | Tragic 12.2% |
| Immigrants | Nigeria | 1.6 /100 | #224 | Tragic 12.3% |
| Osage | 1.5 /100 | #225 | Tragic 12.3% |
| Nigerians | 1.4 /100 | #226 | Tragic 12.3% |
| Alaska Natives | 1.4 /100 | #227 | Tragic 12.4% |
| Alsatians | 1.3 /100 | #228 | Tragic 12.4% |
Demographics Similar to Immigrants from Congo by Male Poverty
In terms of male poverty, the demographic groups most similar to Immigrants from Congo are U.S. Virgin Islander (14.7%, a difference of 0.090%), Immigrants from Grenada (14.7%, a difference of 0.12%), Immigrants from Dominica (14.7%, a difference of 0.18%), British West Indian (14.6%, a difference of 0.86%), and Chippewa (14.6%, a difference of 0.88%).
| Demographics | Rating | Rank | Male Poverty |
| Immigrants | Somalia | 0.0 /100 | #313 | Tragic 14.6% |
| Immigrants | Honduras | 0.0 /100 | #314 | Tragic 14.6% |
| Chippewa | 0.0 /100 | #315 | Tragic 14.6% |
| British West Indians | 0.0 /100 | #316 | Tragic 14.6% |
| Immigrants | Dominica | 0.0 /100 | #317 | Tragic 14.7% |
| Immigrants | Grenada | 0.0 /100 | #318 | Tragic 14.7% |
| U.S. Virgin Islanders | 0.0 /100 | #319 | Tragic 14.7% |
| Immigrants | Congo | 0.0 /100 | #320 | Tragic 14.7% |
| Arapaho | 0.0 /100 | #321 | Tragic 15.1% |
| Kiowa | 0.0 /100 | #322 | Tragic 15.2% |
| Colville | 0.0 /100 | #323 | Tragic 15.2% |
| Menominee | 0.0 /100 | #324 | Tragic 15.3% |
| Yakama | 0.0 /100 | #325 | Tragic 15.3% |
| Central American Indians | 0.0 /100 | #326 | Tragic 15.3% |
| Paiute | 0.0 /100 | #327 | Tragic 15.8% |