Ugandan vs Ethiopian 2 or more Vehicles in Household
COMPARE
Ugandan
Ethiopian
2 or more Vehicles in Household
2 or more Vehicles in Household Comparison
Ugandans
Ethiopians
53.5%
2 OR MORE VEHICLES IN HOUSEHOLD
3.2/ 100
METRIC RATING
233rd/ 347
METRIC RANK
53.1%
2 OR MORE VEHICLES IN HOUSEHOLD
1.7/ 100
METRIC RATING
243rd/ 347
METRIC RANK
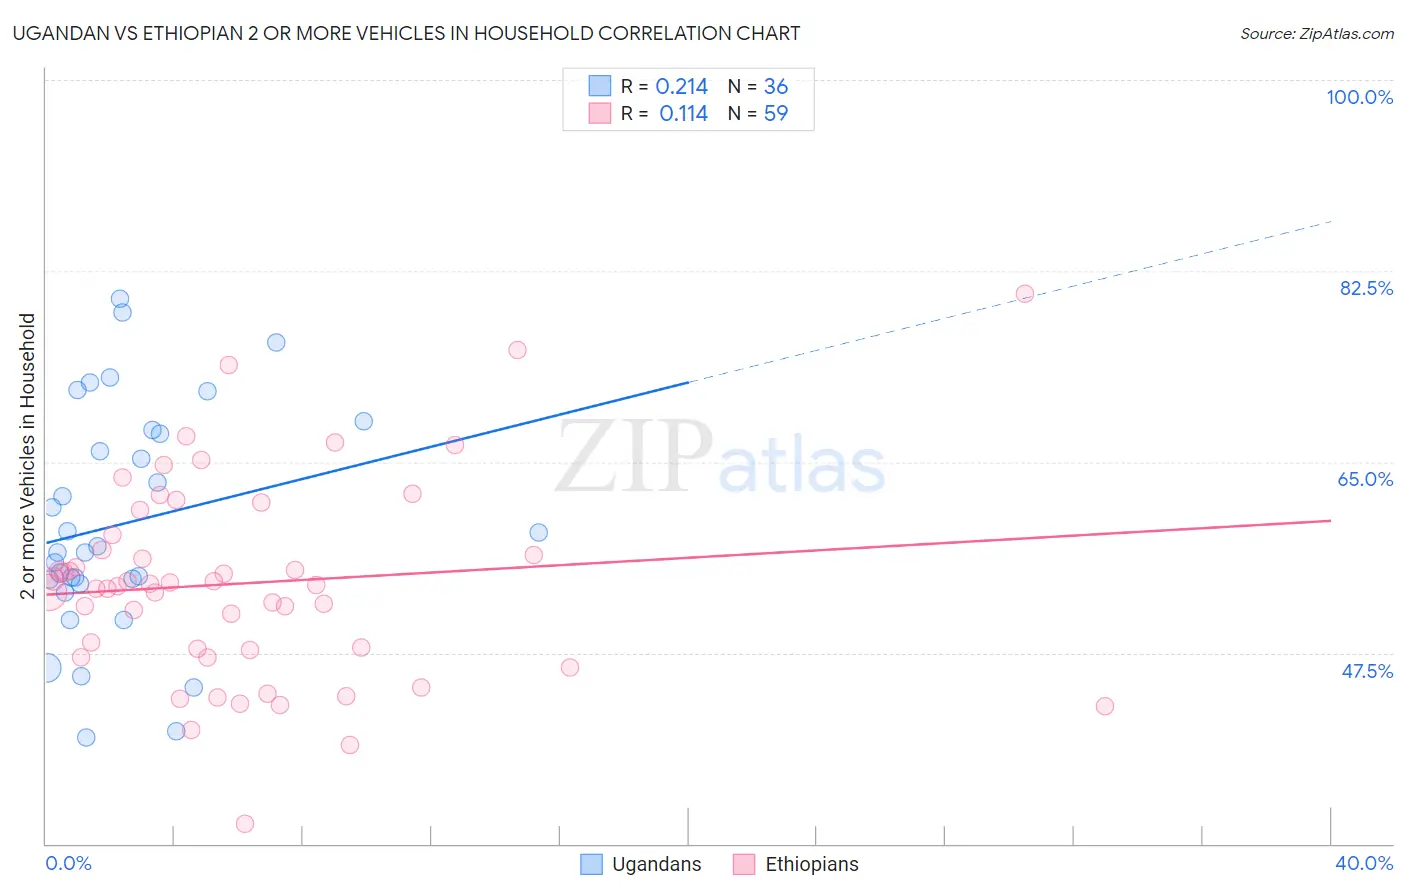
Ugandan vs Ethiopian 2 or more Vehicles in Household Correlation Chart
The statistical analysis conducted on geographies consisting of 93,998,632 people shows a weak positive correlation between the proportion of Ugandans and percentage of households with 2 or more vehicles available in the United States with a correlation coefficient (R) of 0.214 and weighted average of 53.5%. Similarly, the statistical analysis conducted on geographies consisting of 223,123,508 people shows a poor positive correlation between the proportion of Ethiopians and percentage of households with 2 or more vehicles available in the United States with a correlation coefficient (R) of 0.114 and weighted average of 53.1%, a difference of 0.66%.
2 or more Vehicles in Household Correlation Summary
| Measurement | Ugandan | Ethiopian |
| Minimum | 39.7% | 31.9% |
| Maximum | 80.0% | 80.4% |
| Range | 40.3% | 48.5% |
| Mean | 59.4% | 53.9% |
| Median | 57.0% | 53.7% |
| Interquartile 25% (IQ1) | 54.0% | 47.7% |
| Interquartile 75% (IQ3) | 67.8% | 58.3% |
| Interquartile Range (IQR) | 13.8% | 10.5% |
| Standard Deviation (Sample) | 10.4% | 9.1% |
| Standard Deviation (Population) | 10.3% | 9.1% |
Demographics Similar to Ugandans and Ethiopians by 2 or more Vehicles in Household
In terms of 2 or more vehicles in household, the demographic groups most similar to Ugandans are Immigrants from Guatemala (53.5%, a difference of 0.010%), Immigrants from Switzerland (53.4%, a difference of 0.060%), Panamanian (53.5%, a difference of 0.080%), Immigrants from Middle Africa (53.4%, a difference of 0.090%), and Immigrants from Nepal (53.5%, a difference of 0.13%). Similarly, the demographic groups most similar to Ethiopians are Indian (Asian) (53.1%, a difference of 0.040%), Immigrants from Ethiopia (53.0%, a difference of 0.16%), Immigrants from Eastern Asia (53.2%, a difference of 0.19%), Immigrants from Sierra Leone (53.2%, a difference of 0.20%), and Immigrants from Europe (53.2%, a difference of 0.23%).
| Demographics | Rating | Rank | 2 or more Vehicles in Household |
| Alaska Natives | 3.9 /100 | #228 | Tragic 53.6% |
| Immigrants | Turkey | 3.8 /100 | #229 | Tragic 53.6% |
| Immigrants | Nepal | 3.6 /100 | #230 | Tragic 53.5% |
| Panamanians | 3.4 /100 | #231 | Tragic 53.5% |
| Immigrants | Guatemala | 3.2 /100 | #232 | Tragic 53.5% |
| Ugandans | 3.2 /100 | #233 | Tragic 53.5% |
| Immigrants | Switzerland | 3.0 /100 | #234 | Tragic 53.4% |
| Immigrants | Middle Africa | 3.0 /100 | #235 | Tragic 53.4% |
| Indonesians | 2.7 /100 | #236 | Tragic 53.4% |
| Macedonians | 2.4 /100 | #237 | Tragic 53.3% |
| Immigrants | Armenia | 2.3 /100 | #238 | Tragic 53.3% |
| Cambodians | 2.3 /100 | #239 | Tragic 53.3% |
| Immigrants | Europe | 2.1 /100 | #240 | Tragic 53.2% |
| Immigrants | Sierra Leone | 2.1 /100 | #241 | Tragic 53.2% |
| Immigrants | Eastern Asia | 2.1 /100 | #242 | Tragic 53.2% |
| Ethiopians | 1.7 /100 | #243 | Tragic 53.1% |
| Indians (Asian) | 1.7 /100 | #244 | Tragic 53.1% |
| Immigrants | Ethiopia | 1.5 /100 | #245 | Tragic 53.0% |
| Immigrants | Nigeria | 1.2 /100 | #246 | Tragic 52.9% |
| Sierra Leoneans | 1.2 /100 | #247 | Tragic 52.9% |
| Colombians | 1.1 /100 | #248 | Tragic 52.9% |