Liberian vs Immigrants from Congo 2 or more Vehicles in Household
COMPARE
Liberian
Immigrants from Congo
2 or more Vehicles in Household
2 or more Vehicles in Household Comparison
Liberians
Immigrants from Congo
51.7%
2 OR MORE VEHICLES IN HOUSEHOLD
0.1/ 100
METRIC RATING
279th/ 347
METRIC RANK
52.1%
2 OR MORE VEHICLES IN HOUSEHOLD
0.3/ 100
METRIC RATING
265th/ 347
METRIC RANK
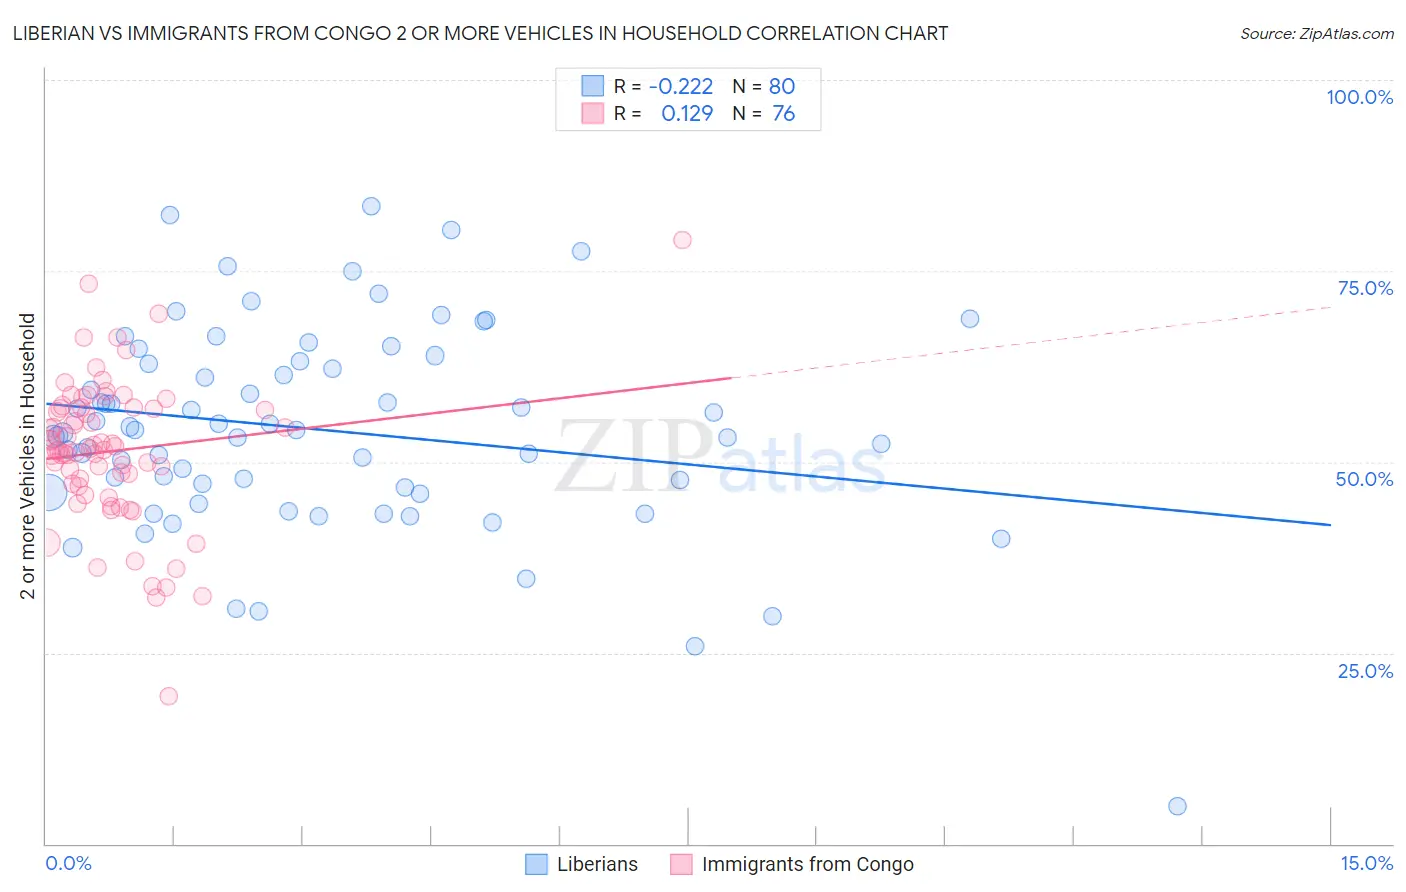
Liberian vs Immigrants from Congo 2 or more Vehicles in Household Correlation Chart
The statistical analysis conducted on geographies consisting of 118,047,251 people shows a weak negative correlation between the proportion of Liberians and percentage of households with 2 or more vehicles available in the United States with a correlation coefficient (R) of -0.222 and weighted average of 51.7%. Similarly, the statistical analysis conducted on geographies consisting of 92,104,745 people shows a poor positive correlation between the proportion of Immigrants from Congo and percentage of households with 2 or more vehicles available in the United States with a correlation coefficient (R) of 0.129 and weighted average of 52.1%, a difference of 0.73%.
2 or more Vehicles in Household Correlation Summary
| Measurement | Liberian | Immigrants from Congo |
| Minimum | 4.9% | 19.4% |
| Maximum | 83.5% | 79.0% |
| Range | 78.6% | 59.6% |
| Mean | 54.2% | 51.4% |
| Median | 54.0% | 51.7% |
| Interquartile 25% (IQ1) | 46.3% | 47.0% |
| Interquartile 75% (IQ3) | 63.0% | 57.1% |
| Interquartile Range (IQR) | 16.7% | 10.1% |
| Standard Deviation (Sample) | 13.4% | 9.7% |
| Standard Deviation (Population) | 13.3% | 9.6% |
Demographics Similar to Liberians and Immigrants from Congo by 2 or more Vehicles in Household
In terms of 2 or more vehicles in household, the demographic groups most similar to Liberians are Yuman (51.7%, a difference of 0.010%), Immigrants from Eastern Europe (51.7%, a difference of 0.030%), Immigrants from Africa (51.8%, a difference of 0.070%), Immigrants from Croatia (51.8%, a difference of 0.13%), and Immigrants from Honduras (51.8%, a difference of 0.15%). Similarly, the demographic groups most similar to Immigrants from Congo are Immigrants from France (52.0%, a difference of 0.14%), Immigrants from Colombia (52.0%, a difference of 0.19%), Pima (52.0%, a difference of 0.20%), Honduran (52.0%, a difference of 0.20%), and Immigrants from Ireland (52.0%, a difference of 0.22%).
| Demographics | Rating | Rank | 2 or more Vehicles in Household |
| Immigrants | Northern Africa | 0.4 /100 | #262 | Tragic 52.3% |
| Immigrants | Southern Europe | 0.4 /100 | #263 | Tragic 52.3% |
| Immigrants | Latvia | 0.4 /100 | #264 | Tragic 52.2% |
| Immigrants | Congo | 0.3 /100 | #265 | Tragic 52.1% |
| Immigrants | France | 0.2 /100 | #266 | Tragic 52.0% |
| Immigrants | Colombia | 0.2 /100 | #267 | Tragic 52.0% |
| Pima | 0.2 /100 | #268 | Tragic 52.0% |
| Hondurans | 0.2 /100 | #269 | Tragic 52.0% |
| Immigrants | Ireland | 0.2 /100 | #270 | Tragic 52.0% |
| South Americans | 0.2 /100 | #271 | Tragic 51.9% |
| Sub-Saharan Africans | 0.2 /100 | #272 | Tragic 51.9% |
| Israelis | 0.2 /100 | #273 | Tragic 51.9% |
| Africans | 0.2 /100 | #274 | Tragic 51.8% |
| Immigrants | Honduras | 0.2 /100 | #275 | Tragic 51.8% |
| Immigrants | Croatia | 0.2 /100 | #276 | Tragic 51.8% |
| Immigrants | Africa | 0.2 /100 | #277 | Tragic 51.8% |
| Yuman | 0.1 /100 | #278 | Tragic 51.7% |
| Liberians | 0.1 /100 | #279 | Tragic 51.7% |
| Immigrants | Eastern Europe | 0.1 /100 | #280 | Tragic 51.7% |
| Immigrants | Kazakhstan | 0.1 /100 | #281 | Tragic 51.6% |
| Bahamians | 0.1 /100 | #282 | Tragic 51.5% |