Ugandan vs Trinidadian and Tobagonian 2 or more Vehicles in Household
COMPARE
Ugandan
Trinidadian and Tobagonian
2 or more Vehicles in Household
2 or more Vehicles in Household Comparison
Ugandans
Trinidadians and Tobagonians
53.5%
2 OR MORE VEHICLES IN HOUSEHOLD
3.2/ 100
METRIC RATING
233rd/ 347
METRIC RANK
40.9%
2 OR MORE VEHICLES IN HOUSEHOLD
0.0/ 100
METRIC RATING
332nd/ 347
METRIC RANK
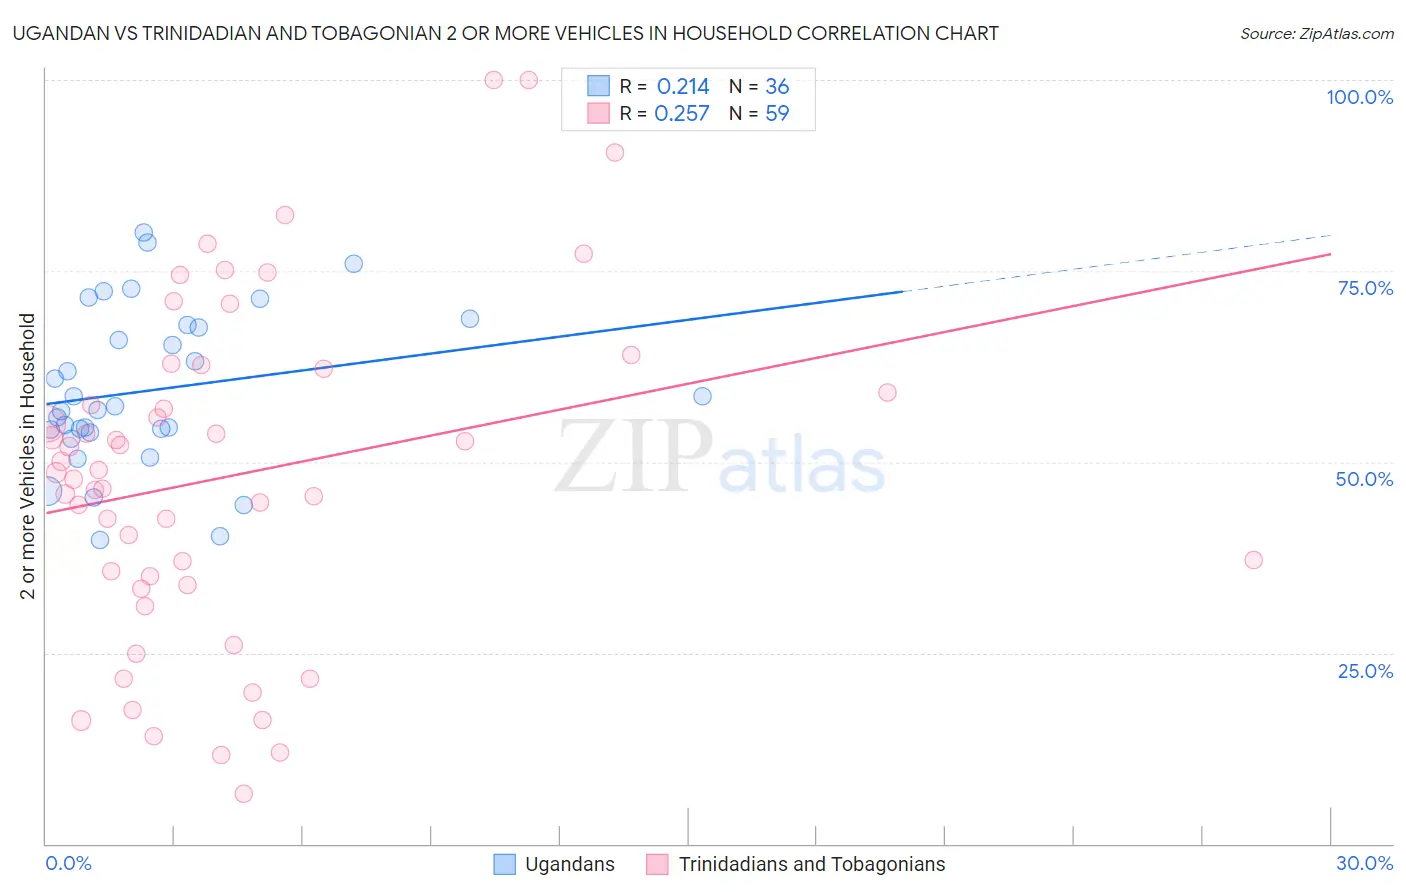
Ugandan vs Trinidadian and Tobagonian 2 or more Vehicles in Household Correlation Chart
The statistical analysis conducted on geographies consisting of 93,998,632 people shows a weak positive correlation between the proportion of Ugandans and percentage of households with 2 or more vehicles available in the United States with a correlation coefficient (R) of 0.214 and weighted average of 53.5%. Similarly, the statistical analysis conducted on geographies consisting of 219,730,048 people shows a weak positive correlation between the proportion of Trinidadians and Tobagonians and percentage of households with 2 or more vehicles available in the United States with a correlation coefficient (R) of 0.257 and weighted average of 40.9%, a difference of 30.8%.
2 or more Vehicles in Household Correlation Summary
| Measurement | Ugandan | Trinidadian and Tobagonian |
| Minimum | 39.7% | 6.5% |
| Maximum | 80.0% | 100.0% |
| Range | 40.3% | 93.5% |
| Mean | 59.4% | 48.2% |
| Median | 57.0% | 48.5% |
| Interquartile 25% (IQ1) | 54.0% | 33.8% |
| Interquartile 75% (IQ3) | 67.8% | 62.3% |
| Interquartile Range (IQR) | 13.8% | 28.4% |
| Standard Deviation (Sample) | 10.4% | 21.9% |
| Standard Deviation (Population) | 10.3% | 21.8% |
Similar Demographics by 2 or more Vehicles in Household
Demographics Similar to Ugandans by 2 or more Vehicles in Household
In terms of 2 or more vehicles in household, the demographic groups most similar to Ugandans are Immigrants from Guatemala (53.5%, a difference of 0.010%), Immigrants from Switzerland (53.4%, a difference of 0.060%), Panamanian (53.5%, a difference of 0.080%), Immigrants from Middle Africa (53.4%, a difference of 0.090%), and Immigrants from Nepal (53.5%, a difference of 0.13%).
| Demographics | Rating | Rank | 2 or more Vehicles in Household |
| Immigrants | Eastern Africa | 5.1 /100 | #226 | Tragic 53.7% |
| Sudanese | 4.1 /100 | #227 | Tragic 53.6% |
| Alaska Natives | 3.9 /100 | #228 | Tragic 53.6% |
| Immigrants | Turkey | 3.8 /100 | #229 | Tragic 53.6% |
| Immigrants | Nepal | 3.6 /100 | #230 | Tragic 53.5% |
| Panamanians | 3.4 /100 | #231 | Tragic 53.5% |
| Immigrants | Guatemala | 3.2 /100 | #232 | Tragic 53.5% |
| Ugandans | 3.2 /100 | #233 | Tragic 53.5% |
| Immigrants | Switzerland | 3.0 /100 | #234 | Tragic 53.4% |
| Immigrants | Middle Africa | 3.0 /100 | #235 | Tragic 53.4% |
| Indonesians | 2.7 /100 | #236 | Tragic 53.4% |
| Macedonians | 2.4 /100 | #237 | Tragic 53.3% |
| Immigrants | Armenia | 2.3 /100 | #238 | Tragic 53.3% |
| Cambodians | 2.3 /100 | #239 | Tragic 53.3% |
| Immigrants | Europe | 2.1 /100 | #240 | Tragic 53.2% |
Demographics Similar to Trinidadians and Tobagonians by 2 or more Vehicles in Household
In terms of 2 or more vehicles in household, the demographic groups most similar to Trinidadians and Tobagonians are Immigrants from Ecuador (40.5%, a difference of 0.92%), West Indian (41.3%, a difference of 0.98%), Immigrants from Trinidad and Tobago (40.3%, a difference of 1.5%), Immigrants from Dominica (41.6%, a difference of 1.8%), and Ecuadorian (42.0%, a difference of 2.7%).
| Demographics | Rating | Rank | 2 or more Vehicles in Household |
| Immigrants | West Indies | 0.0 /100 | #325 | Tragic 43.1% |
| Immigrants | Senegal | 0.0 /100 | #326 | Tragic 43.0% |
| Immigrants | Yemen | 0.0 /100 | #327 | Tragic 42.8% |
| Inupiat | 0.0 /100 | #328 | Tragic 42.6% |
| Ecuadorians | 0.0 /100 | #329 | Tragic 42.0% |
| Immigrants | Dominica | 0.0 /100 | #330 | Tragic 41.6% |
| West Indians | 0.0 /100 | #331 | Tragic 41.3% |
| Trinidadians and Tobagonians | 0.0 /100 | #332 | Tragic 40.9% |
| Immigrants | Ecuador | 0.0 /100 | #333 | Tragic 40.5% |
| Immigrants | Trinidad and Tobago | 0.0 /100 | #334 | Tragic 40.3% |
| Immigrants | Bangladesh | 0.0 /100 | #335 | Tragic 38.8% |
| Vietnamese | 0.0 /100 | #336 | Tragic 38.5% |
| Barbadians | 0.0 /100 | #337 | Tragic 38.3% |
| Immigrants | Uzbekistan | 0.0 /100 | #338 | Tragic 37.9% |
| Immigrants | Barbados | 0.0 /100 | #339 | Tragic 35.8% |