Turkish vs Scandinavian 4 or more Vehicles in Household
COMPARE
Turkish
Scandinavian
4 or more Vehicles in Household
4 or more Vehicles in Household Comparison
Turks
Scandinavians
5.8%
4 OR MORE VEHICLES IN HOUSEHOLD
4.1/ 100
METRIC RATING
237th/ 347
METRIC RANK
8.0%
4 OR MORE VEHICLES IN HOUSEHOLD
100.0/ 100
METRIC RATING
37th/ 347
METRIC RANK
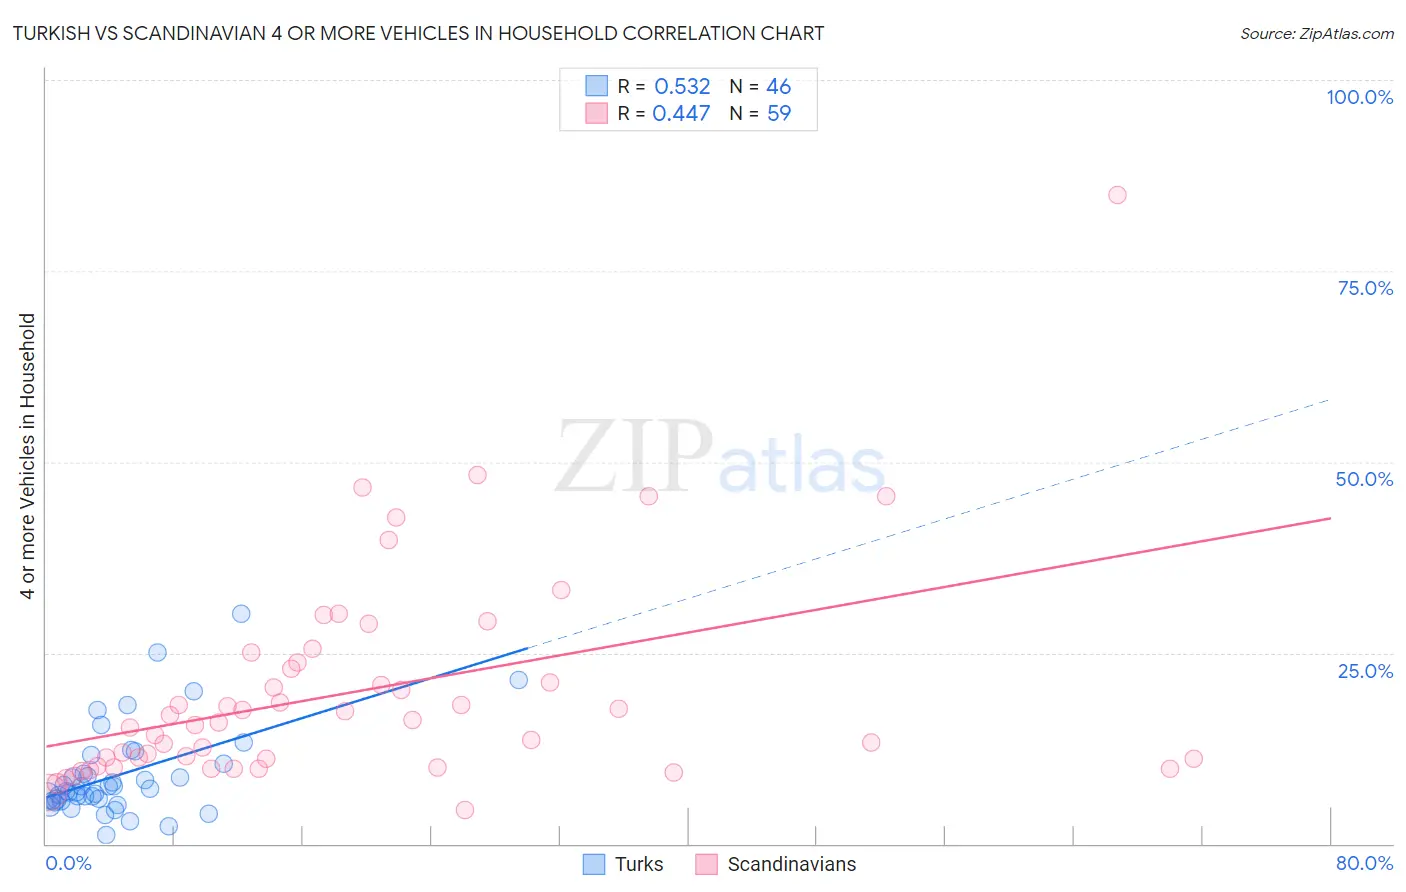
Turkish vs Scandinavian 4 or more Vehicles in Household Correlation Chart
The statistical analysis conducted on geographies consisting of 270,554,311 people shows a substantial positive correlation between the proportion of Turks and percentage of households with 4 or more vehicles available in the United States with a correlation coefficient (R) of 0.532 and weighted average of 5.8%. Similarly, the statistical analysis conducted on geographies consisting of 470,673,976 people shows a moderate positive correlation between the proportion of Scandinavians and percentage of households with 4 or more vehicles available in the United States with a correlation coefficient (R) of 0.447 and weighted average of 8.0%, a difference of 37.1%.
4 or more Vehicles in Household Correlation Summary
| Measurement | Turkish | Scandinavian |
| Minimum | 1.1% | 4.3% |
| Maximum | 30.2% | 85.0% |
| Range | 29.1% | 80.7% |
| Mean | 9.1% | 19.8% |
| Median | 7.0% | 15.9% |
| Interquartile 25% (IQ1) | 5.6% | 10.2% |
| Interquartile 75% (IQ3) | 10.5% | 23.7% |
| Interquartile Range (IQR) | 4.9% | 13.5% |
| Standard Deviation (Sample) | 6.0% | 13.9% |
| Standard Deviation (Population) | 5.9% | 13.8% |
Similar Demographics by 4 or more Vehicles in Household
Demographics Similar to Turks by 4 or more Vehicles in Household
In terms of 4 or more vehicles in household, the demographic groups most similar to Turks are Immigrants from Belgium (5.8%, a difference of 0.13%), Immigrants from Australia (5.8%, a difference of 0.22%), Immigrants from Poland (5.8%, a difference of 0.26%), Immigrants from Eritrea (5.8%, a difference of 0.27%), and Immigrants from Hungary (5.8%, a difference of 0.29%).
| Demographics | Rating | Rank | 4 or more Vehicles in Household |
| Immigrants | Malaysia | 6.7 /100 | #230 | Tragic 5.9% |
| Immigrants | Switzerland | 6.4 /100 | #231 | Tragic 5.9% |
| Immigrants | Argentina | 6.0 /100 | #232 | Tragic 5.9% |
| Sierra Leoneans | 6.0 /100 | #233 | Tragic 5.9% |
| Africans | 4.6 /100 | #234 | Tragic 5.8% |
| Immigrants | Hungary | 4.6 /100 | #235 | Tragic 5.8% |
| Immigrants | Eritrea | 4.5 /100 | #236 | Tragic 5.8% |
| Turks | 4.1 /100 | #237 | Tragic 5.8% |
| Immigrants | Belgium | 4.0 /100 | #238 | Tragic 5.8% |
| Immigrants | Australia | 3.8 /100 | #239 | Tragic 5.8% |
| Immigrants | Poland | 3.8 /100 | #240 | Tragic 5.8% |
| Mongolians | 3.7 /100 | #241 | Tragic 5.8% |
| Immigrants | Middle Africa | 3.4 /100 | #242 | Tragic 5.8% |
| Immigrants | Czechoslovakia | 3.2 /100 | #243 | Tragic 5.8% |
| Ethiopians | 3.2 /100 | #244 | Tragic 5.8% |
Demographics Similar to Scandinavians by 4 or more Vehicles in Household
In terms of 4 or more vehicles in household, the demographic groups most similar to Scandinavians are Sioux (8.0%, a difference of 0.030%), Norwegian (8.0%, a difference of 0.17%), Spanish American (8.0%, a difference of 0.26%), Spanish (7.9%, a difference of 0.89%), and Guamanian/Chamorro (8.1%, a difference of 0.96%).
| Demographics | Rating | Rank | 4 or more Vehicles in Household |
| Navajo | 100.0 /100 | #30 | Exceptional 8.2% |
| Natives/Alaskans | 100.0 /100 | #31 | Exceptional 8.2% |
| Marshallese | 100.0 /100 | #32 | Exceptional 8.1% |
| Yaqui | 100.0 /100 | #33 | Exceptional 8.1% |
| Alaskan Athabascans | 100.0 /100 | #34 | Exceptional 8.1% |
| Guamanians/Chamorros | 100.0 /100 | #35 | Exceptional 8.1% |
| Norwegians | 100.0 /100 | #36 | Exceptional 8.0% |
| Scandinavians | 100.0 /100 | #37 | Exceptional 8.0% |
| Sioux | 100.0 /100 | #38 | Exceptional 8.0% |
| Spanish Americans | 100.0 /100 | #39 | Exceptional 8.0% |
| Spanish | 100.0 /100 | #40 | Exceptional 7.9% |
| Pima | 100.0 /100 | #41 | Exceptional 7.9% |
| Salvadorans | 100.0 /100 | #42 | Exceptional 7.8% |
| Fijians | 100.0 /100 | #43 | Exceptional 7.8% |
| Bhutanese | 100.0 /100 | #44 | Exceptional 7.8% |