Apache vs Scandinavian 4 or more Vehicles in Household
COMPARE
Apache
Scandinavian
4 or more Vehicles in Household
4 or more Vehicles in Household Comparison
Apache
Scandinavians
7.4%
4 OR MORE VEHICLES IN HOUSEHOLD
99.9/ 100
METRIC RATING
77th/ 347
METRIC RANK
8.0%
4 OR MORE VEHICLES IN HOUSEHOLD
100.0/ 100
METRIC RATING
37th/ 347
METRIC RANK
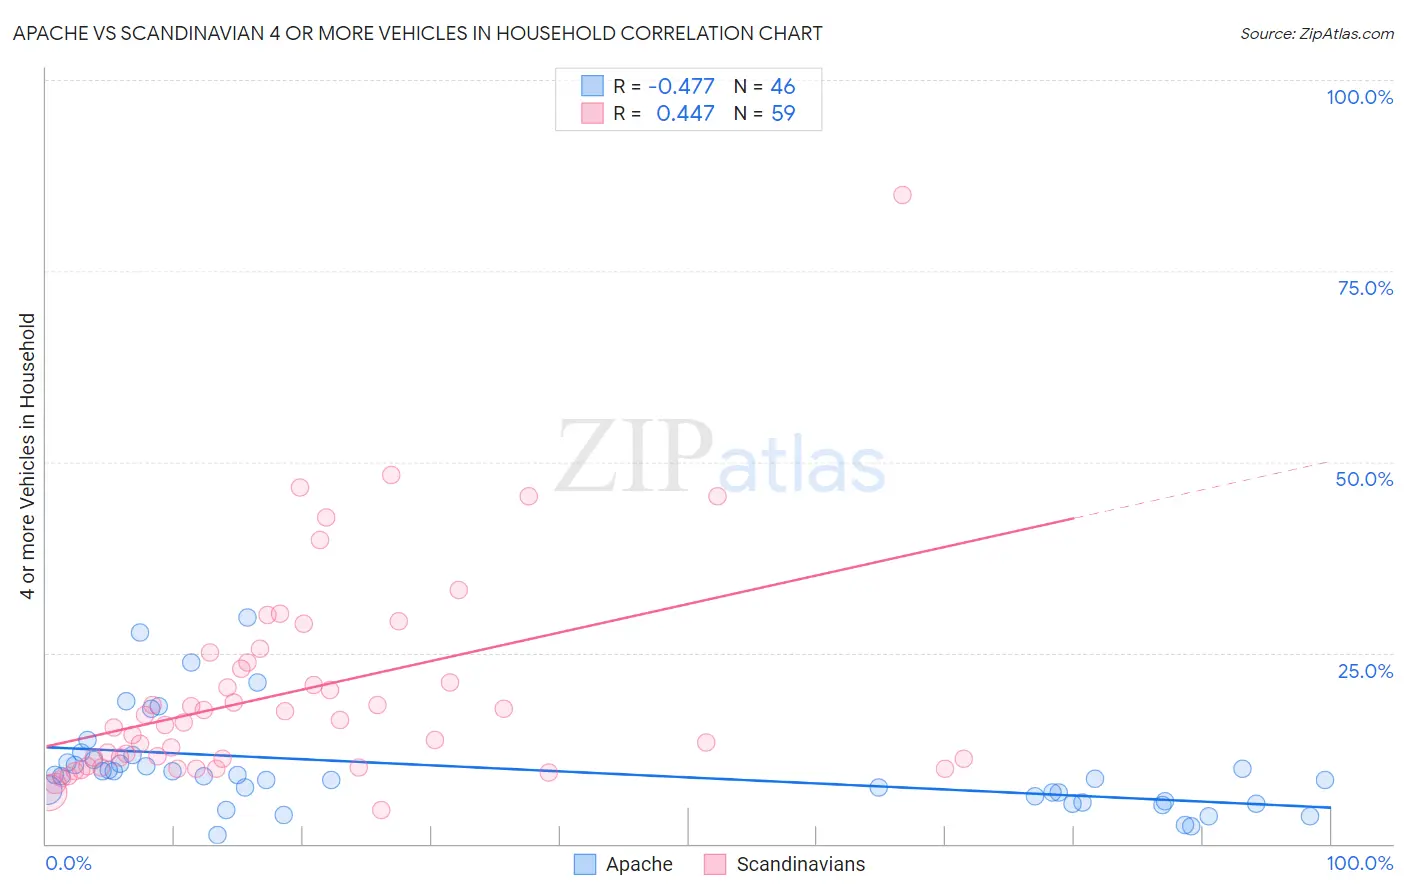
Apache vs Scandinavian 4 or more Vehicles in Household Correlation Chart
The statistical analysis conducted on geographies consisting of 230,812,683 people shows a moderate negative correlation between the proportion of Apache and percentage of households with 4 or more vehicles available in the United States with a correlation coefficient (R) of -0.477 and weighted average of 7.4%. Similarly, the statistical analysis conducted on geographies consisting of 470,673,976 people shows a moderate positive correlation between the proportion of Scandinavians and percentage of households with 4 or more vehicles available in the United States with a correlation coefficient (R) of 0.447 and weighted average of 8.0%, a difference of 8.3%.
4 or more Vehicles in Household Correlation Summary
| Measurement | Apache | Scandinavian |
| Minimum | 1.1% | 4.3% |
| Maximum | 29.6% | 85.0% |
| Range | 28.5% | 80.7% |
| Mean | 9.8% | 19.8% |
| Median | 8.9% | 15.9% |
| Interquartile 25% (IQ1) | 5.6% | 10.2% |
| Interquartile 75% (IQ3) | 10.7% | 23.7% |
| Interquartile Range (IQR) | 5.1% | 13.5% |
| Standard Deviation (Sample) | 6.2% | 13.9% |
| Standard Deviation (Population) | 6.2% | 13.8% |
Similar Demographics by 4 or more Vehicles in Household
Demographics Similar to Apache by 4 or more Vehicles in Household
In terms of 4 or more vehicles in household, the demographic groups most similar to Apache are White/Caucasian (7.4%, a difference of 0.060%), Laotian (7.4%, a difference of 0.17%), Icelander (7.4%, a difference of 0.22%), Immigrants from Cambodia (7.4%, a difference of 0.22%), and Czech (7.4%, a difference of 0.24%).
| Demographics | Rating | Rank | 4 or more Vehicles in Household |
| Scottish | 99.9 /100 | #70 | Exceptional 7.4% |
| Chickasaw | 99.9 /100 | #71 | Exceptional 7.4% |
| Scotch-Irish | 99.9 /100 | #72 | Exceptional 7.4% |
| Portuguese | 99.9 /100 | #73 | Exceptional 7.4% |
| Icelanders | 99.9 /100 | #74 | Exceptional 7.4% |
| Immigrants | Cambodia | 99.9 /100 | #75 | Exceptional 7.4% |
| Laotians | 99.9 /100 | #76 | Exceptional 7.4% |
| Apache | 99.9 /100 | #77 | Exceptional 7.4% |
| Whites/Caucasians | 99.8 /100 | #78 | Exceptional 7.4% |
| Czechs | 99.8 /100 | #79 | Exceptional 7.4% |
| Alaska Natives | 99.8 /100 | #80 | Exceptional 7.3% |
| Finns | 99.8 /100 | #81 | Exceptional 7.3% |
| Northern Europeans | 99.8 /100 | #82 | Exceptional 7.3% |
| Potawatomi | 99.7 /100 | #83 | Exceptional 7.3% |
| Afghans | 99.7 /100 | #84 | Exceptional 7.3% |
Demographics Similar to Scandinavians by 4 or more Vehicles in Household
In terms of 4 or more vehicles in household, the demographic groups most similar to Scandinavians are Sioux (8.0%, a difference of 0.030%), Norwegian (8.0%, a difference of 0.17%), Spanish American (8.0%, a difference of 0.26%), Spanish (7.9%, a difference of 0.89%), and Guamanian/Chamorro (8.1%, a difference of 0.96%).
| Demographics | Rating | Rank | 4 or more Vehicles in Household |
| Navajo | 100.0 /100 | #30 | Exceptional 8.2% |
| Natives/Alaskans | 100.0 /100 | #31 | Exceptional 8.2% |
| Marshallese | 100.0 /100 | #32 | Exceptional 8.1% |
| Yaqui | 100.0 /100 | #33 | Exceptional 8.1% |
| Alaskan Athabascans | 100.0 /100 | #34 | Exceptional 8.1% |
| Guamanians/Chamorros | 100.0 /100 | #35 | Exceptional 8.1% |
| Norwegians | 100.0 /100 | #36 | Exceptional 8.0% |
| Scandinavians | 100.0 /100 | #37 | Exceptional 8.0% |
| Sioux | 100.0 /100 | #38 | Exceptional 8.0% |
| Spanish Americans | 100.0 /100 | #39 | Exceptional 8.0% |
| Spanish | 100.0 /100 | #40 | Exceptional 7.9% |
| Pima | 100.0 /100 | #41 | Exceptional 7.9% |
| Salvadorans | 100.0 /100 | #42 | Exceptional 7.8% |
| Fijians | 100.0 /100 | #43 | Exceptional 7.8% |
| Bhutanese | 100.0 /100 | #44 | Exceptional 7.8% |