Turkish vs Immigrants from Yemen 4 or more Vehicles in Household
COMPARE
Turkish
Immigrants from Yemen
4 or more Vehicles in Household
4 or more Vehicles in Household Comparison
Turks
Immigrants from Yemen
5.8%
4 OR MORE VEHICLES IN HOUSEHOLD
4.1/ 100
METRIC RATING
237th/ 347
METRIC RANK
4.5%
4 OR MORE VEHICLES IN HOUSEHOLD
0.0/ 100
METRIC RATING
322nd/ 347
METRIC RANK
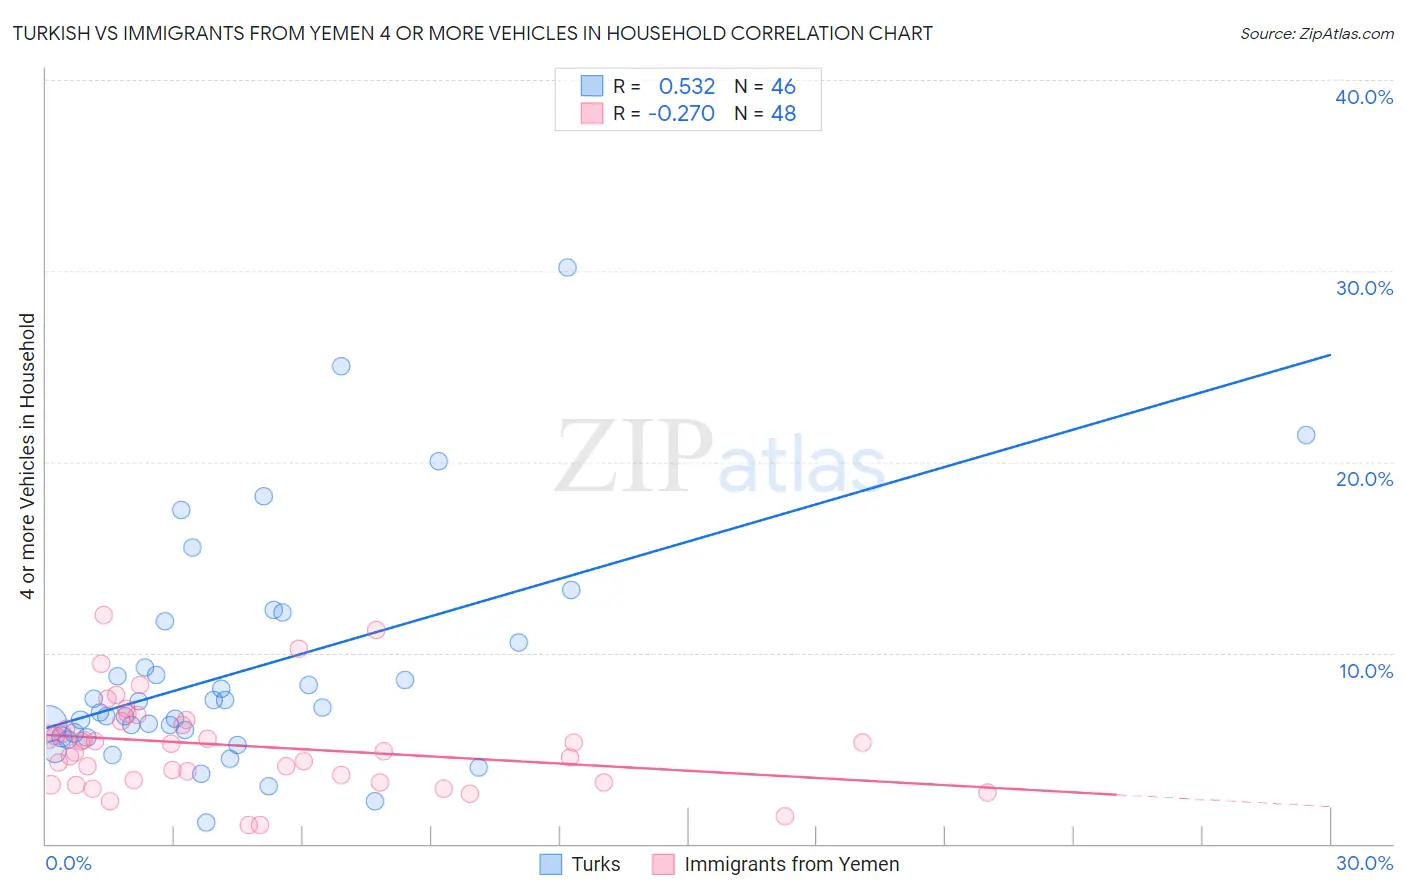
Turkish vs Immigrants from Yemen 4 or more Vehicles in Household Correlation Chart
The statistical analysis conducted on geographies consisting of 270,554,311 people shows a substantial positive correlation between the proportion of Turks and percentage of households with 4 or more vehicles available in the United States with a correlation coefficient (R) of 0.532 and weighted average of 5.8%. Similarly, the statistical analysis conducted on geographies consisting of 82,110,844 people shows a weak negative correlation between the proportion of Immigrants from Yemen and percentage of households with 4 or more vehicles available in the United States with a correlation coefficient (R) of -0.270 and weighted average of 4.5%, a difference of 30.6%.
4 or more Vehicles in Household Correlation Summary
| Measurement | Turkish | Immigrants from Yemen |
| Minimum | 1.1% | 0.96% |
| Maximum | 30.2% | 12.0% |
| Range | 29.1% | 11.0% |
| Mean | 9.1% | 5.1% |
| Median | 7.0% | 5.0% |
| Interquartile 25% (IQ1) | 5.6% | 3.3% |
| Interquartile 75% (IQ3) | 10.5% | 6.3% |
| Interquartile Range (IQR) | 4.9% | 3.1% |
| Standard Deviation (Sample) | 6.0% | 2.4% |
| Standard Deviation (Population) | 5.9% | 2.4% |
Similar Demographics by 4 or more Vehicles in Household
Demographics Similar to Turks by 4 or more Vehicles in Household
In terms of 4 or more vehicles in household, the demographic groups most similar to Turks are Immigrants from Belgium (5.8%, a difference of 0.13%), Immigrants from Australia (5.8%, a difference of 0.22%), Immigrants from Poland (5.8%, a difference of 0.26%), Immigrants from Eritrea (5.8%, a difference of 0.27%), and Immigrants from Hungary (5.8%, a difference of 0.29%).
| Demographics | Rating | Rank | 4 or more Vehicles in Household |
| Immigrants | Malaysia | 6.7 /100 | #230 | Tragic 5.9% |
| Immigrants | Switzerland | 6.4 /100 | #231 | Tragic 5.9% |
| Immigrants | Argentina | 6.0 /100 | #232 | Tragic 5.9% |
| Sierra Leoneans | 6.0 /100 | #233 | Tragic 5.9% |
| Africans | 4.6 /100 | #234 | Tragic 5.8% |
| Immigrants | Hungary | 4.6 /100 | #235 | Tragic 5.8% |
| Immigrants | Eritrea | 4.5 /100 | #236 | Tragic 5.8% |
| Turks | 4.1 /100 | #237 | Tragic 5.8% |
| Immigrants | Belgium | 4.0 /100 | #238 | Tragic 5.8% |
| Immigrants | Australia | 3.8 /100 | #239 | Tragic 5.8% |
| Immigrants | Poland | 3.8 /100 | #240 | Tragic 5.8% |
| Mongolians | 3.7 /100 | #241 | Tragic 5.8% |
| Immigrants | Middle Africa | 3.4 /100 | #242 | Tragic 5.8% |
| Immigrants | Czechoslovakia | 3.2 /100 | #243 | Tragic 5.8% |
| Ethiopians | 3.2 /100 | #244 | Tragic 5.8% |
Demographics Similar to Immigrants from Yemen by 4 or more Vehicles in Household
In terms of 4 or more vehicles in household, the demographic groups most similar to Immigrants from Yemen are Ecuadorian (4.5%, a difference of 0.17%), Immigrants from Caribbean (4.4%, a difference of 0.40%), Soviet Union (4.4%, a difference of 0.69%), Immigrants from Haiti (4.5%, a difference of 0.93%), and Immigrants from Jamaica (4.4%, a difference of 1.0%).
| Demographics | Rating | Rank | 4 or more Vehicles in Household |
| Immigrants | Belarus | 0.0 /100 | #315 | Tragic 4.7% |
| Puerto Ricans | 0.0 /100 | #316 | Tragic 4.7% |
| U.S. Virgin Islanders | 0.0 /100 | #317 | Tragic 4.6% |
| Jamaicans | 0.0 /100 | #318 | Tragic 4.6% |
| Haitians | 0.0 /100 | #319 | Tragic 4.6% |
| Immigrants | Haiti | 0.0 /100 | #320 | Tragic 4.5% |
| Ecuadorians | 0.0 /100 | #321 | Tragic 4.5% |
| Immigrants | Yemen | 0.0 /100 | #322 | Tragic 4.5% |
| Immigrants | Caribbean | 0.0 /100 | #323 | Tragic 4.4% |
| Soviet Union | 0.0 /100 | #324 | Tragic 4.4% |
| Immigrants | Jamaica | 0.0 /100 | #325 | Tragic 4.4% |
| Cape Verdeans | 0.0 /100 | #326 | Tragic 4.4% |
| Senegalese | 0.0 /100 | #327 | Tragic 4.3% |
| Trinidadians and Tobagonians | 0.0 /100 | #328 | Tragic 4.3% |
| Immigrants | Senegal | 0.0 /100 | #329 | Tragic 4.2% |