Turkish vs Immigrants from South America 4 or more Vehicles in Household
COMPARE
Turkish
Immigrants from South America
4 or more Vehicles in Household
4 or more Vehicles in Household Comparison
Turks
Immigrants from South America
5.8%
4 OR MORE VEHICLES IN HOUSEHOLD
4.1/ 100
METRIC RATING
237th/ 347
METRIC RANK
5.2%
4 OR MORE VEHICLES IN HOUSEHOLD
0.1/ 100
METRIC RATING
298th/ 347
METRIC RANK
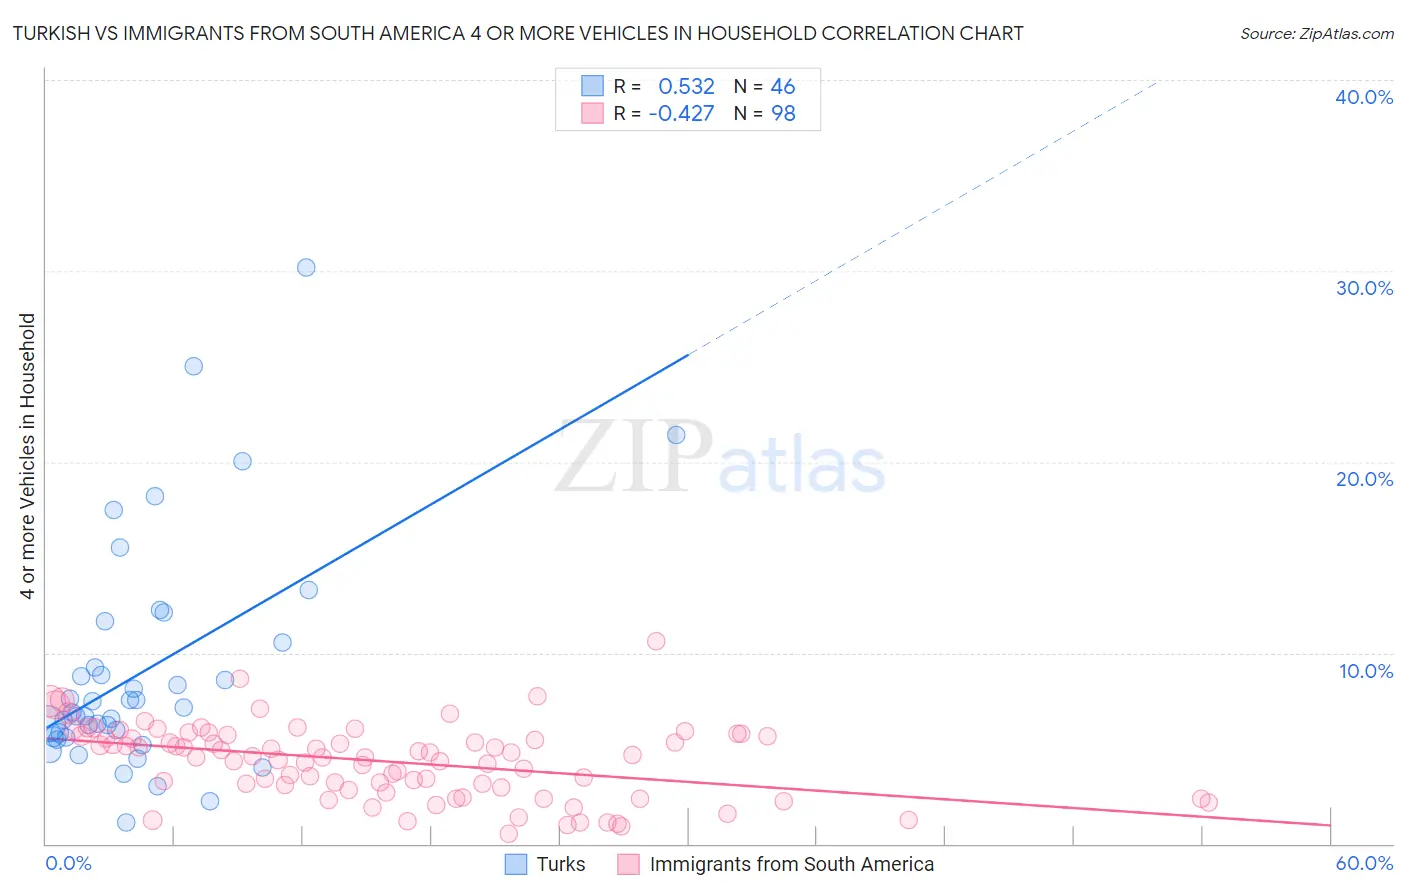
Turkish vs Immigrants from South America 4 or more Vehicles in Household Correlation Chart
The statistical analysis conducted on geographies consisting of 270,554,311 people shows a substantial positive correlation between the proportion of Turks and percentage of households with 4 or more vehicles available in the United States with a correlation coefficient (R) of 0.532 and weighted average of 5.8%. Similarly, the statistical analysis conducted on geographies consisting of 483,870,407 people shows a moderate negative correlation between the proportion of Immigrants from South America and percentage of households with 4 or more vehicles available in the United States with a correlation coefficient (R) of -0.427 and weighted average of 5.2%, a difference of 12.0%.
4 or more Vehicles in Household Correlation Summary
| Measurement | Turkish | Immigrants from South America |
| Minimum | 1.1% | 0.55% |
| Maximum | 30.2% | 10.6% |
| Range | 29.1% | 10.1% |
| Mean | 9.1% | 4.3% |
| Median | 7.0% | 4.5% |
| Interquartile 25% (IQ1) | 5.6% | 2.9% |
| Interquartile 75% (IQ3) | 10.5% | 5.6% |
| Interquartile Range (IQR) | 4.9% | 2.7% |
| Standard Deviation (Sample) | 6.0% | 1.9% |
| Standard Deviation (Population) | 5.9% | 1.9% |
Similar Demographics by 4 or more Vehicles in Household
Demographics Similar to Turks by 4 or more Vehicles in Household
In terms of 4 or more vehicles in household, the demographic groups most similar to Turks are Immigrants from Belgium (5.8%, a difference of 0.13%), Immigrants from Australia (5.8%, a difference of 0.22%), Immigrants from Poland (5.8%, a difference of 0.26%), Immigrants from Eritrea (5.8%, a difference of 0.27%), and Immigrants from Hungary (5.8%, a difference of 0.29%).
| Demographics | Rating | Rank | 4 or more Vehicles in Household |
| Immigrants | Malaysia | 6.7 /100 | #230 | Tragic 5.9% |
| Immigrants | Switzerland | 6.4 /100 | #231 | Tragic 5.9% |
| Immigrants | Argentina | 6.0 /100 | #232 | Tragic 5.9% |
| Sierra Leoneans | 6.0 /100 | #233 | Tragic 5.9% |
| Africans | 4.6 /100 | #234 | Tragic 5.8% |
| Immigrants | Hungary | 4.6 /100 | #235 | Tragic 5.8% |
| Immigrants | Eritrea | 4.5 /100 | #236 | Tragic 5.8% |
| Turks | 4.1 /100 | #237 | Tragic 5.8% |
| Immigrants | Belgium | 4.0 /100 | #238 | Tragic 5.8% |
| Immigrants | Australia | 3.8 /100 | #239 | Tragic 5.8% |
| Immigrants | Poland | 3.8 /100 | #240 | Tragic 5.8% |
| Mongolians | 3.7 /100 | #241 | Tragic 5.8% |
| Immigrants | Middle Africa | 3.4 /100 | #242 | Tragic 5.8% |
| Immigrants | Czechoslovakia | 3.2 /100 | #243 | Tragic 5.8% |
| Ethiopians | 3.2 /100 | #244 | Tragic 5.8% |
Demographics Similar to Immigrants from South America by 4 or more Vehicles in Household
In terms of 4 or more vehicles in household, the demographic groups most similar to Immigrants from South America are Immigrants from Venezuela (5.2%, a difference of 0.34%), Immigrants from Ghana (5.2%, a difference of 0.46%), Israeli (5.2%, a difference of 0.63%), Immigrants from Brazil (5.2%, a difference of 0.81%), and Ghanaian (5.2%, a difference of 0.92%).
| Demographics | Rating | Rank | 4 or more Vehicles in Household |
| Immigrants | Bahamas | 0.1 /100 | #291 | Tragic 5.3% |
| Liberians | 0.1 /100 | #292 | Tragic 5.3% |
| Immigrants | Congo | 0.1 /100 | #293 | Tragic 5.2% |
| Ghanaians | 0.1 /100 | #294 | Tragic 5.2% |
| Immigrants | Brazil | 0.1 /100 | #295 | Tragic 5.2% |
| Israelis | 0.1 /100 | #296 | Tragic 5.2% |
| Immigrants | Venezuela | 0.1 /100 | #297 | Tragic 5.2% |
| Immigrants | South America | 0.1 /100 | #298 | Tragic 5.2% |
| Immigrants | Ghana | 0.1 /100 | #299 | Tragic 5.2% |
| Immigrants | Morocco | 0.0 /100 | #300 | Tragic 5.1% |
| Immigrants | Zaire | 0.0 /100 | #301 | Tragic 5.1% |
| Bahamians | 0.0 /100 | #302 | Tragic 5.1% |
| Immigrants | Greece | 0.0 /100 | #303 | Tragic 5.1% |
| Cypriots | 0.0 /100 | #304 | Tragic 5.0% |
| Somalis | 0.0 /100 | #305 | Tragic 5.0% |